Visualization of-selected-algorithms-of-graph-theory
0 likes1,055 views

This document discusses using visualization and interactive programs like GeoGebra to teach graph theory algorithms. It notes that visualization allows students to better understand problems by emphasizing important aspects and highlighting features. GeoGebra specifically can visualize graphs, minimum distance paths, and algorithms like Dijkstra's. It supports teaching goals of developing logical and creative thinking by letting students interact with mathematical concepts and solve problems. Visualization programs promote activity, creativity, and algorithmic thinking in students.


Visualization of-selected-algorithms-of-graph-theory
- 1. Catholic University in Ružomberok Faculty of Education Visualization of Selected Algorithms of Graph Theory Hedviga Palásthy, Ján Gunčaga hp@ku.sk
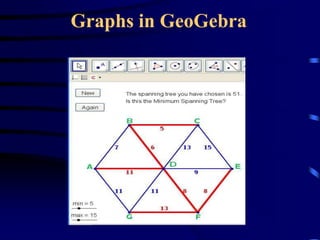
- 2. Main parts • Visualization in the education • Graph in GeoGebra • Algorithm in the graph theory
- 3. Visualization • method for the visual interpretation of data, which uses the advantages of human perception in the analysis, • allows students to understand the presented problem better and more quickly, • provides an option to highlight or suppress some important features.
- 4. Effective visualization • abstract and emphasize the important aspects of the program in the moment, • provides an option to highlight or suppress some important features, • interactive environment, clear, economical and attractive design
- 5. Visualization programs • to apply curriculum in new situations, • promoting activity of students , • develop creativity, logical and algorithmic thinking of students , • to learn to give information to the interrelations, • to understand the presented problem better and more quickly.
- 6. Teaching mathematics and GeoGebra Many educators say that the main goals of teaching mathematics are: • the development of logical thinking • the development of creative thinking • the development of an autonomous person • the development of the ability to solve problems. GeoGebra allows to implement these goals in mathematics education.
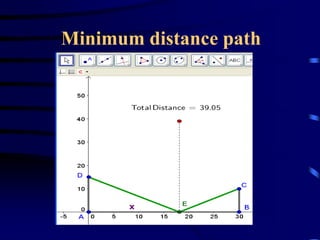
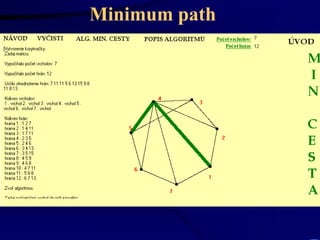
- 10. Minimum path
- 11. Visualization of Dijkstra algorithm
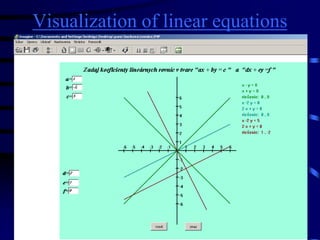
- 14. Visualization of linear equations
- 15. Visualization of trigonometric functions
- 19. GeoGebra Wiki - French
- 20. Thanks for your attention