SlideShare a Scribd company logo
© 2014 MapR Technologies 1 
Anomaly Detection 
How to Find What You Didn’t 
Know to Look For 
© MapR Technologies, confidential 
October 14, 2014
© 2014 MapR Technologies 2 
Anomaly Detection: 
How To Find What You Didn’t Know to Look For 
Ted Dunning, Chief Applications Architect MapR Technologies 
Email tdunning@mapr.com tdunning@apache.org 
Twitter @Ted_Dunning 
Ellen Friedman, Consultant and Commentator 
Email ellenf@apache.org 
Twitter @Ellen_Friedman
A New Look at Anomaly Detection 
by Ted Dunning and Ellen Friedman © June 2014 (published by O’Reilly) 
e-book available courtesy of MapR 
http://bit.ly/1jQ9QuL 
© 2014 MapR Technologies 3
Practical Machine Learning series (O’Reilly) 
• Machine learning is becoming mainstream 
• Need pragmatic approaches that take into account real world 
business settings: 
– Time to value 
– Limited resources 
– Availability of data 
– Expertise and cost of team to develop and to maintain system 
• Look for approaches with big benefits for the effort expended 
© 2014 MapR Technologies 4
© 2014 MapR Technologies 5 
Anomaly Detection
© 2014 MapR Technologies 6 
Who Needs Anomaly Detection? 
Utility providers using 
smart meters
© 2014 MapR Technologies 7 
Who Needs Anomaly Detection? 
Feedback from 
manufacturing assembly 
lines
© 2014 MapR Technologies 8 
Who Needs Anomaly Detection? 
Monitoring data traffic on 
communication networks
© 2014 MapR Technologies 9 
What is Anomaly Detection? 
• The goal is to discover rare events 
– especially those that shouldn’t have happened 
• Find a problem before other people see it 
– especially before it causes a problem for customers 
• Why is this a challenge? 
– I don’t know what an anomaly looks like (yet)
© 2014 MapR Technologies 10 
Spot the Anomaly
© 2014 MapR Technologies 11 
Spot the Anomaly 
Looks pretty 
anomalous 
to me
© 2014 MapR Technologies 12 
Spot the Anomaly 
Will the real anomaly 
please stand up?
© 2014 MapR Technologies 13 
Basic idea: 
Find “normal” first
© 2014 MapR Technologies 14 
Steps in Anomaly Detection 
• Build a model: Collect and process data for training a model 
• Use the machine learning model to determine what is the normal 
pattern 
• Decide how far away from this normal pattern you’ll consider to 
be anomalous 
• Use the AD model to detect anomalies in new data 
– Methods such as clustering for discovery can be helpful
How hard is it to set an alert for anomalies? 
Grey data is from normal events; x’s are anomalies. 
Where would you set the threshold? 
© 2014 MapR Technologies 15
© 2014 MapR Technologies 16 
Basic idea: 
Set adaptive thresholds
© 2014 MapR Technologies 17 
What Are We Really Doing 
• We want action when something breaks 
(dies/falls over/otherwise gets in trouble) 
• But action is expensive 
• So we don’t want too many false alarms 
• And we don’t want too many false negatives 
• What’s the right threshold to set for alerts? 
– We need to trade off costs
© 2014 MapR Technologies 18 
A Second Look
© 2014 MapR Technologies 19 
A Second Look 
99.9%-ile
New algorithm: t-digest 
© 2014 MapR Technologies 20
© 2014 MapR Technologies 21 
How Hard Can it Be? 
Online 
Summarizer 
x > t ? Alarm ! 
99.9%-ile 
t 
x
© 2014 MapR Technologies 22 
Detecting Anomalies in Sporadic Events 
0.0 0.2 0.4 0.6 0.8 1.0 
0 5000 10000 15000 20000 
pnorm(centroids[order(centroids)]) 
counts[order(centroids)]
© 2014 MapR Technologies 23 
Using t-Digest 
• Apache Mahout uses t-digest as an on-line percentile estimator 
– very high accuracy for extreme tails 
– new in version Mahout v 0.9 
• t-digest also available elsewhere 
– in streamlib (open source library on github) 
– standalone (github and Maven Central) 
• What’s the big deal with anomaly detection? 
• This looks like a solved problem
© 2014 MapR Technologies 24 
Already Done? Etsy Skyline?
© 2014 MapR Technologies 25 
What About This? 
0 5 10 15 
offset + noise + pulse1 + pulse2 
−2 0 2 4 6 8 10 
A 
B
© 2014 MapR Technologies 26 
Model Delta Anomaly Detection 
+ δ 
Online 
Summarizer 
δ > t ? 
t 
99.9%-ile 
Alarm ! 
Model 
-
The Real Inside Scoop 
• The model-delta anomaly detector is really just a sum of random 
© 2014 MapR Technologies 27 
variables 
– the model we know about already 
– and a normally distributed error 
• The output (delta) is (roughly) the log probability of the sum 
distribution (really δ2) 
• Thinking about probability distributions is good 
• But how do you handle AD in systems with sporadic events?
© 2014 MapR Technologies 28 
Spot the Anomaly 
Anomaly?
© 2014 MapR Technologies 29 
Maybe not!
© 2014 MapR Technologies 30 
Where’s Waldo? 
This is the real 
anomaly
© 2014 MapR Technologies 31 
Normal Isn’t Just Normal 
• What we want is a model of what is normal 
• What doesn’t fit the model is the anomaly 
• For simple signals, the model can be simple … 
x ~ N(0,e ) 
• The real world is rarely so accommodating
© 2014 MapR Technologies 32 
We Do Windows
© 2014 MapR Technologies 33 
We Do Windows
© 2014 MapR Technologies 34 
We Do Windows
© 2014 MapR Technologies 35 
We Do Windows
© 2014 MapR Technologies 36 
We Do Windows
© 2014 MapR Technologies 37 
We Do Windows
© 2014 MapR Technologies 38 
We Do Windows
© 2014 MapR Technologies 39 
We Do Windows
© 2014 MapR Technologies 40 
We Do Windows
© 2014 MapR Technologies 41 
We Do Windows
© 2014 MapR Technologies 42 
We Do Windows
© 2014 MapR Technologies 43 
We Do Windows
© 2014 MapR Technologies 44 
We Do Windows
© 2014 MapR Technologies 45 
We Do Windows
© 2014 MapR Technologies 46 
We Do Windows
© 2014 MapR Technologies 47 
Windows on the World 
• The set of windowed signals is a nice model of our original signal 
• Clustering can find the prototypes 
– Fancier techniques available using sparse coding 
• The result is a dictionary of shapes 
• New signals can be encoded by shifting, scaling and adding 
shapes from the dictionary
© 2014 MapR Technologies 48 
Most Common Shapes (for EKG)
< 1 bit / sample 
© 2014 MapR Technologies 49 
Reconstructed signal 
Original 
signal 
Reconstructed 
signal 
Reconstruction 
error
© 2014 MapR Technologies 50 
An Anomaly 
Original technique for finding 
1-d anomaly works against 
reconstruction error
© 2014 MapR Technologies 51 
Close-up of anomaly 
Not what you want your 
heart to do. 
And not what the model 
expects it to do.
© 2014 MapR Technologies 52 
A Different Kind of Anomaly
© 2014 MapR Technologies 53 
Model Delta Anomaly Detection 
+ δ 
Online 
Summarizer 
δ > t ? 
t 
99.9%-ile 
Alarm ! 
Model 
-
© 2014 MapR Technologies 54 
The Real Inside Scoop 
• The model-delta anomaly detector is really just a sum of random 
variables 
– the model we know about already 
– and a normally distributed error 
• The output (delta) is (roughly) the log probability of the sum 
distribution (really δ2) 
• Thinking about probability distributions is good
Anomalies among sporadic events 
© 2014 MapR Technologies 55
Sporadic Web Traffic to an e-Business Site 
© 2014 MapR Technologies 56 
It’s important to know if traffic is stopped or 
delayed because of a problem… 
But visits to site normally come at 
varying intervals. 
How long after the last event 
should you begin to worry?
Sporadic Web Traffic to an e-Business Site 
© 2014 MapR Technologies 57 
It’s important to know if traffic is stopped or 
delayed because of a problem… 
But visits to site normally come at 
varying intervals. 
And how do you let your CEO 
sleep through the night?
© 2014 MapR Technologies 58 
Basic idea: 
Time interval between events is how 
to convert to something useful you 
can measure
Sporadic Events: Finding Normal and Anomalous Patterns 
• Time between intervals is much more usable than absolute times 
© 2014 MapR Technologies 59 
• Counts don’t link as directly to probability models 
• Time interval is log ρ 
• This is a big deal
© 2014 MapR Technologies 60 
Event Stream (timing) 
• Events of various types arrive at irregular intervals 
– we can assume Poisson distribution 
• The key question is whether frequency has changed relative to 
expected values 
– This shows up as a change in interval 
• Want alert as soon as possible
© 2014 MapR Technologies 61 
Converting Event Times to Anomaly 
99.9%-ile 
99.99%-ile
But in the real world, event 
© 2014 MapR Technologies 62 
rates often change
Time Intervals Are Key to Modeling Sporadic Events 
© 2014 MapR Technologies 63
© 2014 MapR Technologies 64 
Model-Scaled Intervals Solve the Problem
© 2014 MapR Technologies 65 
Model Delta Anomaly Detection 
+ δ 
Online 
Summarizer 
δ > t ? 
t 
99.9%-ile 
Alarm ! 
Model 
- 
log p
© 2014 MapR Technologies 66 
Detecting Anomalies in Sporadic Events 
Incoming 
events 
99.97%-ile 
Alarm 
Δn 
Rate 
predictor 
Rate 
history 
t-digest 
δ> t 
t i δ λ(t i - t i - n) 
λ 
t
© 2014 MapR Technologies 67 
Detecting Anomalies in Sporadic Events 
Incoming 
events 
99.97%-ile 
Alarm 
Δn 
Rate 
predictor 
Rate 
history 
t-digest 
δ> t 
t i δ λ(t i - t i - n) 
λ 
t
© 2014 MapR Technologies 68 
Slipped Week: Simple Rate Predictor 
Nov 02 Nov 07 Nov 12 Nov 17 Nov 22 Nov 27 Dec 02 
0 100 200 300 400 500 
Main Page Traffic 
Date 
Hits (x 1000) 
A B C D
© 2014 MapR Technologies 69 
Poisson Distribution 
• Time between events is exponentially distributed 
Dt ~ le-lt 
• This means that long delays are exponentially rare 
P(Dt > T) = e-lT 
-logP(Dt > T) = lT 
• If we know λ we can select a good threshold 
– or we can pick a threshold empirically
© 2014 MapR Technologies 70 
Seasonality Poses a Challenge 
Nov 17 Nov 27 Dec 07 Dec 17 Dec 27 
0 2 4 6 8 
Christmas Traffic 
Date 
Hits / 1000
© 2014 MapR Technologies 71 
Something more is needed … 
Nov 17 Nov 27 Dec 07 Dec 17 Dec 27 
0 2 4 6 8 
Christmas Traffic 
Date 
Hits / 1000
© 2014 MapR Technologies 72 
We need a better rate predictor… 
Incoming 
events 
99.97%-ile 
Alarm 
Δn 
Rate 
predictor 
Rate 
history 
t-digest 
δ> t 
t i δ λ(t i - t i - n) 
λ 
t
© 2014 MapR Technologies 73 
A New Rate Predictor for Sporadic Events
Improved Prediction with Adaptive Modeling 
© 2014 MapR Technologies 74 
Dec 17 Dec 19 Dec 21 Dec 23 Dec 25 Dec 27 Dec 29 
0 2 4 6 8 
Christmas Prediction 
Date 
Hits (x 1000)
Anomaly Detection + Classification  Useful Pair 
© 2014 MapR Technologies 75 
• Use the AD model to detect anomalies in new data 
– Methods such as clustering for discovery can be helpful 
• Once you have well-defined models in your system, you may 
also want to use classification to tag those 
• Continue to use the AD model to find new anomalies
© 2014 MapR Technologies 76 
Recap (out of order) 
• Anomaly detection is best done with a probability model 
• -log p is a good way to convert to anomaly measure 
• Adaptive quantile estimation (t-digest) works for auto-setting 
thresholds
© 2014 MapR Technologies 77 
Recap 
• Different systems require different models 
• Continuous time-series 
– sparse coding to build signal model 
• Events in time 
– rate model base on variable rate Poisson 
– segregated rate model 
• Events with labels 
– language modeling 
– hidden Markov models
© 2014 MapR Technologies 78 
Why Use Anomaly Detection?
© 2014 MapR Technologies 79 
Keep in mind… 
• Model normal, then find 
anomalies 
- 
• t-digest for adaptive threshold 
• Probabilistic models for 
complex patterns 
0 5 10 15 
−2 0 2 4 6 8 10 
offset + noise + pulse1 + pulse2 
A 
B
Dec 17 Dec 19 Dec 21 Dec 23 Dec 25 Dec 27 Dec 29 
© 2014 MapR Technologies 80 
0 2 4 6 8 
Christmas Prediction 
Date 
Hits (x 1000) 
Keep in mind… 
• Time intervals are key for 
sporadic events 
• Complex time shift to predict 
rate with seasonality 
• Sequence of events reveals 
phishing attack
A New Look at Anomaly Detection 
by Ted Dunning and Ellen Friedman © June 2014 (published by O’Reilly) 
e-book available courtesy of MapR 
http://bit.ly/1jQ9QuL 
© 2014 MapR Technologies 81
Coming in October: Time Series Databases 
by Ted Dunning and Ellen Friedman © Oct 2014 (published by O’Reilly) 
© 2014 MapR Technologies 82
Thank you for coming today! 
© 2014 MapR Technologies 83
© 2014 MapR Technologies 85 
© MapR Technologies, confidential
© 2014 MapR Technologies 86 
Sandbox

More Related Content

PPTX
Doing-the-impossible
PPTX
Real-time Puppies and Ponies - Evolving Indicator Recommendations in Real-time
PPTX
Which Algorithms Really Matter
PPTX
What is the past future tense of data?
PPTX
Cheap learning-dunning-9-18-2015
PDF
Strata 2014 Anomaly Detection
PPTX
Dunning time-series-2015
PPTX
Possible Visions for Mahout 1.0
Doing-the-impossible
Real-time Puppies and Ponies - Evolving Indicator Recommendations in Real-time
Which Algorithms Really Matter
What is the past future tense of data?
Cheap learning-dunning-9-18-2015
Strata 2014 Anomaly Detection
Dunning time-series-2015
Possible Visions for Mahout 1.0

What's hot (20)

PPTX
Sharing Sensitive Data Securely
PPTX
Real time-hadoop
PPTX
What's new in Apache Mahout
PPTX
Finding Changes in Real Data
PPTX
How to Determine which Algorithms Really Matter
PPTX
Where is Data Going? - RMDC Keynote
PPTX
Cognitive computing with big data, high tech and low tech approaches
PPTX
My talk about recommendation and search to the Hive
PPTX
Recommendation Techn
PPTX
Deep Learning for Fraud Detection
PPTX
Building multi-modal recommendation engines using search engines
PPTX
T digest-update
PDF
Mathematical bridges From Old to New
PPTX
Polyvalent recommendations
PPTX
Using Mahout and a Search Engine for Recommendation
PPTX
Buzz words-dunning-real-time-learning
PPTX
Dunning ml-conf-2014
PPTX
How to tell which algorithms really matter
PPTX
Tensor Abuse - how to reuse machine learning frameworks
PPTX
Machine Learning logistics
Sharing Sensitive Data Securely
Real time-hadoop
What's new in Apache Mahout
Finding Changes in Real Data
How to Determine which Algorithms Really Matter
Where is Data Going? - RMDC Keynote
Cognitive computing with big data, high tech and low tech approaches
My talk about recommendation and search to the Hive
Recommendation Techn
Deep Learning for Fraud Detection
Building multi-modal recommendation engines using search engines
T digest-update
Mathematical bridges From Old to New
Polyvalent recommendations
Using Mahout and a Search Engine for Recommendation
Buzz words-dunning-real-time-learning
Dunning ml-conf-2014
How to tell which algorithms really matter
Tensor Abuse - how to reuse machine learning frameworks
Machine Learning logistics
Ad

Similar to Anomaly Detection - New York Machine Learning (20)

PPTX
Anomaly Detection: How to find what you didn’t know to look for
PPTX
How to find what you didn't know to look for, oractical anomaly detection
PDF
Strata 2014-tdunning-anomaly-detection-140211162923-phpapp01
PPTX
Realistic Synthetic Generation Allows Secure Development
PPTX
Realistic Synthetic Generation Allows Secure Development
PPTX
Anomaly Detection and Spark Implementation - Meetup Presentation.pptx
PDF
Anomaly detection (Unsupervised Learning) in Machine Learning
PDF
Influx/Days 2017 San Francisco | Baron Schwartz
PPTX
Time Series Anomaly Detection with .net and Azure
PDF
Analytics for large-scale time series and event data
PDF
AI in anomaly detection - An Overview.pdf
PPTX
Traffic anomaly detection and attack
PDF
AI in anomaly detection.pdf
PPTX
Time Series Anomaly Detection for .net and Azure
PPTX
Anomalies and events keep us on our toes
PPTX
Anomaly Detection - Real World Scenarios, Approaches and Live Implementation
PPTX
Time Series Anomaly Detection with .net and Azure
PDF
Anomaly Detection in Telecom with Spark - Tugdual Grall - Codemotion Amsterda...
PDF
Empowering anomaly detection algorithm: a review
PPTX
"Building Anomaly Detection For Large Scale Analytics", Yonatan Ben Shimon, A...
Anomaly Detection: How to find what you didn’t know to look for
How to find what you didn't know to look for, oractical anomaly detection
Strata 2014-tdunning-anomaly-detection-140211162923-phpapp01
Realistic Synthetic Generation Allows Secure Development
Anomaly Detection and Spark Implementation - Meetup Presentation.pptx
Anomaly detection (Unsupervised Learning) in Machine Learning
Influx/Days 2017 San Francisco | Baron Schwartz
Time Series Anomaly Detection with .net and Azure
Analytics for large-scale time series and event data
AI in anomaly detection - An Overview.pdf
Traffic anomaly detection and attack
AI in anomaly detection.pdf
Time Series Anomaly Detection for .net and Azure
Anomalies and events keep us on our toes
Anomaly Detection - Real World Scenarios, Approaches and Live Implementation
Time Series Anomaly Detection with .net and Azure
Anomaly Detection in Telecom with Spark - Tugdual Grall - Codemotion Amsterda...
Empowering anomaly detection algorithm: a review
"Building Anomaly Detection For Large Scale Analytics", Yonatan Ben Shimon, A...
Ad

More from Ted Dunning (8)

PPTX
Dunning - SIGMOD - Data Economy.pptx
PPTX
How to Get Going with Kubernetes
PPTX
Progress for big data in Kubernetes
PPTX
Streaming Architecture including Rendezvous for Machine Learning
PPTX
Machine Learning Logistics
PPTX
How the Internet of Things is Turning the Internet Upside Down
PPTX
Apache Kylin - OLAP Cubes for SQL on Hadoop
PPTX
Inside MapR's M7
Dunning - SIGMOD - Data Economy.pptx
How to Get Going with Kubernetes
Progress for big data in Kubernetes
Streaming Architecture including Rendezvous for Machine Learning
Machine Learning Logistics
How the Internet of Things is Turning the Internet Upside Down
Apache Kylin - OLAP Cubes for SQL on Hadoop
Inside MapR's M7

Recently uploaded (20)

PDF
Chapter 3 Spatial Domain Image Processing.pdf
PDF
Modernizing your data center with Dell and AMD
PDF
Spectral efficient network and resource selection model in 5G networks
PDF
Architecting across the Boundaries of two Complex Domains - Healthcare & Tech...
DOCX
The AUB Centre for AI in Media Proposal.docx
PDF
7 ChatGPT Prompts to Help You Define Your Ideal Customer Profile.pdf
PDF
CIFDAQ's Market Insight: SEC Turns Pro Crypto
PDF
Agricultural_Statistics_at_a_Glance_2022_0.pdf
PDF
TokAI - TikTok AI Agent : The First AI Application That Analyzes 10,000+ Vira...
PDF
NewMind AI Monthly Chronicles - July 2025
PDF
Build a system with the filesystem maintained by OSTree @ COSCUP 2025
PPTX
Detection-First SIEM: Rule Types, Dashboards, and Threat-Informed Strategy
PDF
How UI/UX Design Impacts User Retention in Mobile Apps.pdf
PDF
Reach Out and Touch Someone: Haptics and Empathic Computing
PDF
Building Integrated photovoltaic BIPV_UPV.pdf
PPTX
A Presentation on Artificial Intelligence
PDF
Unlocking AI with Model Context Protocol (MCP)
PPTX
Big Data Technologies - Introduction.pptx
PPTX
VMware vSphere Foundation How to Sell Presentation-Ver1.4-2-14-2024.pptx
PDF
Blue Purple Modern Animated Computer Science Presentation.pdf.pdf
Chapter 3 Spatial Domain Image Processing.pdf
Modernizing your data center with Dell and AMD
Spectral efficient network and resource selection model in 5G networks
Architecting across the Boundaries of two Complex Domains - Healthcare & Tech...
The AUB Centre for AI in Media Proposal.docx
7 ChatGPT Prompts to Help You Define Your Ideal Customer Profile.pdf
CIFDAQ's Market Insight: SEC Turns Pro Crypto
Agricultural_Statistics_at_a_Glance_2022_0.pdf
TokAI - TikTok AI Agent : The First AI Application That Analyzes 10,000+ Vira...
NewMind AI Monthly Chronicles - July 2025
Build a system with the filesystem maintained by OSTree @ COSCUP 2025
Detection-First SIEM: Rule Types, Dashboards, and Threat-Informed Strategy
How UI/UX Design Impacts User Retention in Mobile Apps.pdf
Reach Out and Touch Someone: Haptics and Empathic Computing
Building Integrated photovoltaic BIPV_UPV.pdf
A Presentation on Artificial Intelligence
Unlocking AI with Model Context Protocol (MCP)
Big Data Technologies - Introduction.pptx
VMware vSphere Foundation How to Sell Presentation-Ver1.4-2-14-2024.pptx
Blue Purple Modern Animated Computer Science Presentation.pdf.pdf

Anomaly Detection - New York Machine Learning

  • 1. © 2014 MapR Technologies 1 Anomaly Detection How to Find What You Didn’t Know to Look For © MapR Technologies, confidential October 14, 2014
  • 2. © 2014 MapR Technologies 2 Anomaly Detection: How To Find What You Didn’t Know to Look For Ted Dunning, Chief Applications Architect MapR Technologies Email tdunning@mapr.com tdunning@apache.org Twitter @Ted_Dunning Ellen Friedman, Consultant and Commentator Email ellenf@apache.org Twitter @Ellen_Friedman
  • 3. A New Look at Anomaly Detection by Ted Dunning and Ellen Friedman © June 2014 (published by O’Reilly) e-book available courtesy of MapR http://bit.ly/1jQ9QuL © 2014 MapR Technologies 3
  • 4. Practical Machine Learning series (O’Reilly) • Machine learning is becoming mainstream • Need pragmatic approaches that take into account real world business settings: – Time to value – Limited resources – Availability of data – Expertise and cost of team to develop and to maintain system • Look for approaches with big benefits for the effort expended © 2014 MapR Technologies 4
  • 5. © 2014 MapR Technologies 5 Anomaly Detection
  • 6. © 2014 MapR Technologies 6 Who Needs Anomaly Detection? Utility providers using smart meters
  • 7. © 2014 MapR Technologies 7 Who Needs Anomaly Detection? Feedback from manufacturing assembly lines
  • 8. © 2014 MapR Technologies 8 Who Needs Anomaly Detection? Monitoring data traffic on communication networks
  • 9. © 2014 MapR Technologies 9 What is Anomaly Detection? • The goal is to discover rare events – especially those that shouldn’t have happened • Find a problem before other people see it – especially before it causes a problem for customers • Why is this a challenge? – I don’t know what an anomaly looks like (yet)
  • 10. © 2014 MapR Technologies 10 Spot the Anomaly
  • 11. © 2014 MapR Technologies 11 Spot the Anomaly Looks pretty anomalous to me
  • 12. © 2014 MapR Technologies 12 Spot the Anomaly Will the real anomaly please stand up?
  • 13. © 2014 MapR Technologies 13 Basic idea: Find “normal” first
  • 14. © 2014 MapR Technologies 14 Steps in Anomaly Detection • Build a model: Collect and process data for training a model • Use the machine learning model to determine what is the normal pattern • Decide how far away from this normal pattern you’ll consider to be anomalous • Use the AD model to detect anomalies in new data – Methods such as clustering for discovery can be helpful
  • 15. How hard is it to set an alert for anomalies? Grey data is from normal events; x’s are anomalies. Where would you set the threshold? © 2014 MapR Technologies 15
  • 16. © 2014 MapR Technologies 16 Basic idea: Set adaptive thresholds
  • 17. © 2014 MapR Technologies 17 What Are We Really Doing • We want action when something breaks (dies/falls over/otherwise gets in trouble) • But action is expensive • So we don’t want too many false alarms • And we don’t want too many false negatives • What’s the right threshold to set for alerts? – We need to trade off costs
  • 18. © 2014 MapR Technologies 18 A Second Look
  • 19. © 2014 MapR Technologies 19 A Second Look 99.9%-ile
  • 20. New algorithm: t-digest © 2014 MapR Technologies 20
  • 21. © 2014 MapR Technologies 21 How Hard Can it Be? Online Summarizer x > t ? Alarm ! 99.9%-ile t x
  • 22. © 2014 MapR Technologies 22 Detecting Anomalies in Sporadic Events 0.0 0.2 0.4 0.6 0.8 1.0 0 5000 10000 15000 20000 pnorm(centroids[order(centroids)]) counts[order(centroids)]
  • 23. © 2014 MapR Technologies 23 Using t-Digest • Apache Mahout uses t-digest as an on-line percentile estimator – very high accuracy for extreme tails – new in version Mahout v 0.9 • t-digest also available elsewhere – in streamlib (open source library on github) – standalone (github and Maven Central) • What’s the big deal with anomaly detection? • This looks like a solved problem
  • 24. © 2014 MapR Technologies 24 Already Done? Etsy Skyline?
  • 25. © 2014 MapR Technologies 25 What About This? 0 5 10 15 offset + noise + pulse1 + pulse2 −2 0 2 4 6 8 10 A B
  • 26. © 2014 MapR Technologies 26 Model Delta Anomaly Detection + δ Online Summarizer δ > t ? t 99.9%-ile Alarm ! Model -
  • 27. The Real Inside Scoop • The model-delta anomaly detector is really just a sum of random © 2014 MapR Technologies 27 variables – the model we know about already – and a normally distributed error • The output (delta) is (roughly) the log probability of the sum distribution (really δ2) • Thinking about probability distributions is good • But how do you handle AD in systems with sporadic events?
  • 28. © 2014 MapR Technologies 28 Spot the Anomaly Anomaly?
  • 29. © 2014 MapR Technologies 29 Maybe not!
  • 30. © 2014 MapR Technologies 30 Where’s Waldo? This is the real anomaly
  • 31. © 2014 MapR Technologies 31 Normal Isn’t Just Normal • What we want is a model of what is normal • What doesn’t fit the model is the anomaly • For simple signals, the model can be simple … x ~ N(0,e ) • The real world is rarely so accommodating
  • 32. © 2014 MapR Technologies 32 We Do Windows
  • 33. © 2014 MapR Technologies 33 We Do Windows
  • 34. © 2014 MapR Technologies 34 We Do Windows
  • 35. © 2014 MapR Technologies 35 We Do Windows
  • 36. © 2014 MapR Technologies 36 We Do Windows
  • 37. © 2014 MapR Technologies 37 We Do Windows
  • 38. © 2014 MapR Technologies 38 We Do Windows
  • 39. © 2014 MapR Technologies 39 We Do Windows
  • 40. © 2014 MapR Technologies 40 We Do Windows
  • 41. © 2014 MapR Technologies 41 We Do Windows
  • 42. © 2014 MapR Technologies 42 We Do Windows
  • 43. © 2014 MapR Technologies 43 We Do Windows
  • 44. © 2014 MapR Technologies 44 We Do Windows
  • 45. © 2014 MapR Technologies 45 We Do Windows
  • 46. © 2014 MapR Technologies 46 We Do Windows
  • 47. © 2014 MapR Technologies 47 Windows on the World • The set of windowed signals is a nice model of our original signal • Clustering can find the prototypes – Fancier techniques available using sparse coding • The result is a dictionary of shapes • New signals can be encoded by shifting, scaling and adding shapes from the dictionary
  • 48. © 2014 MapR Technologies 48 Most Common Shapes (for EKG)
  • 49. < 1 bit / sample © 2014 MapR Technologies 49 Reconstructed signal Original signal Reconstructed signal Reconstruction error
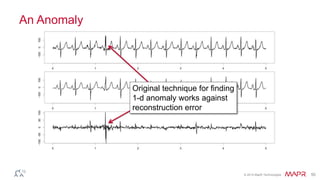
  • 50. © 2014 MapR Technologies 50 An Anomaly Original technique for finding 1-d anomaly works against reconstruction error
  • 51. © 2014 MapR Technologies 51 Close-up of anomaly Not what you want your heart to do. And not what the model expects it to do.
  • 52. © 2014 MapR Technologies 52 A Different Kind of Anomaly
  • 53. © 2014 MapR Technologies 53 Model Delta Anomaly Detection + δ Online Summarizer δ > t ? t 99.9%-ile Alarm ! Model -
  • 54. © 2014 MapR Technologies 54 The Real Inside Scoop • The model-delta anomaly detector is really just a sum of random variables – the model we know about already – and a normally distributed error • The output (delta) is (roughly) the log probability of the sum distribution (really δ2) • Thinking about probability distributions is good
  • 55. Anomalies among sporadic events © 2014 MapR Technologies 55
  • 56. Sporadic Web Traffic to an e-Business Site © 2014 MapR Technologies 56 It’s important to know if traffic is stopped or delayed because of a problem… But visits to site normally come at varying intervals. How long after the last event should you begin to worry?
  • 57. Sporadic Web Traffic to an e-Business Site © 2014 MapR Technologies 57 It’s important to know if traffic is stopped or delayed because of a problem… But visits to site normally come at varying intervals. And how do you let your CEO sleep through the night?
  • 58. © 2014 MapR Technologies 58 Basic idea: Time interval between events is how to convert to something useful you can measure
  • 59. Sporadic Events: Finding Normal and Anomalous Patterns • Time between intervals is much more usable than absolute times © 2014 MapR Technologies 59 • Counts don’t link as directly to probability models • Time interval is log ρ • This is a big deal
  • 60. © 2014 MapR Technologies 60 Event Stream (timing) • Events of various types arrive at irregular intervals – we can assume Poisson distribution • The key question is whether frequency has changed relative to expected values – This shows up as a change in interval • Want alert as soon as possible
  • 61. © 2014 MapR Technologies 61 Converting Event Times to Anomaly 99.9%-ile 99.99%-ile
  • 62. But in the real world, event © 2014 MapR Technologies 62 rates often change
  • 63. Time Intervals Are Key to Modeling Sporadic Events © 2014 MapR Technologies 63
  • 64. © 2014 MapR Technologies 64 Model-Scaled Intervals Solve the Problem
  • 65. © 2014 MapR Technologies 65 Model Delta Anomaly Detection + δ Online Summarizer δ > t ? t 99.9%-ile Alarm ! Model - log p
  • 66. © 2014 MapR Technologies 66 Detecting Anomalies in Sporadic Events Incoming events 99.97%-ile Alarm Δn Rate predictor Rate history t-digest δ> t t i δ λ(t i - t i - n) λ t
  • 67. © 2014 MapR Technologies 67 Detecting Anomalies in Sporadic Events Incoming events 99.97%-ile Alarm Δn Rate predictor Rate history t-digest δ> t t i δ λ(t i - t i - n) λ t
  • 68. © 2014 MapR Technologies 68 Slipped Week: Simple Rate Predictor Nov 02 Nov 07 Nov 12 Nov 17 Nov 22 Nov 27 Dec 02 0 100 200 300 400 500 Main Page Traffic Date Hits (x 1000) A B C D
  • 69. © 2014 MapR Technologies 69 Poisson Distribution • Time between events is exponentially distributed Dt ~ le-lt • This means that long delays are exponentially rare P(Dt > T) = e-lT -logP(Dt > T) = lT • If we know λ we can select a good threshold – or we can pick a threshold empirically
  • 70. © 2014 MapR Technologies 70 Seasonality Poses a Challenge Nov 17 Nov 27 Dec 07 Dec 17 Dec 27 0 2 4 6 8 Christmas Traffic Date Hits / 1000
  • 71. © 2014 MapR Technologies 71 Something more is needed … Nov 17 Nov 27 Dec 07 Dec 17 Dec 27 0 2 4 6 8 Christmas Traffic Date Hits / 1000
  • 72. © 2014 MapR Technologies 72 We need a better rate predictor… Incoming events 99.97%-ile Alarm Δn Rate predictor Rate history t-digest δ> t t i δ λ(t i - t i - n) λ t
  • 73. © 2014 MapR Technologies 73 A New Rate Predictor for Sporadic Events
  • 74. Improved Prediction with Adaptive Modeling © 2014 MapR Technologies 74 Dec 17 Dec 19 Dec 21 Dec 23 Dec 25 Dec 27 Dec 29 0 2 4 6 8 Christmas Prediction Date Hits (x 1000)
  • 75. Anomaly Detection + Classification  Useful Pair © 2014 MapR Technologies 75 • Use the AD model to detect anomalies in new data – Methods such as clustering for discovery can be helpful • Once you have well-defined models in your system, you may also want to use classification to tag those • Continue to use the AD model to find new anomalies
  • 76. © 2014 MapR Technologies 76 Recap (out of order) • Anomaly detection is best done with a probability model • -log p is a good way to convert to anomaly measure • Adaptive quantile estimation (t-digest) works for auto-setting thresholds
  • 77. © 2014 MapR Technologies 77 Recap • Different systems require different models • Continuous time-series – sparse coding to build signal model • Events in time – rate model base on variable rate Poisson – segregated rate model • Events with labels – language modeling – hidden Markov models
  • 78. © 2014 MapR Technologies 78 Why Use Anomaly Detection?
  • 79. © 2014 MapR Technologies 79 Keep in mind… • Model normal, then find anomalies - • t-digest for adaptive threshold • Probabilistic models for complex patterns 0 5 10 15 −2 0 2 4 6 8 10 offset + noise + pulse1 + pulse2 A B
  • 80. Dec 17 Dec 19 Dec 21 Dec 23 Dec 25 Dec 27 Dec 29 © 2014 MapR Technologies 80 0 2 4 6 8 Christmas Prediction Date Hits (x 1000) Keep in mind… • Time intervals are key for sporadic events • Complex time shift to predict rate with seasonality • Sequence of events reveals phishing attack
  • 81. A New Look at Anomaly Detection by Ted Dunning and Ellen Friedman © June 2014 (published by O’Reilly) e-book available courtesy of MapR http://bit.ly/1jQ9QuL © 2014 MapR Technologies 81
  • 82. Coming in October: Time Series Databases by Ted Dunning and Ellen Friedman © Oct 2014 (published by O’Reilly) © 2014 MapR Technologies 82
  • 83. Thank you for coming today! © 2014 MapR Technologies 83
  • 84. © 2014 MapR Technologies 85 © MapR Technologies, confidential
  • 85. © 2014 MapR Technologies 86 Sandbox

Editor's Notes

  • #4: Talk track: 2nd in series, first was on how to build a simple recommender. This one on anomaly detection is being sold by O’Reilly on Amazon, but for a limited time MapR is giving away the e-book for free. Here’s the link where you can register to get one.
  • #5: Talk track: ELLEN New ways to do it that take into account real world business goals, realistic resources, new types of data and best time to value…
  • #7: Talk track: mistakes affect huge numbers of people….
  • #8: Talk track: … even more so on auto mated assembly line
  • #11: STILL ELLEN
  • #13: Talk track: Say “Build a model”
  • #15: Talk track: Say “Build a model; model what is normal. Then determine what is not…
  • #16: ELLEN/TRANSITION SLIDE
  • #18: TED
  • #24: Ellen talking point: Ted authored it and contributed to open-source; others are now contributing adjustments, used in several places
  • #26: Talk track: Now where do you put the threshold? Adaptive model is the solution…
  • #27: Ellen: Talk track: We talk about this in the book with the EKG example where the normal pattern is fairly regular but very complex shape..
  • #28: Ellen comment for transition: Talk track: How handle that and in what situations does that matter?
  • #57: ELLEN: set up
  • #58: TO TED/ CEO story
  • #62: Talk track: This is what it looks like to have events such as those on website that come in at randomized times (people come when they want to) but the underlying average rate in this case is constant, in other words, a fairly steady stream of traffic. This looks at lot like the first signal we talked about: a randomized but even signal… We can use t-digest on it to set thresholds, everything works just grand. (Like radio activity Geiger counter clicks)
  • #64: Talk track: (Describe figure) Horizontal axis is days, with noon in the middle of each day. The faint shadow shows the underlying rate of events.The vertical axis is the time interval between events. Notice that as the rate of events is high, the time interval between events is small, but when the rate of events slows down, the time between events is much larger. Ellen: For this reason, we cannot set a simple threshold: if set low in day, we have an alert every night even though we expect a longer interval then. If we set it too high, we miss the real problems when traffic really is abnormally delayed or stopped altogether. What can you do to solve this? Ted: We build a model, multiple the modelled rate x the interval, we get a number we can threshold accurately.
  • #65: Talk track: (Description of graph) Shadow
  • #67: Ted: this was figure 5-2 in the book
  • #68: Talk track: You need a rate predictor Ellen: sometimes simple is good enough
  • #69: Ted: This was figure 5.3
  • #70: Talk track: This slide is here for reference when you download the slides
  • #71: Ted: This was figure 5.4
  • #72: Ted: This was figure 5.4
  • #73: Ted: this was figure 5-2 in the book
  • #74: We can look at yesterday and day before but need to look at the shape from previous days … but look at today for whether traffic is scaling
  • #75: Ted: This was figure 5.4