Beyond the Elements:
XRD Mineralogy & XRF Analysis
for Advanced Mud Logging
Agenda
Meet the Speakers
 Jose Brum, Field Sales Engineer, Olympus
 Dawn Snyder, Geologist, Diversified Well Logging
Topics
 XRF & XRD Basics
 X-ray technology in oil & gas drilling
 Advanced mud logging techniques
 On-site XRF and XRD
 Q&A Session
Save Time
 Easy sample prep
 On-site analysis
 Fast results
Reduce Costs
 Send fewer samples to outside lab
 Avoid downtime waiting for results
 Prevent re-drilling with real-time data
Be Decisive
 Continuously test while drilling
 Geosteering without guesswork
 View drill depth vs mineralogy comparison plots
Benefits of on-site XRD & XRF analysis
What is X-ray fluorescence?
 Quantitative elemental analysis Mg - U
 Measures ppm - % for most elements
What is X-ray fluorescence?
Typical XRF Spectra
Beyond the Elements XRD Mineralogy & XRF Analysis for Advanced Mud Logging
What is X-ray diffraction?
 Direct mineralogy with XRD
 Quantitative mineral phase analysis
 Rough range of analysis is ~ 2% - 100%
What is X-ray diffraction?
Typical XRD Patterns
Quartz
Dolomite
Gypsum
Illite
2650 ft
6250 ft
XRD vs XRF?
 Both use an X-ray source and detector
 Both measure the response to X-rays interacting
with a substance
 Both provide a measurement to help identify a
substance
XRF XRD
Elemental Analysis Compound Analysis
Contains Fe Contains Fe2O3 vs Fe3O4
Contains Ca Polymorphs: CaCO3
calcite vs aragonite vs vaterite
Unconventional resources
CHALLENGE: Majority of wells
being drilled in N.A. are in
unconventional resource plays
SOLUTION: Advancements in
horizontal drilling and hydraulic
fracturing have made production
from unconventional resources
commercially viable
Finding the sweet spot
CHALLENGE: Geology,
geochemistry, geo-mechanical
properties can vary significantly
throughout the play within visually
homogenous shales
SOLUTION: XRD & XRF shows
molecular level to identify areas with
more carbonates, areas that are
more siliceous, and places of
changes in the clay
Monitoring mineralogy trends with XRD
Brittle zones
CHALLENGE: Brittle zones necessary to pinpoint
sweet spots for fracking can appear and disappear
quickly in horizontal sections
SOLUTION: XRD data can be used to derive the
brittleness of the shales within reservoirs
Rock type
CHALLENGE: Need to identify oil & gas bearing
zones, permeability and porosity for optimum
production
SOLUTION: XRD can identify the rock types that
indicate oil & gas bearing zones
Marker elements
CHALLENGE: Finding boundary
layers and staying in the pay zone
while drilling
SOLUTION: XRF can identify upper
and lower marker elements to
indicate when you have entered the
pay zone or if you have left it
Monitoring elemental composition
with XRF
Elemental composition vs drilling depths
Downhole vs surface
techniques
CHALLENGES: Downhole
measurements such as gamma,
resistivity or wireline tools can fail due
to temperature, pressure or vibration
in the wellbore
SOLUTION: Surface-based data
from XRD and XRF have little to no
impact on the drilling operations and
can provide the mineralogy data
regardless of downhole conditions
Compatible Fluids
CHALLENGE: Drilling and injection fluids can interact
with the formation in undesirable ways
SOLUTION: XRD can analyze the mineralogy so the
compatible fluid can be used
Scaling
CHALLENGE:
Scaling can block
wells and reduce
permeability of the
formation
SOLUTION:
XRD can identify the type of scaling so you
can choose the right treatment chemicals
Common oilfield scales
Optimizing Production
CHALLENGE: Typical well has between 25-50
stages, costing close to $250k per stage, with a
typical production rate of 2%
SOLUTION: Placing stages in the most brittle areas
of the formation will help to optimize production,
reduce cost and minimize environmental impact of
fracturing
Advanced Mudlogging
CHALLENGE: Surface-based
measurements need to
provide a detailed and reliable
view of what is happening sub-
surface
SOLUTION: Field XRD and
XRF combined with the mud
logger and the microscope
provides detailed results using
visual and analytical
techniques
Advanced Mudlogging
CHALLENGE: Problems
such as wellbore stability
and fluid losses can arise
while drilling
SOLUTION: If pilot well
cuttings were logged,
subsequent cavings can be
immediately identified with
on-site XRD and XRF to
pinpoint the location of
losses.
Used with permission from Aaron Watkins
Advanced Mudlogging
XRD Data - Pattern Comparison
Waterfall plot of 13 samples showing change in mineralogy
through depth of several thousand feet of drilling with
intensities normalized to 100% for visualization
Range = Red at 2350 – Blue at 6250
XRD Data - Pattern Comparison
Comparisons show visual changes in the
diffraction pattern that do not require technical
training to notice
XRD Data - Pattern Comparison
Quartz
Dolomite
Gypsum
Illite
2650 ft
6250 ft
XRD Data - Pattern Comparison
3400 ft
3870 ft
Illite
Illite
Chlorite
XRD Data - Analysis Speed
secondary peaks clear
1 min / 4 exposures
3 min / 11 exposures
10 min / 36 exposures
For identifiable peaks,
quantification stabilizes
very quickly
secondary peaks visible
primary peaks visible - likely identifiable
XRD Quantification
 Quick Semi-Quant (XPowder) can be set-up with a few
patterns and turned into a push-button operation
 Select phases visually from a small database
 Setting up reference files for future quantification of similar
matrices
Field XRD vs lab XRD
XRF Analysis Output
Depth Al Si P S K Ca Ti V Mn Fe Ni Cu Zn Zr
12430 4.04 13.7 0.17 0.24 2.31 2.05 0.44 0 0.03 5.11 0.02
12450 2.82 13.3 0.14 0.29 1.33 3.27 0.34 0.04 0.03 4.39 0.01 0.03
12470 3.31 14.2 0.2 0.33 1.38 3.34 0.35 0.04 4.53 0.03
12490 3.53 12.1 0.2 0.74 1.57 4.29 1.78 1.03 0.22 5.15 0.01 0.01 0.03
12510 3.39 11.8 0.17 0.5 1.64 4.37 1.03 0.6 0.12 4.8 0.03
12530 3.77 11.2 0.26 0.38 1.36 7.95 1.28 0.75 0.18 4.45 0.02 0.02
12550 3.44 10.9 0.15 0.41 1.46 7.3 1.21 0.55 0.14 4.28 0.03
12570 2.77 9.38 0.18 0.26 1.27 8.26 0.75 0.26 0.08 3.87 0.01 0.03
12590 3.11 10.5 0.17 0.62 1.42 6.16 1.88 1.19 0.34 4.78 0.02 0.01 0.03
12610 3.07 9.91 0.15 0.26 1.34 7.82 0.58 0.17 0.09 3.82 0.01 0.01 0.02
12630 3.19 10.7 0.17 0.33 1.59 5.29 0.5 0.11 0.08 4.52 0.01 0.03
On-site XRD & XRF Analysis
CHALLENGE: Samples sent to lab
for XRD & XRF analysis can take
days/wks for results
SOLUTION: Advances in XRD &
XRF units have made them
accessible for use in mobile labs
Inside the Diversified
Well Logging Trailer
Your Mobile Lab Starts with Olympus
X5000
Portable XRF
BTX-II
Benchtop XRD
TERRA
Portable XRD
Submit your questions now!

More Related Content

PPTX
Mud logging, XRD and XRF techniques
PPTX
Particle Technology- Fluid Flow in Porous Media
PPTX
Diamond drill bits
PDF
Petroleum Exploration Overview
PPTX
Non damaging drilling fluids for oil and gas
PDF
MDT__1654157311.pdf
PDF
8 bit selection
Mud logging, XRD and XRF techniques
Particle Technology- Fluid Flow in Porous Media
Diamond drill bits
Petroleum Exploration Overview
Non damaging drilling fluids for oil and gas
MDT__1654157311.pdf
8 bit selection

What's hot (20)

PPTX
Magnetic-separation.333
PPTX
Log acquisition and processing
DOCX
To estimate aluminium by back titration using zinc sulphate
PPTX
Drilling
PPT
Slide Dot Com
PPTX
Measurement While Drilling (MWD)
PDF
Logging cased hole
PPT
Hydraulics
PPT
Ball mill
PDF
(Mud Filtration)
PPT
Drilling fluids
PPT
Directional drilling
PDF
Logging While Drilling.pdf
PDF
Mud balance test (drilling fluid lab test)
PPSX
Analisi Idrocarburi nel suolo - GC-FID + HS
PPTX
Porosity Calculation Using Techlog Softwares
PPTX
Leaching
PPT
Topic 3: Ore processing and metal recovery
PPT
Gas Membrane Presentation
PPTX
Horizontal drilling
Magnetic-separation.333
Log acquisition and processing
To estimate aluminium by back titration using zinc sulphate
Drilling
Slide Dot Com
Measurement While Drilling (MWD)
Logging cased hole
Hydraulics
Ball mill
(Mud Filtration)
Drilling fluids
Directional drilling
Logging While Drilling.pdf
Mud balance test (drilling fluid lab test)
Analisi Idrocarburi nel suolo - GC-FID + HS
Porosity Calculation Using Techlog Softwares
Leaching
Topic 3: Ore processing and metal recovery
Gas Membrane Presentation
Horizontal drilling
Ad

Viewers also liked (20)

PPT
XRF & XRD Analysis Principle
PPSX
Nonequivalent lanthanide defects: energy level modeling
PPTX
DSSC, Silver Nano-particles DSSC and D-SOBATT, IDM7
PDF
2010 285
PPTX
Presentation Lumiglass
PPTX
Improve1_MyFinalPresentation
PPTX
RAJ ICDIM2016 talk
PPTX
Vibrational Spectrroscopy
PPT
Solution combustion method for syntheis of nano particles
PPTX
Xrd nanomaterials course_s2015_bates
PDF
Spectroscopy XRD
PPTX
SPINELS,INVERSE SPINELS AND PEROVSKITES
PPT
Solid State
PPTX
Synthesis of Nano Materials
PPT
Past Simple 1
PPTX
Farrites of fabrick
PPTX
Preparation of Nanoparticles
PPTX
x-ray-diffraction-technique
XRF & XRD Analysis Principle
Nonequivalent lanthanide defects: energy level modeling
DSSC, Silver Nano-particles DSSC and D-SOBATT, IDM7
2010 285
Presentation Lumiglass
Improve1_MyFinalPresentation
RAJ ICDIM2016 talk
Vibrational Spectrroscopy
Solution combustion method for syntheis of nano particles
Xrd nanomaterials course_s2015_bates
Spectroscopy XRD
SPINELS,INVERSE SPINELS AND PEROVSKITES
Solid State
Synthesis of Nano Materials
Past Simple 1
Farrites of fabrick
Preparation of Nanoparticles
x-ray-diffraction-technique
Ad

Similar to Beyond the Elements XRD Mineralogy & XRF Analysis for Advanced Mud Logging (20)

PDF
Techniques for Rapid and Accurate Sample Analysis in the Field
PPTX
XRD And XRF2.pptx
PDF
XRF interlaboratory comparision.pdf
PPTX
General Instrument presentation 2
PDF
The role of robotic innovation in ore characterization, mineralogy and geomet...
PPT
X-Ray Analysis of Ceramics
PDF
PPTX
Xrf & it's types
PDF
Energy-dispersive x-ray diffraction for on-stream monitoring of m
PPTX
XRF ( x-ray fluorescence )
PPTX
X ray crystallography
PPTX
Advanced material characterization technique
PPTX
XRF (X-ray fluorescence) By Hossein bandori
PPTX
X ray crystallography
PPTX
Qualification of Phillips X’pert MPD Diffractometer for XRD
PPTX
X ray diffraction.pptx
PPTX
9. XRF (X-ray Fluorescence).pptx
PPTX
X-Ray Fluorescence Method and Operation.pptx
PDF
X ray diffraction
PPTX
X-RAY FLUORESECENCE
Techniques for Rapid and Accurate Sample Analysis in the Field
XRD And XRF2.pptx
XRF interlaboratory comparision.pdf
General Instrument presentation 2
The role of robotic innovation in ore characterization, mineralogy and geomet...
X-Ray Analysis of Ceramics
Xrf & it's types
Energy-dispersive x-ray diffraction for on-stream monitoring of m
XRF ( x-ray fluorescence )
X ray crystallography
Advanced material characterization technique
XRF (X-ray fluorescence) By Hossein bandori
X ray crystallography
Qualification of Phillips X’pert MPD Diffractometer for XRD
X ray diffraction.pptx
9. XRF (X-ray Fluorescence).pptx
X-Ray Fluorescence Method and Operation.pptx
X ray diffraction
X-RAY FLUORESECENCE

More from Olympus IMS (20)

PDF
Benefits of 3D Visualization for High-Resolution Video Measurement
PDF
Case Studies—Innovative Use of pXRF in Southern and Eastern Europe
PDF
Vanta Handheld XRF for Car Catalyst Analysis
PPTX
Utilizing Handheld X-Ray Fluorescence for In-Process Steel Slag Monitoring
PPTX
Cloud-Based Process Management of Inspection Instruments
PDF
Why You Need to Double Check Your Oil Analysis
PDF
Breakthrough Technology for Cobalt Analysis Using pXRF
PDF
Advances in Phased Array Inspection of API 620 LNG Tanks
PDF
Tool Wear Detection and Quantitation by Digital Microscopy
PDF
Nontraditional Applications of XRF for Quality Assurance and Quality Control
PDF
Fluorescent Dye Penetrant Inspections Using Videoscopes
PDF
Identifying Precious Metal Alloys on Your Bench and In Your Case
PDF
See the Invisible with Ultraviolet (UV) Inspection
PDF
Coating Thickness Test with Portable XRF
PDF
Increasing the Brightness of Remote Visual Inspection (RVI) Instruments
PDF
Improving the Efficiency of Wind Turbine Inspections
PDF
In-Service Corrosion Mapping—Challenges for the Chemical Industry
PDF
Improved Inspection of Composite Wind Turbine Blades with Accessible, Advanc...
PDF
Coherent Adaptive Focusing Technology for the Inspection of Complex Geometry
PDF
Phased Array Scan Planning and Modeling for Weld inspection
Benefits of 3D Visualization for High-Resolution Video Measurement
Case Studies—Innovative Use of pXRF in Southern and Eastern Europe
Vanta Handheld XRF for Car Catalyst Analysis
Utilizing Handheld X-Ray Fluorescence for In-Process Steel Slag Monitoring
Cloud-Based Process Management of Inspection Instruments
Why You Need to Double Check Your Oil Analysis
Breakthrough Technology for Cobalt Analysis Using pXRF
Advances in Phased Array Inspection of API 620 LNG Tanks
Tool Wear Detection and Quantitation by Digital Microscopy
Nontraditional Applications of XRF for Quality Assurance and Quality Control
Fluorescent Dye Penetrant Inspections Using Videoscopes
Identifying Precious Metal Alloys on Your Bench and In Your Case
See the Invisible with Ultraviolet (UV) Inspection
Coating Thickness Test with Portable XRF
Increasing the Brightness of Remote Visual Inspection (RVI) Instruments
Improving the Efficiency of Wind Turbine Inspections
In-Service Corrosion Mapping—Challenges for the Chemical Industry
Improved Inspection of Composite Wind Turbine Blades with Accessible, Advanc...
Coherent Adaptive Focusing Technology for the Inspection of Complex Geometry
Phased Array Scan Planning and Modeling for Weld inspection

Recently uploaded (20)

PPTX
Configure Apache Mutual Authentication
PDF
Flame analysis and combustion estimation using large language and vision assi...
PPTX
2018-HIPAA-Renewal-Training for executives
PDF
NewMind AI Weekly Chronicles – August ’25 Week III
PDF
Credit Without Borders: AI and Financial Inclusion in Bangladesh
PPTX
MicrosoftCybserSecurityReferenceArchitecture-April-2025.pptx
PDF
A review of recent deep learning applications in wood surface defect identifi...
PPT
Galois Field Theory of Risk: A Perspective, Protocol, and Mathematical Backgr...
PDF
Getting started with AI Agents and Multi-Agent Systems
PDF
Architecture types and enterprise applications.pdf
PPTX
Benefits of Physical activity for teenagers.pptx
PPTX
Modernising the Digital Integration Hub
PPTX
Build Your First AI Agent with UiPath.pptx
PPTX
Microsoft Excel 365/2024 Beginner's training
PPTX
GROUP4NURSINGINFORMATICSREPORT-2 PRESENTATION
PDF
sbt 2.0: go big (Scala Days 2025 edition)
PDF
sustainability-14-14877-v2.pddhzftheheeeee
PDF
UiPath Agentic Automation session 1: RPA to Agents
PDF
Comparative analysis of machine learning models for fake news detection in so...
PDF
Convolutional neural network based encoder-decoder for efficient real-time ob...
Configure Apache Mutual Authentication
Flame analysis and combustion estimation using large language and vision assi...
2018-HIPAA-Renewal-Training for executives
NewMind AI Weekly Chronicles – August ’25 Week III
Credit Without Borders: AI and Financial Inclusion in Bangladesh
MicrosoftCybserSecurityReferenceArchitecture-April-2025.pptx
A review of recent deep learning applications in wood surface defect identifi...
Galois Field Theory of Risk: A Perspective, Protocol, and Mathematical Backgr...
Getting started with AI Agents and Multi-Agent Systems
Architecture types and enterprise applications.pdf
Benefits of Physical activity for teenagers.pptx
Modernising the Digital Integration Hub
Build Your First AI Agent with UiPath.pptx
Microsoft Excel 365/2024 Beginner's training
GROUP4NURSINGINFORMATICSREPORT-2 PRESENTATION
sbt 2.0: go big (Scala Days 2025 edition)
sustainability-14-14877-v2.pddhzftheheeeee
UiPath Agentic Automation session 1: RPA to Agents
Comparative analysis of machine learning models for fake news detection in so...
Convolutional neural network based encoder-decoder for efficient real-time ob...

Beyond the Elements XRD Mineralogy & XRF Analysis for Advanced Mud Logging

  • 1. Beyond the Elements: XRD Mineralogy & XRF Analysis for Advanced Mud Logging
  • 2. Agenda Meet the Speakers  Jose Brum, Field Sales Engineer, Olympus  Dawn Snyder, Geologist, Diversified Well Logging Topics  XRF & XRD Basics  X-ray technology in oil & gas drilling  Advanced mud logging techniques  On-site XRF and XRD  Q&A Session
  • 3. Save Time  Easy sample prep  On-site analysis  Fast results Reduce Costs  Send fewer samples to outside lab  Avoid downtime waiting for results  Prevent re-drilling with real-time data Be Decisive  Continuously test while drilling  Geosteering without guesswork  View drill depth vs mineralogy comparison plots Benefits of on-site XRD & XRF analysis
  • 4. What is X-ray fluorescence?  Quantitative elemental analysis Mg - U  Measures ppm - % for most elements
  • 5. What is X-ray fluorescence? Typical XRF Spectra
  • 7. What is X-ray diffraction?  Direct mineralogy with XRD  Quantitative mineral phase analysis  Rough range of analysis is ~ 2% - 100%
  • 8. What is X-ray diffraction? Typical XRD Patterns Quartz Dolomite Gypsum Illite 2650 ft 6250 ft
  • 9. XRD vs XRF?  Both use an X-ray source and detector  Both measure the response to X-rays interacting with a substance  Both provide a measurement to help identify a substance XRF XRD Elemental Analysis Compound Analysis Contains Fe Contains Fe2O3 vs Fe3O4 Contains Ca Polymorphs: CaCO3 calcite vs aragonite vs vaterite
  • 10. Unconventional resources CHALLENGE: Majority of wells being drilled in N.A. are in unconventional resource plays SOLUTION: Advancements in horizontal drilling and hydraulic fracturing have made production from unconventional resources commercially viable
  • 11. Finding the sweet spot CHALLENGE: Geology, geochemistry, geo-mechanical properties can vary significantly throughout the play within visually homogenous shales SOLUTION: XRD & XRF shows molecular level to identify areas with more carbonates, areas that are more siliceous, and places of changes in the clay
  • 14. Brittle zones CHALLENGE: Brittle zones necessary to pinpoint sweet spots for fracking can appear and disappear quickly in horizontal sections SOLUTION: XRD data can be used to derive the brittleness of the shales within reservoirs
  • 15. Rock type CHALLENGE: Need to identify oil & gas bearing zones, permeability and porosity for optimum production SOLUTION: XRD can identify the rock types that indicate oil & gas bearing zones
  • 16. Marker elements CHALLENGE: Finding boundary layers and staying in the pay zone while drilling SOLUTION: XRF can identify upper and lower marker elements to indicate when you have entered the pay zone or if you have left it
  • 18. Elemental composition vs drilling depths
  • 19. Downhole vs surface techniques CHALLENGES: Downhole measurements such as gamma, resistivity or wireline tools can fail due to temperature, pressure or vibration in the wellbore SOLUTION: Surface-based data from XRD and XRF have little to no impact on the drilling operations and can provide the mineralogy data regardless of downhole conditions
  • 20. Compatible Fluids CHALLENGE: Drilling and injection fluids can interact with the formation in undesirable ways SOLUTION: XRD can analyze the mineralogy so the compatible fluid can be used
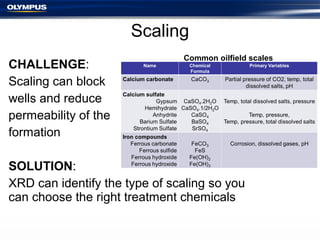
  • 21. Scaling CHALLENGE: Scaling can block wells and reduce permeability of the formation SOLUTION: XRD can identify the type of scaling so you can choose the right treatment chemicals Common oilfield scales
  • 22. Optimizing Production CHALLENGE: Typical well has between 25-50 stages, costing close to $250k per stage, with a typical production rate of 2% SOLUTION: Placing stages in the most brittle areas of the formation will help to optimize production, reduce cost and minimize environmental impact of fracturing
  • 23. Advanced Mudlogging CHALLENGE: Surface-based measurements need to provide a detailed and reliable view of what is happening sub- surface SOLUTION: Field XRD and XRF combined with the mud logger and the microscope provides detailed results using visual and analytical techniques
  • 24. Advanced Mudlogging CHALLENGE: Problems such as wellbore stability and fluid losses can arise while drilling SOLUTION: If pilot well cuttings were logged, subsequent cavings can be immediately identified with on-site XRD and XRF to pinpoint the location of losses. Used with permission from Aaron Watkins
  • 26. XRD Data - Pattern Comparison Waterfall plot of 13 samples showing change in mineralogy through depth of several thousand feet of drilling with intensities normalized to 100% for visualization Range = Red at 2350 – Blue at 6250
  • 27. XRD Data - Pattern Comparison Comparisons show visual changes in the diffraction pattern that do not require technical training to notice
  • 28. XRD Data - Pattern Comparison Quartz Dolomite Gypsum Illite 2650 ft 6250 ft
  • 29. XRD Data - Pattern Comparison 3400 ft 3870 ft Illite Illite Chlorite
  • 30. XRD Data - Analysis Speed secondary peaks clear 1 min / 4 exposures 3 min / 11 exposures 10 min / 36 exposures For identifiable peaks, quantification stabilizes very quickly secondary peaks visible primary peaks visible - likely identifiable
  • 31. XRD Quantification  Quick Semi-Quant (XPowder) can be set-up with a few patterns and turned into a push-button operation  Select phases visually from a small database  Setting up reference files for future quantification of similar matrices
  • 32. Field XRD vs lab XRD
  • 33. XRF Analysis Output Depth Al Si P S K Ca Ti V Mn Fe Ni Cu Zn Zr 12430 4.04 13.7 0.17 0.24 2.31 2.05 0.44 0 0.03 5.11 0.02 12450 2.82 13.3 0.14 0.29 1.33 3.27 0.34 0.04 0.03 4.39 0.01 0.03 12470 3.31 14.2 0.2 0.33 1.38 3.34 0.35 0.04 4.53 0.03 12490 3.53 12.1 0.2 0.74 1.57 4.29 1.78 1.03 0.22 5.15 0.01 0.01 0.03 12510 3.39 11.8 0.17 0.5 1.64 4.37 1.03 0.6 0.12 4.8 0.03 12530 3.77 11.2 0.26 0.38 1.36 7.95 1.28 0.75 0.18 4.45 0.02 0.02 12550 3.44 10.9 0.15 0.41 1.46 7.3 1.21 0.55 0.14 4.28 0.03 12570 2.77 9.38 0.18 0.26 1.27 8.26 0.75 0.26 0.08 3.87 0.01 0.03 12590 3.11 10.5 0.17 0.62 1.42 6.16 1.88 1.19 0.34 4.78 0.02 0.01 0.03 12610 3.07 9.91 0.15 0.26 1.34 7.82 0.58 0.17 0.09 3.82 0.01 0.01 0.02 12630 3.19 10.7 0.17 0.33 1.59 5.29 0.5 0.11 0.08 4.52 0.01 0.03
  • 34. On-site XRD & XRF Analysis CHALLENGE: Samples sent to lab for XRD & XRF analysis can take days/wks for results SOLUTION: Advances in XRD & XRF units have made them accessible for use in mobile labs Inside the Diversified Well Logging Trailer
  • 35. Your Mobile Lab Starts with Olympus X5000 Portable XRF BTX-II Benchtop XRD TERRA Portable XRD Submit your questions now!

Editor's Notes

  • #4: Thank you Gregg. I’m glad to have the opportunity to be here today with Dawn to talk to all of you about the use of field XRD and XRF in mud logging applications. The development of field-based XRD and XRF instrumentation has really expanded the use of these technologies in this industry as an on-site tool. It has had a huge affect on - the time it takes to get analysis - the cost of sending samples back to a main lab and - the ability to make decisions in real-time Dawn will be talking more specifically about how the mud logger uses these technologies but first I want to start at the basics of XRD and XRF technology, how they are similar and how they differ
  • #9: Other techniques calculate or infer what the mineralogy is but XRD identifies and quantifies the mineralogy directly from the crystal structure.
  • #11: The majority of wells being drilled in N.A. are primarily shales in unconventional resource plays – tight formations that trap the hydrocarbons and require stimulation techniques to allow them to flow.
  • #12: Using these X-rays, we can now see vivid differences in visually homogenous shales. With clarity, you can see and quantitate the areas of the well that have more carbonates, are more siliceous, and changes in the clay.
  • #15: Brittleness is directly controlled by mineralogy and the fabric and texture of the mineral components Accurate measurements of clay content are imperative to evaluating the relative brittleness through a shale play, which can greatly improve the effectiveness of fracking strategies. XRD and XRF are used in determining the contribution of clay minerals to the engineering behavior of rocks and soils.
  • #21: Certain clays (smectites) will swell up in the presence of water. When they swell, they can trap the drillpipe and block up the wellhole. You will want to switch to an oil-based drilling mud.
  • #22: Scaling – seawater can combine with certain minerals (e.g. sulfates) to form scale both in the formation and in the drillpipe. If you see these minerals, you know to not use a sea-water based drilling mud and to be very cautious using seawater in nearby injection wells.
  • #23: Accurate measurements of clay content are imperative to evaluating the relative brittleness through a shale play can greatly improve the effectiveness of fracking strategies. XRD and XRF are used in determining the contribution of clay minerals to the engineering behavior of rocks and soils.
  • #26: Using these X-rays techniques, we can now see vivid differences in visually homogenous shales. With clarity, you can see the areas of the well that have more carbonates, are more siliceous, and places of changes in the clay. One great benefit having of XRD on site is that when problems arise while drilling, such as wellbore stability and fluid losses, the subsequent cavings can be immediately identified to help pinpoint the location of losses. Trace and Marker minerals have a myriad of applications in exploration and reservoir characterization. Also, XRD will help define the brittle zones and sweet spots for fracking and production.
  • #27: (12 minute acquisition time Co-Ka energy)
  • #29: Looking more closely at certain depths we can see the changes in mineralogy
  • #31: Our customers are typically doing ~ 5-10 minute test, depending upon how much they care about quantification of the secondary peaks.
  • #33: Semi-quant RIR data from Terra in blind comparison to lab based system
  • #35: Not only do the Olympus XRD and XRF instruments provide fast analysis but having them on site eliminates the time involved to send samples to an outside lab. This puts the information in the operators hands almost immediately allowing them to make decisions in real-time. As you can see from the examples we have given during this presentation - there are many benefits for having these instruments in the well logging trailer as part of the routine analysis. - They can provide more detailed information than was possible in the past - They can provide back up information and verification to other analysis tools and - They can provide data that can help optimize the operations and better understand what is going on under ground
  • #36: Jose - I would like to extend my personal thank you to Dawn for joining me today and thank you also to Diversified Well Logging for having Dawn collaborate with us on this webinar. Dawn – (you can chime in with any thank you and closing remarks) Jose – We are looking forward to answering some of your questions now so I’ll turn it back over to Gregg to get us started