SlideShare a Scribd company logo
By: Dr Mostafa Mahmoud PhD,
Consultant Microbiologist, Riyadh, MOH
Assist. Professor of Medical Microbiology &
Immunology, Faculty of Medicine, ASU, Cairo,
Egypt.
What is an Antibiogram (ABG)?
 An antibiogram is an overall profile of antimicrobial
susceptibility testing (AST) results of a specific
microorganism to a battery of antimicrobial drugs.
 This profile is generated by the laboratory using
aggregate data from a hospital or healthcare system;
data are summarized periodically and presented
showing percentages (%) of organisms tested that
are susceptible to a particular antimicrobial drug.
 Only results for antimicrobial drugs that are
routinely tested and clinically useful should be
presented to clinicians.
How to measure the antimicrobial
susceptibility in the micro lab?
1- Disc Diffusion (DD) method and E-test (Manual
labs).
2- The broth dilution (MIC) method either macro or
microdilution (Automated labs).
1- Disc Diffusion method (Manual labs)
Disc Diffusion Ring Disc Diffusion E- Test.
2- Broth Microdilution (Microscan)
2- Broth Microdilution (Phoenix)
2- Broth Microdilution (Vitek 2)
Recommendations for Antibiograms:
 Analyze/present cumulative antibiogram report at least
annually;
 Include only final, verified test results;
 Include only species with testing data for ≥ 30 isolates.
 Include only diagnostic (not surveillance) isolates
 Eliminate duplicates by including only the first isolate of a
species/patient/analysis period, irrespective of body site or
antimicrobial profile
 Include only antimicrobial agents routinely tested; do not
report supplemental agents selectively tested on resistant
isolates only.
 Report %S (Susceptible) and do not include %I
(intermediate) in the statistic.
Antibiogram Uses:
1- Antibiograms help guide the clinician and
pharmacist in selecting the best empirical
antimicrobial treatment in the event of pending
microbiology culture and susceptibility results.
2- They are also useful tools for detecting and
monitoring trends in antimicrobial resistance.
Scope of applications of ABG:
1- Staff working in analysis and presentation of AST data
(e.g. clinical microbiologists, pharmacists, physicians).
2- Staff utilizing cumulative AST data to make clinical
decisions (e.g. clinical microbiologists, infectious
disease specialists and other clinicians, infection
control practitioners, pharmacists, epidemiologists,
other health care personnel, and public health
officials).
3- For designing information systems for the storage and
analysis of AST data (e.g. laboratory information system
[LIS] vendors, manufacturers of diagnostic products
that include epidemiology software packages).
Data Required to perform ABG:
1. Patient:
- Required: ID,
- Desirable: Age, Sex, Location (Ward),
Admission date;
2. Specimen information:
- Required: number, type & date of
collection.
- Desirable: Body site e.g. right or left
3. Organism information:
- Required: identification up to the genus or species
level (genus can be satisfactory).
- Desirable: Isolate number, change in name of
isolate (if happen), Infection control data e.g.
colonization or infection, community-
acquired, or healthcare associated CA or HAI
4. AST information:
- Required: final MIC or zone diameter (ZD) used,
method used, special tests for detection of B-
lactamase, mecA gene, PBP2a by agar
screening , PCR or latex testing respectively.
- Desirable: detailed MIC or ZD
Frequency of Performance
 At least once yearly.
 More frequent with high number of isolates,
new antimicrobial introduced, or presence of
important medical changes.
Facility:
 ABG is performed based upon local institution-
specific susceptibility data.
Data presentation:
 In a tabular form.
 No universal formats
 Separate tables for Gram-positive, and Gram-
negative, also for anaerobes and yeasts if
applicable.
 Arrange the organisms within the table
alphabetically, by organism group of by the
prevalence.
 Some labs may present data by body site e.g.
urine gram-negative or gram-positive.
 Antibiogram for critical care units (more
resistant) e.g. ICUs better to be separated to
compare %S with the total hospital.
 Comments upon the table must be included to
explain it.
 Recommended species to be included (even if
<30 isolates) in the tables are the following:
Gram-negative species:
 Acinetobacter baumannii • Citrobacter freundii
 Enterobacter aerogenes • Enterobacter cloacae
 Escherichia coli • Haemophilus influenzae
 Klebsiella pneumoniae • Morganella morganii
 Proteus mirabilis • Providencia spp.
 Pseudomonas aeruginosa • Salmonella spp.
 Serratia marcescens • Shigella spp.
 Stenotrophomonas maltophilia
Example for Gram-negative ABG
- Comments upon the table must be included.
- Denoting of abbreviations must be included e.g. AMK= Amikacin.
Gram-positive species:
 Enterococcus spp. (preferable to be in separate species).
 Staphylococcus aureus
 Coagulase-negative Staphylococcus spp. (exclude S.
lugdunensis and S. saprophyticus, separately if in
sufficient numbers).
 Streptococcus pneumoniae.
 Viridans group Streptococcus spp. (from usually sterile
body sites only).
Example for Gram-Positive ABG
- Comments upon the table must be included.
- Denoting of abbreviations must be included e.g. CLI= Clindamycin
Example for Gram-Positive ABG
Anaerobes
 Bacteroides fragilis
 Clostridium perfringens
Example of ABG data Report by alphabetically
listing of Antimicrobial Agents.
Example of Antibiogram data Report by class of
Antimicrobial Agents.
Presenting Emerging Resistance Trends:
 Presentation of resistant organisms over years can be
presented in tables or graphs e.g.:
 MRSA (S. aureus – %S for oxacillin - inpatient and
outpatient);
 VRE (Enterococcus spp. – %S to vancomycin isolates
from sterile body sites);
 E. coli – %S to trimethoprim-sulfamethoxazole (urine
isolates) and fluoroquinolones;
 ESBLs (K. pneumoniae and E. coli – % of isolates that
produce ESBLs);
 P. aeruginosa – %S to fluoroquinolones and/or
imipenem.
Presenting trends in resistance to Oxacillin
(MRSA):
Different ABG presentation formats
 By nursing unit or care sits: i.e. patient location e.g.
ICU, Burn unit, Ward, OPD, nursing home for the
better selection of site specific empirical therapy.
 By organism’s resistance character: especial for
MDROs e.g. MRSA, VRE, MDR Acineto., ESBLs.
 By specimen type or infection site: e.g. urine
isolates, blood isolates).
 By clinical service or patient population: to guide
initial empirical antimicrobial therapy for specific
patient types (e.g. surgical, pediatric, cystic fibrosis,
transplant, burn).
Data presentation in tables:
1- Date of the period of the Report.
2- Name of the Laboratory of the facility.
3- Comments upon methodology used in
preparation of data.
4- Organism name and numbers
Calculations
 Report the first isolates of pathological
organisms only not surveillance one.
 Only report organism with more than 30
isolates.
 Use CLSI recommended antimicrobials to each
species.
 Report only the percentage of susceptible (S%)
not intermediate.
 Give in the form of tables and graphs.
Number of isolates:
 Typically should > 30 isolates to be statistically
significant.
 If less than 30 you have to put comment upon
the table.
 You can group similar species together to
increase the numbers e.g. salmonella or shigella
species.
Distribution Formats:
 In easy accessible formats to all prescribing
Physicians, Infection control staffs, Pharmacists,
Epidemiologists & Microbiology Staffs‘:-
 Small cards in coat pocket
 Or in laminated sheets.
 In the institution website (Intranet). As
application or PDF.
 Printed formats especially in special areas like
ICUs.
Antibiogram
cards
Antibiogram laminated sheet
Antibiogram laminated sheet GP & Anaer.
Antibiogram laminated sheet GN
Methods of calculations:
1- Confidence Intervals (CI): it gives the
precision of susceptibility % and depends upon
the numbers of isolates.
2- Statistical Significance of Changes in
Susceptibility Rates: use Chi-square test to
compare different S% in different years. A P
value of ≤ 0.05 is accepted for being significantly
different.
Limitations of Data, Data Analysis, and
Data Presentation
 Culturing Practices: sample collection,
transport and storage. Bias in treatment e.g. in
OPD, change in culturing technique in the lab.
 Influence of Small Numbers of Isolates:
number of isolates to be > 30.
Antibiogram Limitations:
1. Minimum inhibitory concentrations (MICs) are
not included; as a result subtle trends below
the resistance threshold (known as “MIC
creep”) are not reflected.
2. Data do not take into account patient factors
such as history of infection or past
antimicrobial use. Resistance patterns for
certain drugs vary significantly by age, and a
patient’s underlying medical condition may
affect how well an antimicrobial works
3. Data are the result of single organism-
antimicrobial combinations, therefore do
not show trends in cross-resistance of an
organism to other drugs, nor do they reveal
synergistic properties of antimicrobials used
in combination.
4. Data may not be generalizable to specific
patient populations or locations of a
healthcare facility if the antibiogram is
compiled using hospital- or healthcare
system-wide data.
Examples of Accepted Antibiogram (KSH)
KSH
KKHK
Iman
(Iman)
Defective Antibiograms
No Comments!!!!!
Antibiogram CLSI Recommendations
Graphs not from our hospitals
Klebsiella - Percentage of sensitive
Isolates (178).
0%
10%
20%
30%
40%
50%
60%
70%
80%
90%
80%
37.60%
29.20%
37.10%
34.30%
61.20%
35.40%
32%
43.30%
75.30%
54.50%
87.60%
62.40%
83.70%
30.30%
68.50%68.50%
39.30%
29.30%
Series1
Pseudomonas Aeruginosa -
Percentage of sensitive Isolates (127).
0.00%
10.00%
20.00%
30.00%
40.00%
50.00%
60.00%
70.00%
AKCEFPCTXCAZCIPFOSFGNIPMLEVOMEROPIPTAZTOB
60.60%
48.80%
3.90%
48%
52.80%
38.60%
52.80%
55.90%
54.30%
58.30%
55.90%
66.90%
54.30%
Series1
Acinaetobacter - Percentage of sensitive
Isolates(20).
0%
10%
20%
30%
40%
50%
60%
70%
80%
AKCEFPCTXCAZCIPGNIPMLEVOMEROPIPTAZTOBSXT
25%
10%10%
20%
15%
35%
10%10%10%10%
30%
25%
70%
Series1
Staph.aureus - Percentage of sensitive
Isolates (67).
0%
10%
20%
30%
40%
50%
60%
70%
80%
90%
100%97%
3%
97%
89.60%
70%
95.50%
98.50%
91%
95.50%
100%100%
3%
100%100%100%
98.50%
100%
Series1
Antibiogram CLSI Recommendations
References
 CLSI. Analysis and Presentation of Cumulative Antimicrobial
Susceptibility Test Data; Approved Guideline—Third Edition.
CLSI document M39-A3. Wayne, PA: Clinical and Laboratory
Standards Institute; 2012.
 King Fahd Medical City Antibiograms.
 King Khaled Hospital Hafr Al-Baten
Thank you

More Related Content

PPTX
INTERPRETATION OF ANTIBIOGRAMS Trends of Change
PPTX
HOSPITAL ANTIBIOGRAMS principles interpretation and documentation
PPTX
Antibiogram
PPT
Susceptibility Update 2024 | Microbes with Morgan
PPTX
Carbapenem resistance entrobacteriaceae - ISCCM
PPT
Susceptibility 2023
PPTX
Best Practice for Colistin Susceptibility Testing: Methods and Evidence (Mini...
PDF
Phenotypic methods used in antimicrobial susceptibility testing
INTERPRETATION OF ANTIBIOGRAMS Trends of Change
HOSPITAL ANTIBIOGRAMS principles interpretation and documentation
Antibiogram
Susceptibility Update 2024 | Microbes with Morgan
Carbapenem resistance entrobacteriaceae - ISCCM
Susceptibility 2023
Best Practice for Colistin Susceptibility Testing: Methods and Evidence (Mini...
Phenotypic methods used in antimicrobial susceptibility testing

What's hot (20)

PPTX
Laboratory detection of resistant bacteria
PPTX
Microbiology
PPTX
beta lactamases
PPTX
ESBL Detection
PPT
Quality control of antimicrobial susceptibility tests
PPTX
ESBL and mbl-method of detection-1.pptx
PPTX
Automated system for bacterial identification
PPT
Manual blood culture Techniques
PDF
Role of Microbiology Labs in Infection Control
PPTX
MRSA Detection
PPTX
Vitek 2 compac tpptx
PPTX
PPSX
Automation in microbiology, changing concept and defeating challenges
PPTX
Inducible Clindamycin Resistance Test
PPTX
Antimicrobial susceptibility testing – disk diffusion methods
PPTX
Amp C (1).pptx
PPTX
Epsilometer Test
PPTX
Anti fungal susceptibility
PPTX
Non-Fermentative Gram negative bacilli
PPTX
Antimicrobial stewardship
Laboratory detection of resistant bacteria
Microbiology
beta lactamases
ESBL Detection
Quality control of antimicrobial susceptibility tests
ESBL and mbl-method of detection-1.pptx
Automated system for bacterial identification
Manual blood culture Techniques
Role of Microbiology Labs in Infection Control
MRSA Detection
Vitek 2 compac tpptx
Automation in microbiology, changing concept and defeating challenges
Inducible Clindamycin Resistance Test
Antimicrobial susceptibility testing – disk diffusion methods
Amp C (1).pptx
Epsilometer Test
Anti fungal susceptibility
Non-Fermentative Gram negative bacilli
Antimicrobial stewardship
Ad

Similar to Antibiogram CLSI Recommendations (20)

PPS
Role of the Laboratory in Antimicrobial Resistance Data
PDF
CLINICAL UTILITY OF ANTIBIOGRAMS
PPTX
Antimicrobial Susceptibility Testing.pptx
PDF
Antibiotics
PDF
It's More Fun Doing the Antibiogram
PPT
ACT antimicrobial susceptibility testing, inoculation and drug sensitivity
PPTX
Principles of antibacterial agent selection
PPTX
Dr d p rajani
PDF
Documention of antibiograms with whonet
PPTX
Laboratory procedures &amp; micro organisms susceptibility and resistance pat...
PPSX
Changes in CLSI 2017
PDF
SCIENTIFIC UTILITY OF ANTIBIOGRAMS (By disc diffusion method)
PPT
Suplementing Testing Methods in AMR .ppt
PPTX
4_6030689835172236520.pptx
PDF
Surveillance of antimicrobial resistance, antimicrobial use and health-care i...
 
PPTX
journal club prevention of grma negative sepsis through beta lactam deescalation
PPT
Susceptibility Update 2025 - Margie Morgan, PhD
PPTX
AMR.pptx
PPTX
principles of antimicrobial therapy (1).pptx
PPTX
principles of antimicrobial.pptx
Role of the Laboratory in Antimicrobial Resistance Data
CLINICAL UTILITY OF ANTIBIOGRAMS
Antimicrobial Susceptibility Testing.pptx
Antibiotics
It's More Fun Doing the Antibiogram
ACT antimicrobial susceptibility testing, inoculation and drug sensitivity
Principles of antibacterial agent selection
Dr d p rajani
Documention of antibiograms with whonet
Laboratory procedures &amp; micro organisms susceptibility and resistance pat...
Changes in CLSI 2017
SCIENTIFIC UTILITY OF ANTIBIOGRAMS (By disc diffusion method)
Suplementing Testing Methods in AMR .ppt
4_6030689835172236520.pptx
Surveillance of antimicrobial resistance, antimicrobial use and health-care i...
 
journal club prevention of grma negative sepsis through beta lactam deescalation
Susceptibility Update 2025 - Margie Morgan, PhD
AMR.pptx
principles of antimicrobial therapy (1).pptx
principles of antimicrobial.pptx
Ad

More from Mostafa Mahmoud (17)

PPTX
Validation of lab instruments and quantitative test methods
PPTX
Validation of qualitative lab test methods
PPTX
KPIs in Microbiology
PPTX
Serological Diagnosis of Infectious Diseases
PPTX
Lab diagnosis of Sexually transmitted Infections (STIs)
PPT
Conventional methods for bacterial identification
PPTX
Microbiology lab QC
PPT
Bacterial Culture media
PPTX
Lab diagnosis of tb dr mostafa lecture
PPTX
Viral Hemorrhagic Fevers
PPTX
Multidrug Resistant Oraganisms (MDRO) infection control
PPTX
Hiv lab diagnosis
PPTX
Prevention and Control of AIDS for World AIDS day
PPTX
MERS CoV MOH Guidelines update 2015
PPTX
CSF Examination
PPTX
Anaerobic Culture Methods
PPTX
Validation of lab instruments and quantitative test methods
Validation of qualitative lab test methods
KPIs in Microbiology
Serological Diagnosis of Infectious Diseases
Lab diagnosis of Sexually transmitted Infections (STIs)
Conventional methods for bacterial identification
Microbiology lab QC
Bacterial Culture media
Lab diagnosis of tb dr mostafa lecture
Viral Hemorrhagic Fevers
Multidrug Resistant Oraganisms (MDRO) infection control
Hiv lab diagnosis
Prevention and Control of AIDS for World AIDS day
MERS CoV MOH Guidelines update 2015
CSF Examination
Anaerobic Culture Methods

Recently uploaded (20)

PPTX
Fundamentals of human energy transfer .pptx
PPTX
DENTAL CARIES FOR DENTISTRY STUDENT.pptx
PPTX
Imaging of parasitic D. Case Discussions.pptx
PPTX
15.MENINGITIS AND ENCEPHALITIS-elias.pptx
PPT
ASRH Presentation for students and teachers 2770633.ppt
PPTX
Acid Base Disorders educational power point.pptx
PPTX
Uterus anatomy embryology, and clinical aspects
PPT
Copy-Histopathology Practical by CMDA ESUTH CHAPTER(0) - Copy.ppt
PPTX
Neuropathic pain.ppt treatment managment
PPTX
Important Obstetric Emergency that must be recognised
DOCX
RUHS II MBBS Microbiology Paper-II with Answer Key | 6th August 2025 (New Sch...
PPTX
Pathophysiology And Clinical Features Of Peripheral Nervous System .pptx
PPT
OPIOID ANALGESICS AND THEIR IMPLICATIONS
PPT
Breast Cancer management for medicsl student.ppt
PPT
1b - INTRODUCTION TO EPIDEMIOLOGY (comm med).ppt
PPTX
surgery guide for USMLE step 2-part 1.pptx
PPTX
ACID BASE management, base deficit correction
PPTX
History and examination of abdomen, & pelvis .pptx
PDF
Therapeutic Potential of Citrus Flavonoids in Metabolic Inflammation and Ins...
PDF
Medical Evidence in the Criminal Justice Delivery System in.pdf
Fundamentals of human energy transfer .pptx
DENTAL CARIES FOR DENTISTRY STUDENT.pptx
Imaging of parasitic D. Case Discussions.pptx
15.MENINGITIS AND ENCEPHALITIS-elias.pptx
ASRH Presentation for students and teachers 2770633.ppt
Acid Base Disorders educational power point.pptx
Uterus anatomy embryology, and clinical aspects
Copy-Histopathology Practical by CMDA ESUTH CHAPTER(0) - Copy.ppt
Neuropathic pain.ppt treatment managment
Important Obstetric Emergency that must be recognised
RUHS II MBBS Microbiology Paper-II with Answer Key | 6th August 2025 (New Sch...
Pathophysiology And Clinical Features Of Peripheral Nervous System .pptx
OPIOID ANALGESICS AND THEIR IMPLICATIONS
Breast Cancer management for medicsl student.ppt
1b - INTRODUCTION TO EPIDEMIOLOGY (comm med).ppt
surgery guide for USMLE step 2-part 1.pptx
ACID BASE management, base deficit correction
History and examination of abdomen, & pelvis .pptx
Therapeutic Potential of Citrus Flavonoids in Metabolic Inflammation and Ins...
Medical Evidence in the Criminal Justice Delivery System in.pdf

Antibiogram CLSI Recommendations

  • 1. By: Dr Mostafa Mahmoud PhD, Consultant Microbiologist, Riyadh, MOH Assist. Professor of Medical Microbiology & Immunology, Faculty of Medicine, ASU, Cairo, Egypt.
  • 2. What is an Antibiogram (ABG)?  An antibiogram is an overall profile of antimicrobial susceptibility testing (AST) results of a specific microorganism to a battery of antimicrobial drugs.  This profile is generated by the laboratory using aggregate data from a hospital or healthcare system; data are summarized periodically and presented showing percentages (%) of organisms tested that are susceptible to a particular antimicrobial drug.  Only results for antimicrobial drugs that are routinely tested and clinically useful should be presented to clinicians.
  • 3. How to measure the antimicrobial susceptibility in the micro lab? 1- Disc Diffusion (DD) method and E-test (Manual labs). 2- The broth dilution (MIC) method either macro or microdilution (Automated labs).
  • 4. 1- Disc Diffusion method (Manual labs) Disc Diffusion Ring Disc Diffusion E- Test.
  • 8. Recommendations for Antibiograms:  Analyze/present cumulative antibiogram report at least annually;  Include only final, verified test results;  Include only species with testing data for ≥ 30 isolates.  Include only diagnostic (not surveillance) isolates  Eliminate duplicates by including only the first isolate of a species/patient/analysis period, irrespective of body site or antimicrobial profile  Include only antimicrobial agents routinely tested; do not report supplemental agents selectively tested on resistant isolates only.  Report %S (Susceptible) and do not include %I (intermediate) in the statistic.
  • 9. Antibiogram Uses: 1- Antibiograms help guide the clinician and pharmacist in selecting the best empirical antimicrobial treatment in the event of pending microbiology culture and susceptibility results. 2- They are also useful tools for detecting and monitoring trends in antimicrobial resistance.
  • 10. Scope of applications of ABG: 1- Staff working in analysis and presentation of AST data (e.g. clinical microbiologists, pharmacists, physicians). 2- Staff utilizing cumulative AST data to make clinical decisions (e.g. clinical microbiologists, infectious disease specialists and other clinicians, infection control practitioners, pharmacists, epidemiologists, other health care personnel, and public health officials). 3- For designing information systems for the storage and analysis of AST data (e.g. laboratory information system [LIS] vendors, manufacturers of diagnostic products that include epidemiology software packages).
  • 11. Data Required to perform ABG: 1. Patient: - Required: ID, - Desirable: Age, Sex, Location (Ward), Admission date; 2. Specimen information: - Required: number, type & date of collection. - Desirable: Body site e.g. right or left
  • 12. 3. Organism information: - Required: identification up to the genus or species level (genus can be satisfactory). - Desirable: Isolate number, change in name of isolate (if happen), Infection control data e.g. colonization or infection, community- acquired, or healthcare associated CA or HAI 4. AST information: - Required: final MIC or zone diameter (ZD) used, method used, special tests for detection of B- lactamase, mecA gene, PBP2a by agar screening , PCR or latex testing respectively. - Desirable: detailed MIC or ZD
  • 13. Frequency of Performance  At least once yearly.  More frequent with high number of isolates, new antimicrobial introduced, or presence of important medical changes. Facility:  ABG is performed based upon local institution- specific susceptibility data.
  • 14. Data presentation:  In a tabular form.  No universal formats  Separate tables for Gram-positive, and Gram- negative, also for anaerobes and yeasts if applicable.  Arrange the organisms within the table alphabetically, by organism group of by the prevalence.
  • 15.  Some labs may present data by body site e.g. urine gram-negative or gram-positive.  Antibiogram for critical care units (more resistant) e.g. ICUs better to be separated to compare %S with the total hospital.  Comments upon the table must be included to explain it.  Recommended species to be included (even if <30 isolates) in the tables are the following:
  • 16. Gram-negative species:  Acinetobacter baumannii • Citrobacter freundii  Enterobacter aerogenes • Enterobacter cloacae  Escherichia coli • Haemophilus influenzae  Klebsiella pneumoniae • Morganella morganii  Proteus mirabilis • Providencia spp.  Pseudomonas aeruginosa • Salmonella spp.  Serratia marcescens • Shigella spp.  Stenotrophomonas maltophilia
  • 17. Example for Gram-negative ABG - Comments upon the table must be included. - Denoting of abbreviations must be included e.g. AMK= Amikacin.
  • 18. Gram-positive species:  Enterococcus spp. (preferable to be in separate species).  Staphylococcus aureus  Coagulase-negative Staphylococcus spp. (exclude S. lugdunensis and S. saprophyticus, separately if in sufficient numbers).  Streptococcus pneumoniae.  Viridans group Streptococcus spp. (from usually sterile body sites only).
  • 19. Example for Gram-Positive ABG - Comments upon the table must be included. - Denoting of abbreviations must be included e.g. CLI= Clindamycin
  • 22. Anaerobes  Bacteroides fragilis  Clostridium perfringens
  • 23. Example of ABG data Report by alphabetically listing of Antimicrobial Agents.
  • 24. Example of Antibiogram data Report by class of Antimicrobial Agents.
  • 25. Presenting Emerging Resistance Trends:  Presentation of resistant organisms over years can be presented in tables or graphs e.g.:  MRSA (S. aureus – %S for oxacillin - inpatient and outpatient);  VRE (Enterococcus spp. – %S to vancomycin isolates from sterile body sites);  E. coli – %S to trimethoprim-sulfamethoxazole (urine isolates) and fluoroquinolones;  ESBLs (K. pneumoniae and E. coli – % of isolates that produce ESBLs);  P. aeruginosa – %S to fluoroquinolones and/or imipenem.
  • 26. Presenting trends in resistance to Oxacillin (MRSA):
  • 27. Different ABG presentation formats  By nursing unit or care sits: i.e. patient location e.g. ICU, Burn unit, Ward, OPD, nursing home for the better selection of site specific empirical therapy.  By organism’s resistance character: especial for MDROs e.g. MRSA, VRE, MDR Acineto., ESBLs.  By specimen type or infection site: e.g. urine isolates, blood isolates).  By clinical service or patient population: to guide initial empirical antimicrobial therapy for specific patient types (e.g. surgical, pediatric, cystic fibrosis, transplant, burn).
  • 28. Data presentation in tables: 1- Date of the period of the Report. 2- Name of the Laboratory of the facility. 3- Comments upon methodology used in preparation of data. 4- Organism name and numbers
  • 29. Calculations  Report the first isolates of pathological organisms only not surveillance one.  Only report organism with more than 30 isolates.  Use CLSI recommended antimicrobials to each species.  Report only the percentage of susceptible (S%) not intermediate.  Give in the form of tables and graphs.
  • 30. Number of isolates:  Typically should > 30 isolates to be statistically significant.  If less than 30 you have to put comment upon the table.  You can group similar species together to increase the numbers e.g. salmonella or shigella species.
  • 31. Distribution Formats:  In easy accessible formats to all prescribing Physicians, Infection control staffs, Pharmacists, Epidemiologists & Microbiology Staffs‘:-  Small cards in coat pocket  Or in laminated sheets.  In the institution website (Intranet). As application or PDF.  Printed formats especially in special areas like ICUs.
  • 36. Methods of calculations: 1- Confidence Intervals (CI): it gives the precision of susceptibility % and depends upon the numbers of isolates. 2- Statistical Significance of Changes in Susceptibility Rates: use Chi-square test to compare different S% in different years. A P value of ≤ 0.05 is accepted for being significantly different.
  • 37. Limitations of Data, Data Analysis, and Data Presentation  Culturing Practices: sample collection, transport and storage. Bias in treatment e.g. in OPD, change in culturing technique in the lab.  Influence of Small Numbers of Isolates: number of isolates to be > 30.
  • 38. Antibiogram Limitations: 1. Minimum inhibitory concentrations (MICs) are not included; as a result subtle trends below the resistance threshold (known as “MIC creep”) are not reflected. 2. Data do not take into account patient factors such as history of infection or past antimicrobial use. Resistance patterns for certain drugs vary significantly by age, and a patient’s underlying medical condition may affect how well an antimicrobial works
  • 39. 3. Data are the result of single organism- antimicrobial combinations, therefore do not show trends in cross-resistance of an organism to other drugs, nor do they reveal synergistic properties of antimicrobials used in combination. 4. Data may not be generalizable to specific patient populations or locations of a healthcare facility if the antibiogram is compiled using hospital- or healthcare system-wide data.
  • 40. Examples of Accepted Antibiogram (KSH)
  • 41. KSH
  • 42. KKHK
  • 43. Iman
  • 48. Graphs not from our hospitals Klebsiella - Percentage of sensitive Isolates (178). 0% 10% 20% 30% 40% 50% 60% 70% 80% 90% 80% 37.60% 29.20% 37.10% 34.30% 61.20% 35.40% 32% 43.30% 75.30% 54.50% 87.60% 62.40% 83.70% 30.30% 68.50%68.50% 39.30% 29.30% Series1
  • 49. Pseudomonas Aeruginosa - Percentage of sensitive Isolates (127). 0.00% 10.00% 20.00% 30.00% 40.00% 50.00% 60.00% 70.00% AKCEFPCTXCAZCIPFOSFGNIPMLEVOMEROPIPTAZTOB 60.60% 48.80% 3.90% 48% 52.80% 38.60% 52.80% 55.90% 54.30% 58.30% 55.90% 66.90% 54.30% Series1
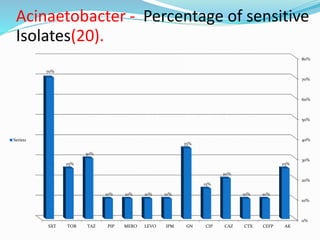
  • 50. Acinaetobacter - Percentage of sensitive Isolates(20). 0% 10% 20% 30% 40% 50% 60% 70% 80% AKCEFPCTXCAZCIPGNIPMLEVOMEROPIPTAZTOBSXT 25% 10%10% 20% 15% 35% 10%10%10%10% 30% 25% 70% Series1
  • 51. Staph.aureus - Percentage of sensitive Isolates (67). 0% 10% 20% 30% 40% 50% 60% 70% 80% 90% 100%97% 3% 97% 89.60% 70% 95.50% 98.50% 91% 95.50% 100%100% 3% 100%100%100% 98.50% 100% Series1
  • 54. References  CLSI. Analysis and Presentation of Cumulative Antimicrobial Susceptibility Test Data; Approved Guideline—Third Edition. CLSI document M39-A3. Wayne, PA: Clinical and Laboratory Standards Institute; 2012.  King Fahd Medical City Antibiograms.  King Khaled Hospital Hafr Al-Baten