SlideShare a Scribd company logo
2
Most read
4
Most read
8
Most read
Bayesian Classification
Thomas Bayes (1701 – 7 April 1761) was an English
statistician, philosopher and Presbyterian minister
who is known for having formulated a specific case of
the theorem that bears his name: Bayes' theorem.
Bayes never published what would eventually
become his most famous accomplishment, his notes
were edited and published after his death by Richard
Price
Sir Thomas Bayes
Slides by Manu Chandel, IIT Roorkee 1
Bayes Theorem
Total Probability
Bayes Theorem
E1 E2 E3 …………………………… EN
A
1. A is a outcome which can result from
all the events E1, E2, ………… EN
2. All the events E1, E2, E3………. EN are
mutually exclusive and exhaustive
Slides by Manu Chandel, IIT Roorkee 2
Bayes Theorem Example
Q. Given two bags each one having red and white balls.
Both bags have equal chance of being chosen.
If a ball is picked at random and found to be Red,
what is the probability that the ball was chosen from bag A?
Ans. Total probability of Red Ball =
=
=
Probability that red ball was from Bag A
∗
( )
=
Slides by Manu Chandel, IIT Roorkee 3
Discriminative v/s Generative classifiers
For a prediction function
Discriminative classifiers
estimate directly from
the training data
Generative classifiers estimate
and directly
from the training data.
Naïve Bayes Classifier is a generative classifier
Slides by Manu Chandel, IIT Roorkee 4
MAP Classification Rule
Maximum A Posterior rule says that :
“Jiski lathi uski bhains “
Input data belongs to the class whose is highest.
Example :
Suppose a news article is to be classified into following three categories: a) Politics b) Finance and
c) Sports.
So, X is our news article and three categories are denoted by Y1, Y2 and Y3 .
Lets say , ,
then according to MAP classification rule news article will be classified into category 2 i.e. finance.
Slides by Manu Chandel, IIT Roorkee 5
Naïve Bayes (Discrete values)
An input to the classifier is often a feature vector containing various feature values
e.g. A news article input to a news article classifier may be a vector of words.
In Bayes classification we need to learn and from the given data.
Here is feature vector with as feature values.
Learning joint probability ( , ,…… , )
is difficult. Hence Naïve Bayes
assumes that features are independent of each other. Assuming
independence of features leads to
( , ,…… , )
Slides by Manu Chandel, IIT Roorkee 6
Naïve Bayes Algorithm (with Example)
Learning phase of Naïve Bayes is represented by an example.
Classifier needs to learn and for all Y
Sr Year Height Pocket
Money
Grade Single
1 1 Average Low High Yes
2 2 Tall Average Low No
3 3 Short High High No
4 4 Average Average Low No
5 2 Tall High Low Yes
6 3 Tall Low High No
7 3 Average High Average Yes
8 1 Tall Average Average Yes
9 4 Short Average High Yes
Data collected
anonymously
from BTECH
Students IITR.
Slides by Manu Chandel, IIT Roorkee 7
Naïve Bayes (Learning Phase )
Year ( = ) ( = )
1 2/5 0
2 1/5 1/4
3 1/5 2/4
4 1/5 1/4
Height ( = ) ( = )
Tall 2/5 2/4
Short 1/5 1/4
Average 2/5 1/4
PM ( = ) ( = )
High 2/5 1/4
Low 1/5 1/4
Average 2/5 2/4
Grade ( = ) ( = )
High 2/5 2/4
Low 1/5 2/4
Average 2/5 0
Slides by Manu Chandel, IIT Roorkee 8
Naïve Bayes (Testing Phase)
What will be the outcome of X= <4,Tall,Average,High> ?
=
= 4
∗
=
∗
=
∗
=
∗ ( = )
= 1/5 * 2/5 * 2/5 * 2/5*5/9
= 0.00711
=
= 4
∗
=
∗
=
∗
=
∗ ( = )
= 1/4 * 2/4 * 2/4 * 2/4*4/9
= 0.0138 As 0.0138 > 0.00711 then X will be classified as Single = No
Slides by Manu Chandel, IIT Roorkee 9
Naïve Bayes (Continuous Values )
Conditional probability often modeled with the normal distribution
= =
1
2
  exp(−
( − )
2
)
= mean of feature values of =
= standard deviation of feature values of =
Learning Phase
For = , , … … , = , , … . output Normal distributions.
Test Phase
Given an unknown instance = , , … . . ,
• Instead of looking-up tables, calculate conditional probabilities with all the normal distributions achieved in
the learning phrase
• Apply the MAP rule to make a decision
Slides by Manu Chandel, IIT Roorkee 10
Naïve Bayes Continuous Value Example
• Temperature is naturally of continuous value.
• Yes: 25.2, 19.3, 18.5, 21.7, 20.1, 24.3, 22.8, 23.1, 19.8
• No: 27.3, 30.1, 17.4, 29.5, 15.1
• Estimate mean and variance for each class
• and
•
• Learning phase output two Gaussian models for
•
.
 
( . )
.
•
.
 
( . )
.
Slides by Manu Chandel, IIT Roorkee 11
Relevant Issues
1. Violation of independence Assumption
2. Zero Conditional Probability Problem
If no example contains a feature value In this circumstances
This can be solved by
Slides by Manu Chandel, IIT Roorkee 12
Underflow Prevention
• Multiplying lots of probabilities, which are between 0 and 1 by definition, can
result in floating-point underflow.
• Since it is better to perform all computations by
summing logs of probabilities rather than multiplying probabilities.
• Class with highest final un-normalized log probability score is still the most
probable.
Slides by Manu Chandel, IIT Roorkee 13
Summary
• Naïve Bayes: the conditional independence assumption
• Training is very easy and fast, just requiring considering each attribute in each class separately.
• Test is straightforward, just looking up tables or calculating conditional probabilities with
estimated distributions.
• A popular generative model
• Performance competitive to most of state-of-the-art classifiers even in presence of violating
independence assumption.
• Many successful applications, e.g., spam mail filtering
Slides by Manu Chandel, IIT Roorkee 14

More Related Content

PPT
2.3 bayesian classification
PDF
Naive Bayes
PPTX
Statistics for data science
PPTX
Decision Tree Learning
PPTX
Naive bayes
PPTX
Support Vector Machine ppt presentation
PDF
K - Nearest neighbor ( KNN )
PPTX
Classification and Regression
2.3 bayesian classification
Naive Bayes
Statistics for data science
Decision Tree Learning
Naive bayes
Support Vector Machine ppt presentation
K - Nearest neighbor ( KNN )
Classification and Regression

What's hot (20)

ODP
NAIVE BAYES CLASSIFIER
PPTX
ML - Multiple Linear Regression
PDF
Bayesian inference
PPTX
Naive Bayes Presentation
PDF
Decision trees in Machine Learning
PDF
Data preprocessing using Machine Learning
PDF
Bayesian networks
PPTX
Maximum likelihood estimation
PDF
Support Vector Machines
PDF
Principal Component Analysis
PPT
Data mining techniques unit 1
PDF
Lecture9 - Bayesian-Decision-Theory
PDF
Dimensionality Reduction
PPTX
Fuzzy Set
PPTX
Bayesian Linear Regression.pptx
PPTX
K-Folds Cross Validation Method
PPT
Support Vector Machines
PPTX
Machine Learning - Splitting Datasets
PPTX
Machine Learning
PPTX
Naive Bayes
NAIVE BAYES CLASSIFIER
ML - Multiple Linear Regression
Bayesian inference
Naive Bayes Presentation
Decision trees in Machine Learning
Data preprocessing using Machine Learning
Bayesian networks
Maximum likelihood estimation
Support Vector Machines
Principal Component Analysis
Data mining techniques unit 1
Lecture9 - Bayesian-Decision-Theory
Dimensionality Reduction
Fuzzy Set
Bayesian Linear Regression.pptx
K-Folds Cross Validation Method
Support Vector Machines
Machine Learning - Splitting Datasets
Machine Learning
Naive Bayes
Ad

Similar to Bayesian classification (20)

PDF
exercises.pdf
PDF
Bill howe 6_machinelearning_1
PPT
Introduction to Probability and Probability Distributions
PPTX
analytical representation of data
PPTX
7. PROBABILITY GRADE 7 TOPICS QUARTER 4.pptx
PDF
Quantitative Analysis For Management 11th Edition Render Solutions Manual
PDF
Statistics Slides.pdf
PPT
MMC Math 2009
PPTX
probability.pptx
PDF
Recursion (in Python)
PPT
ch04sdsdsdsdsdsdsdsdsdsdswewrerertrtr.ppt
DOC
artficial intelligence
DOC
Math 221 Massive Success / snaptutorial.com
PPTX
Data Handling
PDF
LQ4_LE_Mathematics-7_Lesson-7_Week-7.pdf
DOCX
Math 235 - Summer 2015Homework 2Due Monday June 8 in cla.docx
PDF
Quantitative Analysis For Management 11th Edition Render Test Bank
DOC
352735322 rsh-qam11-tif-02-doc
DOC
352735322 rsh-qam11-tif-02-doc
DOCX
UMUC Biology 102103Lab 7 Ecology of OrganismsINSTRUCTIONS · T.docx
exercises.pdf
Bill howe 6_machinelearning_1
Introduction to Probability and Probability Distributions
analytical representation of data
7. PROBABILITY GRADE 7 TOPICS QUARTER 4.pptx
Quantitative Analysis For Management 11th Edition Render Solutions Manual
Statistics Slides.pdf
MMC Math 2009
probability.pptx
Recursion (in Python)
ch04sdsdsdsdsdsdsdsdsdsdswewrerertrtr.ppt
artficial intelligence
Math 221 Massive Success / snaptutorial.com
Data Handling
LQ4_LE_Mathematics-7_Lesson-7_Week-7.pdf
Math 235 - Summer 2015Homework 2Due Monday June 8 in cla.docx
Quantitative Analysis For Management 11th Edition Render Test Bank
352735322 rsh-qam11-tif-02-doc
UMUC Biology 102103Lab 7 Ecology of OrganismsINSTRUCTIONS · T.docx
Ad

Recently uploaded (20)

PDF
168300704-gasification-ppt.pdfhghhhsjsjhsuxush
PDF
“Getting Started with Data Analytics Using R – Concepts, Tools & Case Studies”
PPTX
Business Acumen Training GuidePresentation.pptx
PPTX
Supervised vs unsupervised machine learning algorithms
PPT
Miokarditis (Inflamasi pada Otot Jantung)
PPTX
1_Introduction to advance data techniques.pptx
PPTX
Introduction to machine learning and Linear Models
PPTX
Database Infoormation System (DBIS).pptx
PPTX
Introduction-to-Cloud-ComputingFinal.pptx
PPTX
AI Strategy room jwfjksfksfjsjsjsjsjfsjfsj
PDF
Lecture1 pattern recognition............
PPTX
Introduction to Knowledge Engineering Part 1
PPTX
Introduction to Basics of Ethical Hacking and Penetration Testing -Unit No. 1...
PPT
ISS -ESG Data flows What is ESG and HowHow
PPT
Quality review (1)_presentation of this 21
PPTX
Data_Analytics_and_PowerBI_Presentation.pptx
PDF
Foundation of Data Science unit number two notes
PDF
Galatica Smart Energy Infrastructure Startup Pitch Deck
PPTX
Microsoft-Fabric-Unifying-Analytics-for-the-Modern-Enterprise Solution.pptx
PDF
Recruitment and Placement PPT.pdfbjfibjdfbjfobj
168300704-gasification-ppt.pdfhghhhsjsjhsuxush
“Getting Started with Data Analytics Using R – Concepts, Tools & Case Studies”
Business Acumen Training GuidePresentation.pptx
Supervised vs unsupervised machine learning algorithms
Miokarditis (Inflamasi pada Otot Jantung)
1_Introduction to advance data techniques.pptx
Introduction to machine learning and Linear Models
Database Infoormation System (DBIS).pptx
Introduction-to-Cloud-ComputingFinal.pptx
AI Strategy room jwfjksfksfjsjsjsjsjfsjfsj
Lecture1 pattern recognition............
Introduction to Knowledge Engineering Part 1
Introduction to Basics of Ethical Hacking and Penetration Testing -Unit No. 1...
ISS -ESG Data flows What is ESG and HowHow
Quality review (1)_presentation of this 21
Data_Analytics_and_PowerBI_Presentation.pptx
Foundation of Data Science unit number two notes
Galatica Smart Energy Infrastructure Startup Pitch Deck
Microsoft-Fabric-Unifying-Analytics-for-the-Modern-Enterprise Solution.pptx
Recruitment and Placement PPT.pdfbjfibjdfbjfobj

Bayesian classification

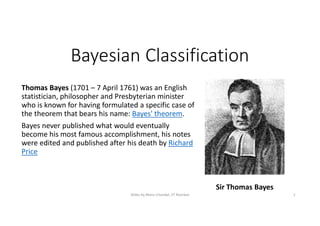
  • 1. Bayesian Classification Thomas Bayes (1701 – 7 April 1761) was an English statistician, philosopher and Presbyterian minister who is known for having formulated a specific case of the theorem that bears his name: Bayes' theorem. Bayes never published what would eventually become his most famous accomplishment, his notes were edited and published after his death by Richard Price Sir Thomas Bayes Slides by Manu Chandel, IIT Roorkee 1
  • 2. Bayes Theorem Total Probability Bayes Theorem E1 E2 E3 …………………………… EN A 1. A is a outcome which can result from all the events E1, E2, ………… EN 2. All the events E1, E2, E3………. EN are mutually exclusive and exhaustive Slides by Manu Chandel, IIT Roorkee 2
  • 3. Bayes Theorem Example Q. Given two bags each one having red and white balls. Both bags have equal chance of being chosen. If a ball is picked at random and found to be Red, what is the probability that the ball was chosen from bag A? Ans. Total probability of Red Ball = = = Probability that red ball was from Bag A ∗ ( ) = Slides by Manu Chandel, IIT Roorkee 3
  • 4. Discriminative v/s Generative classifiers For a prediction function Discriminative classifiers estimate directly from the training data Generative classifiers estimate and directly from the training data. Naïve Bayes Classifier is a generative classifier Slides by Manu Chandel, IIT Roorkee 4
  • 5. MAP Classification Rule Maximum A Posterior rule says that : “Jiski lathi uski bhains “ Input data belongs to the class whose is highest. Example : Suppose a news article is to be classified into following three categories: a) Politics b) Finance and c) Sports. So, X is our news article and three categories are denoted by Y1, Y2 and Y3 . Lets say , , then according to MAP classification rule news article will be classified into category 2 i.e. finance. Slides by Manu Chandel, IIT Roorkee 5
  • 6. Naïve Bayes (Discrete values) An input to the classifier is often a feature vector containing various feature values e.g. A news article input to a news article classifier may be a vector of words. In Bayes classification we need to learn and from the given data. Here is feature vector with as feature values. Learning joint probability ( , ,…… , ) is difficult. Hence Naïve Bayes assumes that features are independent of each other. Assuming independence of features leads to ( , ,…… , ) Slides by Manu Chandel, IIT Roorkee 6
  • 7. Naïve Bayes Algorithm (with Example) Learning phase of Naïve Bayes is represented by an example. Classifier needs to learn and for all Y Sr Year Height Pocket Money Grade Single 1 1 Average Low High Yes 2 2 Tall Average Low No 3 3 Short High High No 4 4 Average Average Low No 5 2 Tall High Low Yes 6 3 Tall Low High No 7 3 Average High Average Yes 8 1 Tall Average Average Yes 9 4 Short Average High Yes Data collected anonymously from BTECH Students IITR. Slides by Manu Chandel, IIT Roorkee 7
  • 8. Naïve Bayes (Learning Phase ) Year ( = ) ( = ) 1 2/5 0 2 1/5 1/4 3 1/5 2/4 4 1/5 1/4 Height ( = ) ( = ) Tall 2/5 2/4 Short 1/5 1/4 Average 2/5 1/4 PM ( = ) ( = ) High 2/5 1/4 Low 1/5 1/4 Average 2/5 2/4 Grade ( = ) ( = ) High 2/5 2/4 Low 1/5 2/4 Average 2/5 0 Slides by Manu Chandel, IIT Roorkee 8
  • 9. Naïve Bayes (Testing Phase) What will be the outcome of X= <4,Tall,Average,High> ? = = 4 ∗ = ∗ = ∗ = ∗ ( = ) = 1/5 * 2/5 * 2/5 * 2/5*5/9 = 0.00711 = = 4 ∗ = ∗ = ∗ = ∗ ( = ) = 1/4 * 2/4 * 2/4 * 2/4*4/9 = 0.0138 As 0.0138 > 0.00711 then X will be classified as Single = No Slides by Manu Chandel, IIT Roorkee 9
  • 10. Naïve Bayes (Continuous Values ) Conditional probability often modeled with the normal distribution = = 1 2   exp(− ( − ) 2 ) = mean of feature values of = = standard deviation of feature values of = Learning Phase For = , , … … , = , , … . output Normal distributions. Test Phase Given an unknown instance = , , … . . , • Instead of looking-up tables, calculate conditional probabilities with all the normal distributions achieved in the learning phrase • Apply the MAP rule to make a decision Slides by Manu Chandel, IIT Roorkee 10
  • 11. Naïve Bayes Continuous Value Example • Temperature is naturally of continuous value. • Yes: 25.2, 19.3, 18.5, 21.7, 20.1, 24.3, 22.8, 23.1, 19.8 • No: 27.3, 30.1, 17.4, 29.5, 15.1 • Estimate mean and variance for each class • and • • Learning phase output two Gaussian models for • .   ( . ) . • .   ( . ) . Slides by Manu Chandel, IIT Roorkee 11
  • 12. Relevant Issues 1. Violation of independence Assumption 2. Zero Conditional Probability Problem If no example contains a feature value In this circumstances This can be solved by Slides by Manu Chandel, IIT Roorkee 12
  • 13. Underflow Prevention • Multiplying lots of probabilities, which are between 0 and 1 by definition, can result in floating-point underflow. • Since it is better to perform all computations by summing logs of probabilities rather than multiplying probabilities. • Class with highest final un-normalized log probability score is still the most probable. Slides by Manu Chandel, IIT Roorkee 13
  • 14. Summary • Naïve Bayes: the conditional independence assumption • Training is very easy and fast, just requiring considering each attribute in each class separately. • Test is straightforward, just looking up tables or calculating conditional probabilities with estimated distributions. • A popular generative model • Performance competitive to most of state-of-the-art classifiers even in presence of violating independence assumption. • Many successful applications, e.g., spam mail filtering Slides by Manu Chandel, IIT Roorkee 14