Ch10.애플리케이션 서버의 병목_발견_방법
Download as PPTX, PDF13 likes2,309 views

Thread dumps provide snapshots of a Java application's threads and their states. When a slowdown occurs, get multiple thread dumps over time to analyze thread activity and identify potential issues like: 1) Lock contention between threads waiting to enter synchronized methods or blocks. 2) Deadlocks from circular wait conditions that can hang applications. 3) Threads waiting for I/O responses from databases or networks. 4) High CPU usage by specific threads as shown through monitoring tools. Analyzing thread dumps helps locate performance bottlenecks and fix synchronization, resource contention, or inefficient code issues degrading application speed.


![Slow down in WAS & User AP
• Thread dump
– It displays all of thread state by “THREAD STACK”
"ExecuteThread: '42' for queue: 'default'" daemon prio=5 tid=0x3504b0 nid=0x34 runnable
[0x9607e000..0x9607fc68]
at java.net.SocketInputStream.read(SocketInputStream.java:85)
at oracle.net.ns.Packet.receive(Unknown Source)
at oracle.net.ns.NetInputStream.getNextPacket(Unknown Source)
at oracle.net.ns.NetInputStream.read(Unknown Source)
at oracle.net.ns.NetInputStream.read(Unknown Source)
at oracle.net.ns.NetInputStream.read(Unknown Source)
at oracle.jdbc.ttc7.MAREngine.unmarshalUB1(MAREngine.java:730)
at oracle.jdbc.ttc7.MAREngine.unmarshalSB1(MAREngine.java:702)
at oracle.jdbc.ttc7.Oall7.receive(Oall7.java:373)
at oracle.jdbc.ttc7.TTC7Protocol.doOall7(TTC7Protocol.java:1427)
at oracle.jdbc.ttc7.TTC7Protocol.fetch(TTC7Protocol.java:911)
at oracle.jdbc.driver.OracleStatement.doExecuteQuery(OracleStatement.java:1948)
at oracle.jdbc.driver.OracleStatement.doExecuteWithTimeout(OracleStatement.java:2137)
at oracle.jdbc.driver.OraclePreparedStatement.executeUpdate(OraclePreparedStatement.java:404)
at oracle.jdbc.driver.OraclePreparedStatement.executeQuery(OraclePreparedStatement.java:344)
at weblogic.jdbc.pool.PreparedStatement.executeQuery(PreparedStatement.java:51)
at weblogic.jdbc.rmi.internal.PreparedStatementImpl.executeQuery(PreparedStatementImpl.java:56)
Thread name Thread id (signature)Thread State
Program stack of this thread
Sun JVM](https://image.slidesharecdn.com/ch10-150518113459-lva1-app6892/85/Ch10-_-_-9-320.jpg)


![Slow down in WAS & User AP
• CASE 1. Lock contention : Thread dump example
"ExecuteThread: '12' for queue: 'weblogic.kernel.Default'" daemon prio=10 tid=0x0055ae20 nid=23
lwp_id=3722788 waiting for monitor entry [0x2fb6e000..0x2fb6d530]
:
at java.lang.ClassLoader.loadClass(ClassLoader.java:255)
:
at org.apache.xerces.jaxp.SAXParserFactoryImpl.newSAXParser(Unknown Source)
at org.apache.axis.utils.XMLUtils.getSAXParser(XMLUtils.java:252)
- locked <0x329fcf50> (a java.lang.Class)
"ExecuteThread: '13' for queue: 'weblogic.kernel.Default'" daemon prio=10 tid=0x0055bde0 nid=24
lwp_id=3722789 waiting for monitor entry [0x2faec000..0x2faec530]
at org.apache.axis.utils.XMLUtils.getSAXParser(XMLUtils.java:247)
- waiting to lock <0x329fcf50> (a java.lang.Class)
:
"ExecuteThread: '15' for queue: 'weblogic.kernel.Default'" daemon prio=10 tid=0x0061dc20 nid=26
lwp_id=3722791 waiting for monitor entry [0x2f9ea000..0x2f9ea530]
at org.apache.axis.utils.XMLUtils.releaseSAXParser(XMLUtils.java:283)
- waiting to lock <0x329fcf50> (a java.lang.Class)
at](https://image.slidesharecdn.com/ch10-150518113459-lva1-app6892/85/Ch10-_-_-13-320.jpg)


![Slow down in WAS & User AP
• CASE 3. Wait for IO Response
"ExecuteThread: '42' for queue: 'default'" daemon prio=5 tid=0x3504b0 nid=0x34 runnable [0x9607e000..0x9607fc68]
at java.net.SocketInputStream.socketRead(Native Method)
at java.net.SocketInputStream.read(SocketInputStream.java:85)
at oracle.net.ns.Packet.receive(Unknown Source)
at oracle.net.ns.NetInputStream.getNextPacket(Unknown Source)
at oracle.net.ns.NetInputStream.read(Unknown Source)
at oracle.net.ns.NetInputStream.read(Unknown Source)
at oracle.net.ns.NetInputStream.read(Unknown Source)
at oracle.jdbc.ttc7.MAREngine.unmarshalUB1(MAREngine.java:730)
at oracle.jdbc.ttc7.MAREngine.unmarshalSB1(MAREngine.java:702)
at oracle.jdbc.ttc7.Oall7.receive(Oall7.java:373)
at oracle.jdbc.ttc7.TTC7Protocol.doOall7(TTC7Protocol.java:1427)
at oracle.jdbc.ttc7.TTC7Protocol.fetch(TTC7Protocol.java:911)
at oracle.jdbc.driver.OracleStatement.doExecuteQuery(OracleStatement.java:1948)
at oracle.jdbc.driver.OracleStatement.doExecuteWithTimeout(OracleStatement.java:2137)
at oracle.jdbc.driver.OraclePreparedStatement.executeUpdate(OraclePreparedStatement.java:404)
at oracle.jdbc.driver.OraclePreparedStatement.executeQuery(OraclePreparedStatement.java:344)
at weblogic.jdbc.pool.PreparedStatement.executeQuery(PreparedStatement.java:51)
at weblogic.jdbc.rmi.internal.PreparedStatementImpl.executeQuery(PreparedStatementImpl.java:56)
at weblogic.jdbc.rmi.SerialPreparedStatement.executeQuery(SerialPreparedStatement.java:42)
at com.XXXX 생략
at ……..](https://image.slidesharecdn.com/ch10-150518113459-lva1-app6892/85/Ch10-_-_-19-320.jpg)


Ch10.애플리케이션 서버의 병목_발견_방법
- 1. <대용량 아키텍처와 성능 튜닝> CH.10 애플리케이션 서버 의 병목 발견 방법 아꿈사 스터디 2015.5.16 정민철(ccc612@gmail.com)
- 2. 자바 서버 애플리케이션 구조 User AP WAS JVM RDBMS Web Server Client Network
- 3. 현상 및 튜닝 개요 Hang up: 실행되고 있으나 응답이 없는 상태 Slow down: 응답시간이 급격히 떨어지는 상태 동작을 위한 구성 요소 중 하나 이상의 병목으로 발생 튜닝: 병목 구간 발견 => 제거
- 4. 애플리케이션 서버의 기본 구조 WebServer OR Browser OR Client Dispatcher Request Queue Thread Pool Connection Pool Thread Queue JMS Thread Queue APP1 Thread Queue APP2 Thread Queue Other Resources Connector Working Thread Idle Thread Queue + Thread Pool
- 5. 애플리케이션 서버의 기본 구조 Thread Pooling Thread를 미리 생성해 pool에 저장 필요 시 꺼내서 사용 업무의 성격에 따라 Thread pool 나눠서 운영 장점 업무 부하에 따라 각 pool의 thread 수 조정 가능 문제가 생겨도 다른 업무에 영향이 없음
- 6. 죄송합니다 여기부터는 Copy & Paste from here
- 7. 쓰레드 덤프 • Thread dump – Snapshot of java ap (X-ray) – We can recognize thread running tread state by “continuous thread dump”
- 8. Slow down in WAS & User AP • Getting Thread Dump – Unix : kill –3 pid , Windows : Ctrl + Break – Get thread dump about 3~5 times between 3~5secs Threads Time Working thread Thread dump
- 9. Slow down in WAS & User AP • Thread dump – It displays all of thread state by “THREAD STACK” "ExecuteThread: '42' for queue: 'default'" daemon prio=5 tid=0x3504b0 nid=0x34 runnable [0x9607e000..0x9607fc68] at java.net.SocketInputStream.read(SocketInputStream.java:85) at oracle.net.ns.Packet.receive(Unknown Source) at oracle.net.ns.NetInputStream.getNextPacket(Unknown Source) at oracle.net.ns.NetInputStream.read(Unknown Source) at oracle.net.ns.NetInputStream.read(Unknown Source) at oracle.net.ns.NetInputStream.read(Unknown Source) at oracle.jdbc.ttc7.MAREngine.unmarshalUB1(MAREngine.java:730) at oracle.jdbc.ttc7.MAREngine.unmarshalSB1(MAREngine.java:702) at oracle.jdbc.ttc7.Oall7.receive(Oall7.java:373) at oracle.jdbc.ttc7.TTC7Protocol.doOall7(TTC7Protocol.java:1427) at oracle.jdbc.ttc7.TTC7Protocol.fetch(TTC7Protocol.java:911) at oracle.jdbc.driver.OracleStatement.doExecuteQuery(OracleStatement.java:1948) at oracle.jdbc.driver.OracleStatement.doExecuteWithTimeout(OracleStatement.java:2137) at oracle.jdbc.driver.OraclePreparedStatement.executeUpdate(OraclePreparedStatement.java:404) at oracle.jdbc.driver.OraclePreparedStatement.executeQuery(OraclePreparedStatement.java:344) at weblogic.jdbc.pool.PreparedStatement.executeQuery(PreparedStatement.java:51) at weblogic.jdbc.rmi.internal.PreparedStatementImpl.executeQuery(PreparedStatementImpl.java:56) Thread name Thread id (signature)Thread State Program stack of this thread Sun JVM
- 10. Slow down in WAS & User AP • How to analysis thread dump MYTHREAD_RUN(){ 1 call methodA(); } methodA(){ //doSomething(); 2 call methodB(); } methodB(){ //call methodC(); 3 } methodC(){ // doSomething 4 for(;;){// infinite loop } 5 } “MYTHREAD” runnable 1 at …MYTHREAD_RUN() : “MYTHREAD” runnable 2 at …methodA() at …MYTHREAD_RUN() : “MYTHREAD” runnable 3 at …methodB() at …methodA() at …MYTHREAD_RUN() : “MYTHREAD” runnable 4 at …methodC() at …methodB() at …methodA() at …MYTHREAD_RUN() : “MYTHREAD” runnable at …methodC() at …methodB() at …methodA() at …MYTHREAD_RUN() : 계속 이모양이 반복됨 Source code Thread dumps
- 11. Slow down in WAS & User AP • CASE 1. Lock contention – In the java application java thread wait for lock in synchronized method – Occurred in multi threaded program – Reduce frequency of synchronized method – Synchronized block must be implemented to be end as soon as possible (※ IO? ) public void synchronized methodA(Object param) { //do something while(1){} } < sample code >
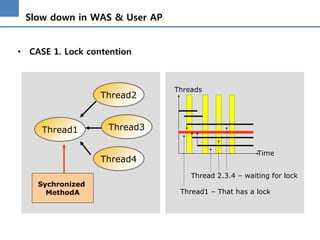
- 12. Slow down in WAS & User AP • CASE 1. Lock contention Thread1 Thread3 Thread2 Thread4 Sychronized MethodA Threads Time Thread1 – That has a lock Thread 2.3.4 – waiting for lock
- 13. Slow down in WAS & User AP • CASE 1. Lock contention : Thread dump example "ExecuteThread: '12' for queue: 'weblogic.kernel.Default'" daemon prio=10 tid=0x0055ae20 nid=23 lwp_id=3722788 waiting for monitor entry [0x2fb6e000..0x2fb6d530] : at java.lang.ClassLoader.loadClass(ClassLoader.java:255) : at org.apache.xerces.jaxp.SAXParserFactoryImpl.newSAXParser(Unknown Source) at org.apache.axis.utils.XMLUtils.getSAXParser(XMLUtils.java:252) - locked <0x329fcf50> (a java.lang.Class) "ExecuteThread: '13' for queue: 'weblogic.kernel.Default'" daemon prio=10 tid=0x0055bde0 nid=24 lwp_id=3722789 waiting for monitor entry [0x2faec000..0x2faec530] at org.apache.axis.utils.XMLUtils.getSAXParser(XMLUtils.java:247) - waiting to lock <0x329fcf50> (a java.lang.Class) : "ExecuteThread: '15' for queue: 'weblogic.kernel.Default'" daemon prio=10 tid=0x0061dc20 nid=26 lwp_id=3722791 waiting for monitor entry [0x2f9ea000..0x2f9ea530] at org.apache.axis.utils.XMLUtils.releaseSAXParser(XMLUtils.java:283) - waiting to lock <0x329fcf50> (a java.lang.Class) at
- 14. Slow down in WAS & User AP • CASE 2. Dead lock – CWC “Circular waiting condition” – Commonly it makes WAS hang up – Remove CWC by changing lock direction – Some kind of JVM detects dead lock automatically sychronized methodA(){ call methodB(); } sychronized methodB(){ call methodC(); } sychronized methodC(){ call methodA(); } < sample code >
- 15. Slow down in WAS & User AP • CASE 2. Dead lock Thread1 Sychronized MethodA Thread2 Sychronized MethodB Thread3 Sychronized MethodC Threads Time Thread 1 Thread 2 Thread 3 Circular waiting condition
- 16. Slow down in WAS & User AP • CASE 2. Dead lock FOUND A JAVA LEVEL DEADLOCK: ---------------------------- "ExecuteThread: '12' for queue: 'default'": waiting to lock monitor 0xf96e0 (object 0xbd2e1a20, a weblogic.servlet.jsp.JspStub), which is locked by "ExecuteThread: '5' for queue: 'default'" "ExecuteThread: '5' for queue: 'default'": waiting to lock monitor 0xf8c60 (object 0xbd9dc460, a weblogic.servlet.internal.WebAppServletContext), which is locked by "ExecuteThread: '12' for queue: 'default'" JAVA STACK INFORMATION FOR THREADS LISTED ABOVE: ------------------------------------------------ Java Stack for "ExecuteThread: '12' for queue: 'default'": ========== at weblogic.servlet.internal.ServletStubImpl.destroyServlet(ServletStubImpl.java:434) - waiting to lock <bd2e1a20> (a weblogic.servlet.jsp.JspStub) at weblogic.servlet.internal.WebAppServletContext.removeServletStub(WebAppServletContext.java:2377) at weblogic.servlet.jsp.JspStub.prepareServlet(JspStub.java:207) : Java Stack for "ExecuteThread: '5' for queue: 'default'": ========== at weblogic.servlet.internal.WebAppServletContext.removeServletStub(WebAppServletContext.java:2370) at weblogic.servlet.jsp.JspStub.prepareServlet(JspStub.java:207) at weblogic.servlet.jsp.JspStub.prepareServlet(JspStub.java:154) - locked <bd2e1a20> (a weblogic.servlet.jsp.JspStub) at weblogic.servlet.internal.ServletStubImpl.getServlet(ServletStubImpl.java:368) : Found 1 deadlock.======================================================== Deadlock auto detect in Sun JVM
- 17. Slow down in WAS & User AP • CASE 2. Dead lock "ExecuteThread-6" (TID:0x30098180, sys_thread_t:0x39658e50, state:MW, native ID:0xf10) prio=5 at oracle.jdbc.driver.OracleStatement.close(OracleStatement.java(Compiled Code)) at weblogic.jdbc.common.internal.ConnectionEnv.cleanup(ConnectionEnv.java(Compiled : "ExecuteThread-8" (TID:0x30098090, sys_thread_t:0x396eb890, state:MW, native ID:0x1112) prio=5 at oracle.jdbc.driver.OracleConnection.commit(OracleConnection.java(Compiled Code)) at weblogic.jdbcbase.pool.Connection.commit(Connection.java(Compiled Code)) : sys_mon_t:0x39d75b38 infl_mon_t: 0x39d6e288: oracle.jdbc.driver.OracleConnection@310BC380/310BC388: owner "ExecuteThread-8" (0x396eb890) 1 entry 1) Waiting to enter: "ExecuteThread-10" (0x3977e2d0) "ExecuteThread-6" (0x39658e50) sys_mon_t:0x39d75bb8 infl_mon_t: 0x39d6e2a8: oracle.jdbc.driver.OracleStatement@33AA1BD0/33AA1BD8: owner "ExecuteThread-6" (0x39658e50) 1 entry 2) Waiting to enter: "ExecuteThread-8" (0x396eb890 Deadlock trace in AIX JVM
- 18. Slow down in WAS & User AP • CASE 3. Wait for IO Response – Situation in waiting for IO response (DB,Network) – Commonly occurred caused by DB locking or slow response Threads Time Wait for IO response
- 19. Slow down in WAS & User AP • CASE 3. Wait for IO Response "ExecuteThread: '42' for queue: 'default'" daemon prio=5 tid=0x3504b0 nid=0x34 runnable [0x9607e000..0x9607fc68] at java.net.SocketInputStream.socketRead(Native Method) at java.net.SocketInputStream.read(SocketInputStream.java:85) at oracle.net.ns.Packet.receive(Unknown Source) at oracle.net.ns.NetInputStream.getNextPacket(Unknown Source) at oracle.net.ns.NetInputStream.read(Unknown Source) at oracle.net.ns.NetInputStream.read(Unknown Source) at oracle.net.ns.NetInputStream.read(Unknown Source) at oracle.jdbc.ttc7.MAREngine.unmarshalUB1(MAREngine.java:730) at oracle.jdbc.ttc7.MAREngine.unmarshalSB1(MAREngine.java:702) at oracle.jdbc.ttc7.Oall7.receive(Oall7.java:373) at oracle.jdbc.ttc7.TTC7Protocol.doOall7(TTC7Protocol.java:1427) at oracle.jdbc.ttc7.TTC7Protocol.fetch(TTC7Protocol.java:911) at oracle.jdbc.driver.OracleStatement.doExecuteQuery(OracleStatement.java:1948) at oracle.jdbc.driver.OracleStatement.doExecuteWithTimeout(OracleStatement.java:2137) at oracle.jdbc.driver.OraclePreparedStatement.executeUpdate(OraclePreparedStatement.java:404) at oracle.jdbc.driver.OraclePreparedStatement.executeQuery(OraclePreparedStatement.java:344) at weblogic.jdbc.pool.PreparedStatement.executeQuery(PreparedStatement.java:51) at weblogic.jdbc.rmi.internal.PreparedStatementImpl.executeQuery(PreparedStatementImpl.java:56) at weblogic.jdbc.rmi.SerialPreparedStatement.executeQuery(SerialPreparedStatement.java:42) at com.XXXX 생략 at ……..
- 20. Slow down in WAS & User AP • CASE 4. High CPU usage – When monitoring CPU usage by top,glance. WAS process consumes a lot of CPU - almost 90~100% – Find it using tools below • Sun : prstat,pstack,thread dump • AIX : ps –mp,dbx,thread dump • HP : glance,thread dump • See a document “How to find bottleneck in J2EE application “ in http://www.j2eestudy.co.kr
- 21. Slow down in WAS & User AP • CASE 4. High CPU usage – Example in HP UX HP glance 1. Start “glance” 2. Press “G” and enter the WAS PID 3. Find the TID that consumes a lot of CPU resource 4. Get a thread dump 5. Find the thread in Thread dump that has a matched LWID with this TID 6. And find the reason and fix it
- 22. Slow down in WAS & User AP • Summarize – Thread dump is snapshot of Java Application. – If u meet a slowdown situation, Get a thread dump. – Analysis thread dump. – And fix it..