SlideShare a Scribd company logo
Rohit KelapureIBM Advisory Software Engineer 29 September 2011Server Resiliency - Debugging Java deployments
Introduction to Speaker – Rohit KelapureResponsible for the resiliency of  WebSphere Application ServerTeam Lead and architect of Caching & Data replication features in WebSphereCalled upon to hose down fires & resolve critical situationsCustomer advocate for large banks Active blogger All Things WebSphereApache Open Web Beans committer Java EE, OSGI & Spring Developerkelapure@us.ibm.comkelapure@gmail.comLinkedinhttp://twitter.com/#!/rkela2
Important DisclaimersTHE INFORMATION CONTAINED IN THIS PRESENTATION IS PROVIDED FOR INFORMATIONAL PURPOSES ONLY. WHILST EFFORTS WERE MADE TO VERIFY THE COMPLETENESS AND ACCURACY OF THE INFORMATION CONTAINED IN THIS PRESENTATION, IT IS PROVIDED “AS IS”, WITHOUT WARRANTY OF ANY KIND, EXPRESS OR IMPLIED. ALL PERFORMANCE DATA INCLUDED IN THIS PRESENTATION HAVE BEEN GATHERED IN A CONTROLLED ENVIRONMENT.  YOUR OWN TEST RESULTS MAY VARY BASED ON HARDWARE, SOFTWARE OR INFRASTRUCTURE DIFFERENCES.ALL DATA INCLUDED IN THIS PRESENTATION ARE MEANT TO BE USED ONLY AS A GUIDE.IN ADDITION, THE INFORMATION CONTAINED IN THIS PRESENTATION IS BASED ON IBM’S CURRENT PRODUCT PLANS AND STRATEGY, WHICH ARE SUBJECT TO CHANGE BY IBM, WITHOUT NOTICE. IBM AND ITS AFFILIATED COMPANIES SHALL NOT BE RESPONSIBLE FOR ANY DAMAGES ARISING OUT OF THE USE OF, OR OTHERWISE RELATED TO, THIS PRESENTATION OR ANY OTHER DOCUMENTATION. NOTHING CONTAINED IN THIS PRESENTATION IS INTENDED TO, OR SHALL HAVE THE EFFECT OF: - CREATING ANY WARRANT OR REPRESENTATION FROM IBM, ITS AFFILIATED COMPANIES OR ITS OR THEIR SUPPLIERS AND/OR LICENSORS3
Copyright and Trademarks© IBM Corporation 2011. All Rights Reserved. IBM, the IBM logo, and ibm.com are trademarks or registered trademarks of International Business Machines Corp., and registered in many jurisdictions worldwide. Other product and service names might be trademarks of IBM or other companies. A current list of IBM trademarks is available on the Web – see the IBM “Copyright and trademark information” page at URL:  www.ibm.com/legal/copytrade.shtml4
OutlineServer Resiliency FundamentalsCommon JVM ProblemsProtecting your JVMHung thread detection, Thread Interruption, Thread hang recoveryMemory leak detection, protection & actionScenario based problem resolutionToolingEclipse Memory AnalyzerThread Dump AnalyzerGarbage Collection and Memory Visualizer5
ResiliencyProperty of a material that can absorb external energy when it is forced to deform elastically, and then be able to recover to its original form and release the energy6
Server Resiliency Concepts7October 4, 2011Explicit MessagingDistributed Shared memory – Better ConsistencyMessage Passing – Loose CouplingUniform InterfaceE.g. World Wide WebBetter scalability, reusability and reliability Data, process and other forms of computations identified by one mechanism Semantics of operations in messages for operating on the data are unifiedSelf ManagementComposed of self-managing components.Managed element, managers, sensors & effectorse.g. TCP/IP Congestion ControlRedundancy (Data and processing)Create ReplicasHigh cost of initialization and reconfigurationRedundant elements need to be synchronized from time to timePartitionSplitting the data into smaller pieces and storing them in distributed fashionAllows for parallelization & divide and conquerPartial failure isolationVirtualizationFunctionalities of processing and data element virtualized as a serviceLoose coupling between system and consumed servicesIntegration by enforcing explicitly boundary and schema-based interfacesDecentralized Control High communication overhead of centralized control for a system of heavy redundancySometimes trapped in locally optimized solutionsFixing issues requires shutting down the entire system e.g. AWS outage
Most common JVM Problem Scenarios8October 4, 2011
Thread HangsThreading and synchronization issues are among the top 5 application performance challengestoo aggressive with shared resources causes data inconsistenciestoo conservative leads to too much contention between threads Application unresponsiveness Adding users / threads /CPUs causes app slow down (less throughput, worse response)High lock acquire times & contentionRace conditions, deadlock, I/O under lockTooling is needed to rescue applications and the JVM from itself Identify these conditions If possible remedy them in the short term for server resiliency9October 4, 2011
JVM Hung Thread Detection Every X seconds  an alarm thread wakes up and iterates over all managed thread pools. Subtract the "start time" of the thread from the current time, and passes it to a monitor. Detection policy then determines based on the available data if the thread is hung Print stack trace of the hung thread10October 4, 2011
Thread Interruption 101 Thread.stop stops thread by throwing ThreadDeath exception * DeprecatedThread.interrupt():  Cooperative mechanism for a thread to signal another thread that it should, at its convenience and if it feels like it, stop what it is doing and do something else.Interruption is usually the most sensible way to implement task cancellation. Because each thread has its own interruption policy, you should not interrupt a thread unless you know what interruption means to that thread.Any method sensing interruption shouldAssume current task is cancelled & perform some task‐specific cleanupExit as quickly and cleanly as possible ensuring that callers are aware of cancellation Propagate the exception, making your method an interruptible blocking method, to throw new InterruptedException()Restore the interruption status so that code higher up on the call stack can deal with it Thread.currentThread().interrupt()Only code that implements a thread's interruption policy may swallow an interruption request. 11October 4, 2011
Interrupting threads12
13October 5, 2011CancellingThreads
Dealing with Non‐interruptible BlockingMany blocking library methods respond to interruption by returning early and throwing InterruptedExceptionMakes it easier to build tasks that are responsive to cancellation Lock.lockInterruptiblyThread.sleep,Thread.waitThread.notifyThread.joinNot all blocking methods or blocking mechanisms are responsive to interruptionif a thread is blocked performing synchronous socket I/O, interruption has no effect other than setting the thread's interrupted statusIf a thread is blocked waiting for an intrinsic lock, there is nothing you can do to stop short of ensuring that it eventually acquires the lock14October 4, 2011
Thread Hang Recovery – Technique Application specific hacks for thread hang recoveryByte code instrumentationTransform the concrete subclasses of the abstract classes InputStream& OutputStreamto make the socket I/O operations interruptible. Transform an application class so that every loop can be interrupted by invoking Interrupter.interrupt(Thread, boolean)Transform a monitorenter instruction and a monitorexit instruction so that the wait at entering into a monitor is interruptiblehttp://www.ibm.com/developerworks/websphere/downloads/hungthread.html15
Memory LeaksLeaks come in various types, such asMemory leaksThread and ThreadLocal leaksClassLoader leaksSystem resource leaks Connection leaksCustomers want to increase application uptime without cycling the server. Frequent application restarts without stopping the server.Frequent redeployments of the application result in OOM errors What do we have today Offline post-mortem analysis of a JVM heap. Tools like Jrockit Mission Control, MAT. IEMA are the IBM Extensions for Memory AnalyzerRuntime memory leak detection using JVMTI and PMI (Runtime Performance Advisor)We don’t have application level i.e. top down memory leak detection and protectionLeak detection by looking at suspect patterns in application code16October 4, 2011
ClassLoader Leaks 101A class is uniquely identified byIts name + The class loader that loaded itClass with the same name can be loaded multiple times in a single JVM, each in a different class loaderWeb containers use this for isolating web applicationsEach web application gets its own class loaderReference ChainAn object retains a reference to the class it is an instance ofA class retains a reference to the class loader that loaded itThe class loader retains a reference to every class it loadedRetaining a reference to a single object from a web application pins every class loaded by the web applicationThese references often remain after a web application reload With each reload, more classes get pinned ultimately leading to an OOM17October 4, 2011
Tomcat pioneered approach - Leak Prevention JRE triggered leak Singleton / static initializerCan be a ThreadSomething that won’t get garbage collectedRetains a reference to the context class loader when loadedIf web application code triggers the initializationThe context class loader will be web application class loaderA reference is created to the web application class loaderThis reference is never garbage collectedPins the class loader (and hence all the classes it loaded) in memoryPrevention with a DeployedObjectListenerCalling various parts of the Java API that are known to retain a reference to the current context class loaderInitialize these singletons when the Application Server’s class loader is the context class loader18October 5, 2011
Leak DetectionApplication Triggered LeaksClassLoader ThreadsThreadLocal JDBC DriversNon ApplicationRMI TargetsResource BundleStatic final referencesInstrospectionUtilsLoggersPreventionCode executes when a web application is stopped, un-deployed or reloadedCheck, via a combination of standard API calls and some reflection tricks, for known causes of memory leaks19October 4, 2011
Memory leak detection console20October 4, 2011
What is wrong with my application  …?Why does my application run slow every time I do X ?Why does my application have erratic response times ?  Why am I getting Out of Memory Errors ?What is my applications memory footprint ?Which parts of my application are CPU intensive ?How did my JVM vanish without a trace ?Why is my application unresponsive ?What monitoring do I put in place for my app. ?21October 4, 2011
What is your JVM up to ?Windows style task manager for displaying thread status and allow for their recovery & interruptionLeverage the ThreadMXBean API in the JDK to display thread informationhttps://github.com/kelapure/dynacache/blob/master/scripts/AllThreads.jsphttps://github.com/kelapure/dynacache/blob/master/scripts/ViewThread.jsp22October 4, 2011
Application runs slow when I do XXX ?Understand impact of activity on componentsLook at the thread & method profiles IBM Java Health Center Visual VMJrockit Mission ControlJVM method & dump trace - pinpoint performance problems. Shows entry & exit  times of any Java methodMethod to trace to file for all methods in tests.mytest.packageAllows taking javadump, heapdump, etc when a method is hitDump javacore when method testInnerMethod in an inner class TestInnerClass of a class TestClass is calledUse Btrace, -Xtrace * –Xdump  to trigger dumps on a range of eventsgpf, user, abort, fullgc, slow, allocation, thrstop, throw …Stack traces, tool launching23October 4, 2011
Application has erratic response times ?Verbose gc should be enabled by default<2% impact on performanceVisualGC, GCMV &PMAT : Visualize GC output  In use space after GCPositive gradient over time indicates memory leakIncreased load (use for capacity plan) Memory leak (take HDs for PD.) Choose the right GC policy Optimized for “batch” type applications, consistent allocation profileTight responsiveness criteria, allocations of large objectsHigh rates of object “burn”, large # of transitional objects12, 16 core SMP systems with allocation contention (AIX only)GC overhead > 10%  wrong policy | more tuningEnable compressed references for 64 bit JVM 24October 5, 2011
Out Of Memory Errors ?JVM Heap sized incorrectlyGC adapts heap size to keep occupancy [40, 70]%Determine heap occupancy of the app. under loadXmx = 43% larger than max. occupancy of app.For 700MB occupancy , 1000MB Max. heap is reqd. (700 +43% of 700)Analyze heapdumps & system dumps with tools like Eclipse Memory AnalyzerLack of Java heap or Native heapEclipse Memory Analyzer and IBM extensions Finding which methods allocated large objectsPrints stacktrace for all objects above 1KEnable Java Heap and Native heap monitoring JMX and metrics output by JVMClassloader exhaustion25October 4, 2011
Applications memory footprint ?HPROF – profiler shipped with JDK – uses JVMTI Analysis of memory usage -Xrunhprof:heap=all Performance Inspector tools - JPROF Java Profiling AgentCapture state of the Java Heap later processed by HDUMPGroup a system dump by classloadersince each app has its own classloader, you can get accurate information on how much heap each application is taking upUse MAT to investigate heapdumps & system dumps Find large clumps, Inspect those objects, What retains them ?Why is this object not being garbage collected – List Objects > incoming refs,  Path to GC roots,  Immediate dominators Limit analysis to a single application in a JEE environment - Dominator tree grouped by ClassLoader Dominator tree grouped by Class LoaderSet of objects that can be reclaimed if we could delete X -  Retained  Size Graphs  Retained  Size Graphs Traditional memory hogs  like HTTPSession, Cache - Use Object Query Language (OQLUse Object Query Language (OQL)26October 4, 2011
Using Javacores for TroubleshootingJavacores are often the most critical piece of information to resolve a hang, high CPU, crash and sometimes memory problemsA Javacore is a text file that contains a lot of useful informationThe date, time, java™ version, full command path and argumentsAll the threads in the JVM, including thread state, priority, thread ID, nameThread call stacksJavacores can be generated automatically or on demandAutomatically when an OutOfMemoryException is thrownOn demand with “kill -3 <pid>” Message to the SystemOut when a javacore is generated27"WebContainer : 537" (TID:0x088C7200, sys_thread_t:0x09C19F00, state:CW, native ID:0x000070E8) prio=5   at java/net/SocketInputStream.socketRead0(Native Method)   at java/net/SocketInputStream.read(SocketInputStream.java:155)   at oracle/net/ns/Packet.receive(Bytecode PC:31)   at oracle/net/ns/DataPacket.receive(Bytecode PC:1)   at oracle/net/ns/NetInputStream.read(Bytecode PC:33)   at oracle/jdbc/driver/T4CMAREngine.unmarshalUB1(T4CMAREngine.java:1123)   at oracle/jdbc/driver/T4C8Oall.receive(T4C8Oall.java:480)   at oracle/jdbc/driver/T4CPreparedStatement.executeForDescribe(T4CPreparedStatement.java:813)   at oracle/jdbc/driver/OracleStatement.doExecuteWithTimeout(OracleStatement.java:1154)   at oracle/jdbc/driver/OraclePreparedStatement.executeQuery(OraclePreparedStatement.java:3415)at com/ibm/commerce/user/objects/EJSJDBCPersisterCMPDemographicsBean_2bcaa7a2.load()   at com/ibm/ejs/container/ContainerManagedBeanO.load(ContainerManagedBeanO.java:1018)   at com/ibm/ejs/container/EJSHome.activateBean(EJSHome.java:1718)
CPU intensive parts of the app?ThreadDumps or Javacores- Poor mans profilerPeriodic javacoresThread analysis – using the Thread Monitor Dump Analyzer toolHigh CPU is typically diagnosed by comparing two key pieces of informationUsing Javacores, determine what code the threads are executingGather CPU usage statistics by threadFor each Javacore compare the call stacks between threadsFocus first on Request processing threads firstAre all the threads doing similar work? Are the threads moving ?Collect CPU statistics per threadIs there one thread consuming most of the CPU?Are there many active threads each consuming a small percentage of CPU?High CPU due to excessive garbage collection ?If this is a load/capacity problem then use HPROF profiler  -Xrunhrof:cpu=samples, -Xrunhprof:cpu=time28October 4, 2011
Diagnosis - HangsOften hangs are due to unresponsive synchronous requestsSMTP Server, Database, Map Service, Store Locator, Inventory, Order processing, etc3XMTHREADINFO "Servlet.Engine.Transports : 11" (TID:0x7DD38040, sys_thread_t:0x44618828, state:R, native ID:0x4A9F) prio=54XESTACKTRACE     at COM.ibm.db2.jdbc.app.DB2PreparedStatement.SQLExecute()4XESTACKTRACE     at COM.ibm.db2.jdbc.app.DB2PreparedStatement.execute2(DB2PreparedStatement.java)4XESTACKTRACE     at COM.ibm.db2.jdbc.app.DB2PreparedStatement.executeQuery(DB2PreparedStatement.java()4XESTACKTRACE     at ...3XMTHREADINFO "Servlet.Engine.Transports : 12" (TID:0x7DD37FC0, sys_thread_t:0x4461BDA8, state:R, native ID:0x4BA0) prio=54XESTACKTRACE     at COM.ibm.db2.jdbc.app.DB2PreparedStatement.SQLExecute()4XESTACKTRACE     at COM.ibm.db2.jdbc.app.DB2PreparedStatement.execute2(DB2PreparedStatement.java)4XESTACKTRACE     at COM.ibm.db2.jdbc.app.DB2PreparedStatement.executeQuery(DB2PreparedStatement.java()4XESTACKTRACE     at ...3XMTHREADINFO "Servlet.Engine.Transports : 13" (TID:0x7DD34C50, sys_thread_t:0x4465B028, state:R, native ID:0x4CCF) prio=54XESTACKTRACE     at COM.ibm.db2.jdbc.app.DB2PreparedStatement.SQLExecute()4XESTACKTRACE     at COM.ibm.db2.jdbc.app.DB2PreparedStatement.execute2(DB2PreparedStatement.java)4XESTACKTRACE     at COM.ibm.db2.jdbc.app.DB2PreparedStatement.executeQuery(DB2PreparedStatement.java()Not all hangs are waiting on an external resourceA JVM can hang due to a synchronization problem - One thread blocking several others293XMTHREADINFO "Servlet.Engine.Transports : 11" (TID:0x7DD38040, sys_thread_t:0x44618828, state:R, native ID:0x4A9F) prio=53LKMONOBJECT  com/ibm/ws/cache/Cache@0x65FB8788/0x65FB8794: owner "Default : DMN0" (0x355B48003LKWAITERQ       Waiting to enter:3LKWAITER           "WebContainer : 0" (0x3ACCD000)3LKWAITER           "WebContainer : 1" (0x3ACCCB00)3LKWAITER           "WebContainer : 2" (0x38D68300)3LKWAITER           "WebContainer : 3" (0x38D68800)
How did my JVM vanish without trace ?JVM Process Crash Usual Suspects Bad JNI calls,  Segmentation violations,  Call Stack OverflowNative memory leaks - Object allocation fails with sufficient space in the JVM heapUnexpected OS exceptions (out of disk space, file handles),  JIT failuresMonitor the OS process size Runtime check of JVM memory allocations –Xcheck:memoryNative memory usage - Create a core dump on an OOMJNI code static analysis -Xcheck:jni  (errors, warnings, advice)GCMV  provides scripts and graphing for native memoryWindows “perfmon“,  Linux “ps” & AIX “svmon” Find the last stack of native code executing on the thread during the crashThe signal info (1TISIGINFO) will show the Javacore was created due to a crashSignal 11 (SIGSEGV) or GPF30October 4, 2011
What do I monitor ?31October 4, 2011
Top  Malpractices32October 4, 2011
Support Assistant  Workbench to help with Problem Determination33October 4, 2011
One stop shop for tools to analyze JVM issues34October 4, 2011
Tools35October 4, 2011
Runtime Serviceability aidsTroubleshooting panels in the administration consolePerformance Monitoring Infrastructure metrics Diagnostic Provider MbeansDump Configuration, State and run self-testApplication Response Measurement/Request Metrics Follow transaction end-to-end and find bottlenecksTrace logs & First Failure Data CaptureRuntime Performance AdvisorsMemory leak detection, session size, …Specialized tracing and Runtime checksTomcat Classloader Leak DetectionSession crossover, Connection leak, ByteBuffer leak detection Runaway CPU thread protection36October 4, 2011
References	Java theory and practice: Dealing with InterruptedExceptionhttp://www.ibm.com/developerworks/java/library/j-jtp05236/index.htmlArchitectural design for resiliencehttp://dx.doi.org/10.1080/17517570903067751IBM Support Assistanthttp://www-01.ibm.com/software/support/isa/download.htmlHow Customers get into troublehttp://www-01.ibm.com/support/docview.wss?uid=swg2700835937
Q&AThank You38October 4, 2011

More Related Content

PDF
A Java Implementer's Guide to Better Apache Spark Performance
PDF
What Is Spring Framework In Java | Spring Framework Tutorial For Beginners Wi...
PDF
Applet Returns: The new generation of Java Plug-ins
KEY
Embedding Web UIs in your Eclipse application
PDF
Operations and Monitoring with Spring
PDF
WebSockets in Enterprise Applications
PDF
Spring Framework Tutorial | Spring Tutorial For Beginners With Examples | Jav...
PPTX
Migrating From Applets to Java Desktop Apps in JavaFX
A Java Implementer's Guide to Better Apache Spark Performance
What Is Spring Framework In Java | Spring Framework Tutorial For Beginners Wi...
Applet Returns: The new generation of Java Plug-ins
Embedding Web UIs in your Eclipse application
Operations and Monitoring with Spring
WebSockets in Enterprise Applications
Spring Framework Tutorial | Spring Tutorial For Beginners With Examples | Jav...
Migrating From Applets to Java Desktop Apps in JavaFX

What's hot (18)

PPT
Introduction To JBoss Seam 2.1
PDF
Why ClassforName Sucks - BJ Hargrave
PPTX
Seven Points for Applying Java EE 7
PPTX
Java 101
PDF
EJB and CDI - Alignment and Strategy
PPTX
HTTP/2 comes to Java. What Servlet 4.0 means to you. DevNexus 2015
PPTX
PROGRAMMING IN JAVA
PPTX
JavaFX and JEE 7
PDF
PL/SQL Guilty Pleasures
PDF
Java API for WebSocket 1.0: Java EE 7 and GlassFish
PDF
Six simple steps to unit testing happiness
PDF
Oracle Solaris 11 lab agenda
PDF
TDC 2015 - POA - Trilha PHP - Shit Happens
PDF
Real World Java Compatibility (Tim Ellison)
PPTX
[RakutenTechConf2013] [E-3] Financial Web System with Java EE 6
PDF
WoMakersCode 2016 - Shit Happens
PDF
Tweet4Beer - Beertap powered by Java goes IoT and JavaFX
PDF
Oracle Solaris 11 Education
Introduction To JBoss Seam 2.1
Why ClassforName Sucks - BJ Hargrave
Seven Points for Applying Java EE 7
Java 101
EJB and CDI - Alignment and Strategy
HTTP/2 comes to Java. What Servlet 4.0 means to you. DevNexus 2015
PROGRAMMING IN JAVA
JavaFX and JEE 7
PL/SQL Guilty Pleasures
Java API for WebSocket 1.0: Java EE 7 and GlassFish
Six simple steps to unit testing happiness
Oracle Solaris 11 lab agenda
TDC 2015 - POA - Trilha PHP - Shit Happens
Real World Java Compatibility (Tim Ellison)
[RakutenTechConf2013] [E-3] Financial Web System with Java EE 6
WoMakersCode 2016 - Shit Happens
Tweet4Beer - Beertap powered by Java goes IoT and JavaFX
Oracle Solaris 11 Education
Ad

Similar to Debugging java deployments_2 (20)

PPTX
Application Profiling for Memory and Performance
PDF
Application Profiling for Memory and Performance
PDF
Resource management in java bof6823 - java one 2012
PPT
Optimizing your java applications for multi core hardware
PDF
Performance Tuning - Memory leaks, Thread deadlocks, JDK tools
PDF
Concurrency on the JVM
PDF
Concurrency and Multithreading Demistified - Reversim Summit 2014
PDF
Web Sphere Problem Determination Ext
PDF
Java Concurrency, A(nother) Peek Under the Hood [Code One 2019]
PDF
Hangs, Slowdowns, Starvation—Oh My! A Deep Dive into the Life of a Java Threa...
PPT
Best Practices for performance evaluation and diagnosis of Java Applications ...
PDF
JavaOne 2010: Top 10 Causes for Java Issues in Production and What to Do When...
PDF
Profiler Guided Java Performance Tuning
PPT
Classloader leak detection in websphere application server
ODP
Java Concurrency
PDF
Challenges in Maintaining a High Performance Search Engine Written in Java
PPTX
Java concurrency
PDF
Concurrency in Java
PDF
Concurrent Programming in Java
ODP
Java Concurrency, Memory Model, and Trends
Application Profiling for Memory and Performance
Resource management in java bof6823 - java one 2012
Optimizing your java applications for multi core hardware
Performance Tuning - Memory leaks, Thread deadlocks, JDK tools
Concurrency on the JVM
Concurrency and Multithreading Demistified - Reversim Summit 2014
Web Sphere Problem Determination Ext
Java Concurrency, A(nother) Peek Under the Hood [Code One 2019]
Hangs, Slowdowns, Starvation—Oh My! A Deep Dive into the Life of a Java Threa...
Best Practices for performance evaluation and diagnosis of Java Applications ...
JavaOne 2010: Top 10 Causes for Java Issues in Production and What to Do When...
Profiler Guided Java Performance Tuning
Classloader leak detection in websphere application server
Java Concurrency
Challenges in Maintaining a High Performance Search Engine Written in Java
Java concurrency
Concurrency in Java
Concurrent Programming in Java
Java Concurrency, Memory Model, and Trends
Ad

More from Rohit Kelapure (20)

PDF
API First or Events First: Is it a Binary Choice?
PDF
External should that be a microservice
PDF
Should That Be a Microservice ?
PPTX
Travelers 360 degree health assessment of microservices on the pivotal platform
PDF
SpringOne Platform 2018 Recap in 5 minutes
PDF
Migrate Heroku & OpenShift Applications to IBM BlueMix
PDF
Liberty Buildpack: Designed for Extension - Integrating your services in Blue...
PDF
A Deep Dive into the Liberty Buildpack on IBM BlueMix
PDF
Liberty dynacache ffw_iea_ste
PDF
1812 icap-v1.3 0430
PDF
Dynacache in WebSphere Portal Server
PPTX
2012 04-09-v2-tdp-1167-cdi-bestpractices-final
PDF
2012 04-06-v2-tdp-1163-java e-evsspringshootout-final
PPTX
2012 04-09-v2-tdp-1167-cdi-bestpractices-final
DOC
Web sphere application server performance tuning workshop
PPT
Performance tuningtoolkitintroduction
PDF
IBM Health Center Details
PPTX
Java EE vs Spring Framework
ODP
Caching technology comparison
PPT
SIBus Tuning for production WebSphere Application Server
API First or Events First: Is it a Binary Choice?
External should that be a microservice
Should That Be a Microservice ?
Travelers 360 degree health assessment of microservices on the pivotal platform
SpringOne Platform 2018 Recap in 5 minutes
Migrate Heroku & OpenShift Applications to IBM BlueMix
Liberty Buildpack: Designed for Extension - Integrating your services in Blue...
A Deep Dive into the Liberty Buildpack on IBM BlueMix
Liberty dynacache ffw_iea_ste
1812 icap-v1.3 0430
Dynacache in WebSphere Portal Server
2012 04-09-v2-tdp-1167-cdi-bestpractices-final
2012 04-06-v2-tdp-1163-java e-evsspringshootout-final
2012 04-09-v2-tdp-1167-cdi-bestpractices-final
Web sphere application server performance tuning workshop
Performance tuningtoolkitintroduction
IBM Health Center Details
Java EE vs Spring Framework
Caching technology comparison
SIBus Tuning for production WebSphere Application Server

Recently uploaded (20)

PPT
“AI and Expert System Decision Support & Business Intelligence Systems”
PPTX
Effective Security Operations Center (SOC) A Modern, Strategic, and Threat-In...
PDF
cuic standard and advanced reporting.pdf
PDF
TokAI - TikTok AI Agent : The First AI Application That Analyzes 10,000+ Vira...
PPTX
VMware vSphere Foundation How to Sell Presentation-Ver1.4-2-14-2024.pptx
PDF
Electronic commerce courselecture one. Pdf
PDF
Network Security Unit 5.pdf for BCA BBA.
PDF
Per capita expenditure prediction using model stacking based on satellite ima...
PPTX
MYSQL Presentation for SQL database connectivity
PDF
Blue Purple Modern Animated Computer Science Presentation.pdf.pdf
PDF
Machine learning based COVID-19 study performance prediction
PDF
Approach and Philosophy of On baking technology
PDF
Modernizing your data center with Dell and AMD
PPTX
A Presentation on Artificial Intelligence
PDF
Build a system with the filesystem maintained by OSTree @ COSCUP 2025
PDF
How UI/UX Design Impacts User Retention in Mobile Apps.pdf
PPTX
Big Data Technologies - Introduction.pptx
PDF
Building Integrated photovoltaic BIPV_UPV.pdf
PPT
Teaching material agriculture food technology
PDF
Chapter 3 Spatial Domain Image Processing.pdf
“AI and Expert System Decision Support & Business Intelligence Systems”
Effective Security Operations Center (SOC) A Modern, Strategic, and Threat-In...
cuic standard and advanced reporting.pdf
TokAI - TikTok AI Agent : The First AI Application That Analyzes 10,000+ Vira...
VMware vSphere Foundation How to Sell Presentation-Ver1.4-2-14-2024.pptx
Electronic commerce courselecture one. Pdf
Network Security Unit 5.pdf for BCA BBA.
Per capita expenditure prediction using model stacking based on satellite ima...
MYSQL Presentation for SQL database connectivity
Blue Purple Modern Animated Computer Science Presentation.pdf.pdf
Machine learning based COVID-19 study performance prediction
Approach and Philosophy of On baking technology
Modernizing your data center with Dell and AMD
A Presentation on Artificial Intelligence
Build a system with the filesystem maintained by OSTree @ COSCUP 2025
How UI/UX Design Impacts User Retention in Mobile Apps.pdf
Big Data Technologies - Introduction.pptx
Building Integrated photovoltaic BIPV_UPV.pdf
Teaching material agriculture food technology
Chapter 3 Spatial Domain Image Processing.pdf

Debugging java deployments_2

  • 1. Rohit KelapureIBM Advisory Software Engineer 29 September 2011Server Resiliency - Debugging Java deployments
  • 2. Introduction to Speaker – Rohit KelapureResponsible for the resiliency of WebSphere Application ServerTeam Lead and architect of Caching & Data replication features in WebSphereCalled upon to hose down fires & resolve critical situationsCustomer advocate for large banks Active blogger All Things WebSphereApache Open Web Beans committer Java EE, OSGI & Spring Developerkelapure@us.ibm.comkelapure@gmail.comLinkedinhttp://twitter.com/#!/rkela2
  • 3. Important DisclaimersTHE INFORMATION CONTAINED IN THIS PRESENTATION IS PROVIDED FOR INFORMATIONAL PURPOSES ONLY. WHILST EFFORTS WERE MADE TO VERIFY THE COMPLETENESS AND ACCURACY OF THE INFORMATION CONTAINED IN THIS PRESENTATION, IT IS PROVIDED “AS IS”, WITHOUT WARRANTY OF ANY KIND, EXPRESS OR IMPLIED. ALL PERFORMANCE DATA INCLUDED IN THIS PRESENTATION HAVE BEEN GATHERED IN A CONTROLLED ENVIRONMENT. YOUR OWN TEST RESULTS MAY VARY BASED ON HARDWARE, SOFTWARE OR INFRASTRUCTURE DIFFERENCES.ALL DATA INCLUDED IN THIS PRESENTATION ARE MEANT TO BE USED ONLY AS A GUIDE.IN ADDITION, THE INFORMATION CONTAINED IN THIS PRESENTATION IS BASED ON IBM’S CURRENT PRODUCT PLANS AND STRATEGY, WHICH ARE SUBJECT TO CHANGE BY IBM, WITHOUT NOTICE. IBM AND ITS AFFILIATED COMPANIES SHALL NOT BE RESPONSIBLE FOR ANY DAMAGES ARISING OUT OF THE USE OF, OR OTHERWISE RELATED TO, THIS PRESENTATION OR ANY OTHER DOCUMENTATION. NOTHING CONTAINED IN THIS PRESENTATION IS INTENDED TO, OR SHALL HAVE THE EFFECT OF: - CREATING ANY WARRANT OR REPRESENTATION FROM IBM, ITS AFFILIATED COMPANIES OR ITS OR THEIR SUPPLIERS AND/OR LICENSORS3
  • 4. Copyright and Trademarks© IBM Corporation 2011. All Rights Reserved. IBM, the IBM logo, and ibm.com are trademarks or registered trademarks of International Business Machines Corp., and registered in many jurisdictions worldwide. Other product and service names might be trademarks of IBM or other companies. A current list of IBM trademarks is available on the Web – see the IBM “Copyright and trademark information” page at URL: www.ibm.com/legal/copytrade.shtml4
  • 5. OutlineServer Resiliency FundamentalsCommon JVM ProblemsProtecting your JVMHung thread detection, Thread Interruption, Thread hang recoveryMemory leak detection, protection & actionScenario based problem resolutionToolingEclipse Memory AnalyzerThread Dump AnalyzerGarbage Collection and Memory Visualizer5
  • 6. ResiliencyProperty of a material that can absorb external energy when it is forced to deform elastically, and then be able to recover to its original form and release the energy6
  • 7. Server Resiliency Concepts7October 4, 2011Explicit MessagingDistributed Shared memory – Better ConsistencyMessage Passing – Loose CouplingUniform InterfaceE.g. World Wide WebBetter scalability, reusability and reliability Data, process and other forms of computations identified by one mechanism Semantics of operations in messages for operating on the data are unifiedSelf ManagementComposed of self-managing components.Managed element, managers, sensors & effectorse.g. TCP/IP Congestion ControlRedundancy (Data and processing)Create ReplicasHigh cost of initialization and reconfigurationRedundant elements need to be synchronized from time to timePartitionSplitting the data into smaller pieces and storing them in distributed fashionAllows for parallelization & divide and conquerPartial failure isolationVirtualizationFunctionalities of processing and data element virtualized as a serviceLoose coupling between system and consumed servicesIntegration by enforcing explicitly boundary and schema-based interfacesDecentralized Control High communication overhead of centralized control for a system of heavy redundancySometimes trapped in locally optimized solutionsFixing issues requires shutting down the entire system e.g. AWS outage
  • 8. Most common JVM Problem Scenarios8October 4, 2011
  • 9. Thread HangsThreading and synchronization issues are among the top 5 application performance challengestoo aggressive with shared resources causes data inconsistenciestoo conservative leads to too much contention between threads Application unresponsiveness Adding users / threads /CPUs causes app slow down (less throughput, worse response)High lock acquire times & contentionRace conditions, deadlock, I/O under lockTooling is needed to rescue applications and the JVM from itself Identify these conditions If possible remedy them in the short term for server resiliency9October 4, 2011
  • 10. JVM Hung Thread Detection Every X seconds an alarm thread wakes up and iterates over all managed thread pools. Subtract the "start time" of the thread from the current time, and passes it to a monitor. Detection policy then determines based on the available data if the thread is hung Print stack trace of the hung thread10October 4, 2011
  • 11. Thread Interruption 101 Thread.stop stops thread by throwing ThreadDeath exception * DeprecatedThread.interrupt(): Cooperative mechanism for a thread to signal another thread that it should, at its convenience and if it feels like it, stop what it is doing and do something else.Interruption is usually the most sensible way to implement task cancellation. Because each thread has its own interruption policy, you should not interrupt a thread unless you know what interruption means to that thread.Any method sensing interruption shouldAssume current task is cancelled & perform some task‐specific cleanupExit as quickly and cleanly as possible ensuring that callers are aware of cancellation Propagate the exception, making your method an interruptible blocking method, to throw new InterruptedException()Restore the interruption status so that code higher up on the call stack can deal with it Thread.currentThread().interrupt()Only code that implements a thread's interruption policy may swallow an interruption request. 11October 4, 2011
  • 14. Dealing with Non‐interruptible BlockingMany blocking library methods respond to interruption by returning early and throwing InterruptedExceptionMakes it easier to build tasks that are responsive to cancellation Lock.lockInterruptiblyThread.sleep,Thread.waitThread.notifyThread.joinNot all blocking methods or blocking mechanisms are responsive to interruptionif a thread is blocked performing synchronous socket I/O, interruption has no effect other than setting the thread's interrupted statusIf a thread is blocked waiting for an intrinsic lock, there is nothing you can do to stop short of ensuring that it eventually acquires the lock14October 4, 2011
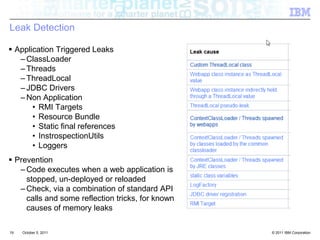
  • 15. Thread Hang Recovery – Technique Application specific hacks for thread hang recoveryByte code instrumentationTransform the concrete subclasses of the abstract classes InputStream& OutputStreamto make the socket I/O operations interruptible. Transform an application class so that every loop can be interrupted by invoking Interrupter.interrupt(Thread, boolean)Transform a monitorenter instruction and a monitorexit instruction so that the wait at entering into a monitor is interruptiblehttp://www.ibm.com/developerworks/websphere/downloads/hungthread.html15
  • 16. Memory LeaksLeaks come in various types, such asMemory leaksThread and ThreadLocal leaksClassLoader leaksSystem resource leaks Connection leaksCustomers want to increase application uptime without cycling the server. Frequent application restarts without stopping the server.Frequent redeployments of the application result in OOM errors What do we have today Offline post-mortem analysis of a JVM heap. Tools like Jrockit Mission Control, MAT. IEMA are the IBM Extensions for Memory AnalyzerRuntime memory leak detection using JVMTI and PMI (Runtime Performance Advisor)We don’t have application level i.e. top down memory leak detection and protectionLeak detection by looking at suspect patterns in application code16October 4, 2011
  • 17. ClassLoader Leaks 101A class is uniquely identified byIts name + The class loader that loaded itClass with the same name can be loaded multiple times in a single JVM, each in a different class loaderWeb containers use this for isolating web applicationsEach web application gets its own class loaderReference ChainAn object retains a reference to the class it is an instance ofA class retains a reference to the class loader that loaded itThe class loader retains a reference to every class it loadedRetaining a reference to a single object from a web application pins every class loaded by the web applicationThese references often remain after a web application reload With each reload, more classes get pinned ultimately leading to an OOM17October 4, 2011
  • 18. Tomcat pioneered approach - Leak Prevention JRE triggered leak Singleton / static initializerCan be a ThreadSomething that won’t get garbage collectedRetains a reference to the context class loader when loadedIf web application code triggers the initializationThe context class loader will be web application class loaderA reference is created to the web application class loaderThis reference is never garbage collectedPins the class loader (and hence all the classes it loaded) in memoryPrevention with a DeployedObjectListenerCalling various parts of the Java API that are known to retain a reference to the current context class loaderInitialize these singletons when the Application Server’s class loader is the context class loader18October 5, 2011
  • 19. Leak DetectionApplication Triggered LeaksClassLoader ThreadsThreadLocal JDBC DriversNon ApplicationRMI TargetsResource BundleStatic final referencesInstrospectionUtilsLoggersPreventionCode executes when a web application is stopped, un-deployed or reloadedCheck, via a combination of standard API calls and some reflection tricks, for known causes of memory leaks19October 4, 2011
  • 20. Memory leak detection console20October 4, 2011
  • 21. What is wrong with my application …?Why does my application run slow every time I do X ?Why does my application have erratic response times ? Why am I getting Out of Memory Errors ?What is my applications memory footprint ?Which parts of my application are CPU intensive ?How did my JVM vanish without a trace ?Why is my application unresponsive ?What monitoring do I put in place for my app. ?21October 4, 2011
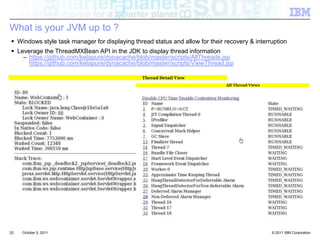
  • 22. What is your JVM up to ?Windows style task manager for displaying thread status and allow for their recovery & interruptionLeverage the ThreadMXBean API in the JDK to display thread informationhttps://github.com/kelapure/dynacache/blob/master/scripts/AllThreads.jsphttps://github.com/kelapure/dynacache/blob/master/scripts/ViewThread.jsp22October 4, 2011
  • 23. Application runs slow when I do XXX ?Understand impact of activity on componentsLook at the thread & method profiles IBM Java Health Center Visual VMJrockit Mission ControlJVM method & dump trace - pinpoint performance problems. Shows entry & exit times of any Java methodMethod to trace to file for all methods in tests.mytest.packageAllows taking javadump, heapdump, etc when a method is hitDump javacore when method testInnerMethod in an inner class TestInnerClass of a class TestClass is calledUse Btrace, -Xtrace * –Xdump to trigger dumps on a range of eventsgpf, user, abort, fullgc, slow, allocation, thrstop, throw …Stack traces, tool launching23October 4, 2011
  • 24. Application has erratic response times ?Verbose gc should be enabled by default<2% impact on performanceVisualGC, GCMV &PMAT : Visualize GC output In use space after GCPositive gradient over time indicates memory leakIncreased load (use for capacity plan) Memory leak (take HDs for PD.) Choose the right GC policy Optimized for “batch” type applications, consistent allocation profileTight responsiveness criteria, allocations of large objectsHigh rates of object “burn”, large # of transitional objects12, 16 core SMP systems with allocation contention (AIX only)GC overhead > 10%  wrong policy | more tuningEnable compressed references for 64 bit JVM 24October 5, 2011
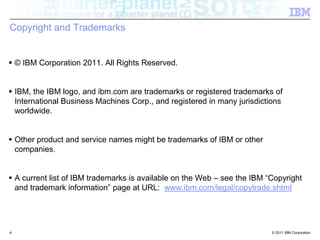
  • 25. Out Of Memory Errors ?JVM Heap sized incorrectlyGC adapts heap size to keep occupancy [40, 70]%Determine heap occupancy of the app. under loadXmx = 43% larger than max. occupancy of app.For 700MB occupancy , 1000MB Max. heap is reqd. (700 +43% of 700)Analyze heapdumps & system dumps with tools like Eclipse Memory AnalyzerLack of Java heap or Native heapEclipse Memory Analyzer and IBM extensions Finding which methods allocated large objectsPrints stacktrace for all objects above 1KEnable Java Heap and Native heap monitoring JMX and metrics output by JVMClassloader exhaustion25October 4, 2011
  • 26. Applications memory footprint ?HPROF – profiler shipped with JDK – uses JVMTI Analysis of memory usage -Xrunhprof:heap=all Performance Inspector tools - JPROF Java Profiling AgentCapture state of the Java Heap later processed by HDUMPGroup a system dump by classloadersince each app has its own classloader, you can get accurate information on how much heap each application is taking upUse MAT to investigate heapdumps & system dumps Find large clumps, Inspect those objects, What retains them ?Why is this object not being garbage collected – List Objects > incoming refs, Path to GC roots, Immediate dominators Limit analysis to a single application in a JEE environment - Dominator tree grouped by ClassLoader Dominator tree grouped by Class LoaderSet of objects that can be reclaimed if we could delete X - Retained Size Graphs Retained Size Graphs Traditional memory hogs like HTTPSession, Cache - Use Object Query Language (OQLUse Object Query Language (OQL)26October 4, 2011
  • 27. Using Javacores for TroubleshootingJavacores are often the most critical piece of information to resolve a hang, high CPU, crash and sometimes memory problemsA Javacore is a text file that contains a lot of useful informationThe date, time, java™ version, full command path and argumentsAll the threads in the JVM, including thread state, priority, thread ID, nameThread call stacksJavacores can be generated automatically or on demandAutomatically when an OutOfMemoryException is thrownOn demand with “kill -3 <pid>” Message to the SystemOut when a javacore is generated27"WebContainer : 537" (TID:0x088C7200, sys_thread_t:0x09C19F00, state:CW, native ID:0x000070E8) prio=5 at java/net/SocketInputStream.socketRead0(Native Method) at java/net/SocketInputStream.read(SocketInputStream.java:155) at oracle/net/ns/Packet.receive(Bytecode PC:31) at oracle/net/ns/DataPacket.receive(Bytecode PC:1) at oracle/net/ns/NetInputStream.read(Bytecode PC:33) at oracle/jdbc/driver/T4CMAREngine.unmarshalUB1(T4CMAREngine.java:1123) at oracle/jdbc/driver/T4C8Oall.receive(T4C8Oall.java:480) at oracle/jdbc/driver/T4CPreparedStatement.executeForDescribe(T4CPreparedStatement.java:813) at oracle/jdbc/driver/OracleStatement.doExecuteWithTimeout(OracleStatement.java:1154) at oracle/jdbc/driver/OraclePreparedStatement.executeQuery(OraclePreparedStatement.java:3415)at com/ibm/commerce/user/objects/EJSJDBCPersisterCMPDemographicsBean_2bcaa7a2.load() at com/ibm/ejs/container/ContainerManagedBeanO.load(ContainerManagedBeanO.java:1018) at com/ibm/ejs/container/EJSHome.activateBean(EJSHome.java:1718)
  • 28. CPU intensive parts of the app?ThreadDumps or Javacores- Poor mans profilerPeriodic javacoresThread analysis – using the Thread Monitor Dump Analyzer toolHigh CPU is typically diagnosed by comparing two key pieces of informationUsing Javacores, determine what code the threads are executingGather CPU usage statistics by threadFor each Javacore compare the call stacks between threadsFocus first on Request processing threads firstAre all the threads doing similar work? Are the threads moving ?Collect CPU statistics per threadIs there one thread consuming most of the CPU?Are there many active threads each consuming a small percentage of CPU?High CPU due to excessive garbage collection ?If this is a load/capacity problem then use HPROF profiler -Xrunhrof:cpu=samples, -Xrunhprof:cpu=time28October 4, 2011
  • 29. Diagnosis - HangsOften hangs are due to unresponsive synchronous requestsSMTP Server, Database, Map Service, Store Locator, Inventory, Order processing, etc3XMTHREADINFO "Servlet.Engine.Transports : 11" (TID:0x7DD38040, sys_thread_t:0x44618828, state:R, native ID:0x4A9F) prio=54XESTACKTRACE at COM.ibm.db2.jdbc.app.DB2PreparedStatement.SQLExecute()4XESTACKTRACE at COM.ibm.db2.jdbc.app.DB2PreparedStatement.execute2(DB2PreparedStatement.java)4XESTACKTRACE at COM.ibm.db2.jdbc.app.DB2PreparedStatement.executeQuery(DB2PreparedStatement.java()4XESTACKTRACE at ...3XMTHREADINFO "Servlet.Engine.Transports : 12" (TID:0x7DD37FC0, sys_thread_t:0x4461BDA8, state:R, native ID:0x4BA0) prio=54XESTACKTRACE at COM.ibm.db2.jdbc.app.DB2PreparedStatement.SQLExecute()4XESTACKTRACE at COM.ibm.db2.jdbc.app.DB2PreparedStatement.execute2(DB2PreparedStatement.java)4XESTACKTRACE at COM.ibm.db2.jdbc.app.DB2PreparedStatement.executeQuery(DB2PreparedStatement.java()4XESTACKTRACE at ...3XMTHREADINFO "Servlet.Engine.Transports : 13" (TID:0x7DD34C50, sys_thread_t:0x4465B028, state:R, native ID:0x4CCF) prio=54XESTACKTRACE at COM.ibm.db2.jdbc.app.DB2PreparedStatement.SQLExecute()4XESTACKTRACE at COM.ibm.db2.jdbc.app.DB2PreparedStatement.execute2(DB2PreparedStatement.java)4XESTACKTRACE at COM.ibm.db2.jdbc.app.DB2PreparedStatement.executeQuery(DB2PreparedStatement.java()Not all hangs are waiting on an external resourceA JVM can hang due to a synchronization problem - One thread blocking several others293XMTHREADINFO "Servlet.Engine.Transports : 11" (TID:0x7DD38040, sys_thread_t:0x44618828, state:R, native ID:0x4A9F) prio=53LKMONOBJECT com/ibm/ws/cache/Cache@0x65FB8788/0x65FB8794: owner "Default : DMN0" (0x355B48003LKWAITERQ Waiting to enter:3LKWAITER "WebContainer : 0" (0x3ACCD000)3LKWAITER "WebContainer : 1" (0x3ACCCB00)3LKWAITER "WebContainer : 2" (0x38D68300)3LKWAITER "WebContainer : 3" (0x38D68800)
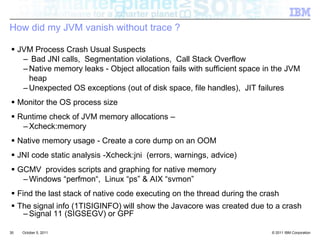
  • 30. How did my JVM vanish without trace ?JVM Process Crash Usual Suspects Bad JNI calls, Segmentation violations, Call Stack OverflowNative memory leaks - Object allocation fails with sufficient space in the JVM heapUnexpected OS exceptions (out of disk space, file handles), JIT failuresMonitor the OS process size Runtime check of JVM memory allocations –Xcheck:memoryNative memory usage - Create a core dump on an OOMJNI code static analysis -Xcheck:jni (errors, warnings, advice)GCMV provides scripts and graphing for native memoryWindows “perfmon“, Linux “ps” & AIX “svmon” Find the last stack of native code executing on the thread during the crashThe signal info (1TISIGINFO) will show the Javacore was created due to a crashSignal 11 (SIGSEGV) or GPF30October 4, 2011
  • 31. What do I monitor ?31October 4, 2011
  • 33. Support Assistant Workbench to help with Problem Determination33October 4, 2011
  • 34. One stop shop for tools to analyze JVM issues34October 4, 2011
  • 36. Runtime Serviceability aidsTroubleshooting panels in the administration consolePerformance Monitoring Infrastructure metrics Diagnostic Provider MbeansDump Configuration, State and run self-testApplication Response Measurement/Request Metrics Follow transaction end-to-end and find bottlenecksTrace logs & First Failure Data CaptureRuntime Performance AdvisorsMemory leak detection, session size, …Specialized tracing and Runtime checksTomcat Classloader Leak DetectionSession crossover, Connection leak, ByteBuffer leak detection Runaway CPU thread protection36October 4, 2011
  • 37. References Java theory and practice: Dealing with InterruptedExceptionhttp://www.ibm.com/developerworks/java/library/j-jtp05236/index.htmlArchitectural design for resiliencehttp://dx.doi.org/10.1080/17517570903067751IBM Support Assistanthttp://www-01.ibm.com/software/support/isa/download.htmlHow Customers get into troublehttp://www-01.ibm.com/support/docview.wss?uid=swg2700835937

Editor's Notes

  • #2: Session ID 22723 Status Accepted Title JVM Flight Simulator: Debugging Java Deployments Abstract Troubleshooting issues such as instances of OutOfMemoryError, performance problems, and various exceptions is a common task for anyone developing or deploying an application. This deep dive session presents a hands-on demo of using open source IBM tools such as Monitoring and Diagnostic Tools for Java, Extended Memory Analyzer Tool, and the Support Assistant. Come learn how to diagnose these common problem types. Speakers Rohit Kelapure IBM Advisory Software EngineerType Conference Session Length 60 minutes JavaOne Primary Track Core Java Platform JavaOne Optional Track Java SE, Client Side Technologies, and Rich User Experiences
  • #10: Challenge #5: Threading and Synchronization Issues Of the many issues affecting the performance of Java applications, synchronization ranks near the top. There is no question that synchronization is necessary to protect shared data in an application. The fundamental need to synchronize lies with Java&apos;s support for concurrency. This happens by allowing the execution of code by separate threads within the same process. Using shared resources efficiently, such as connection pools and data caches, is very important for good application performance. Being too aggressive with shared resources causes data inconsistencies, and being too conservative leads to too much contention between threads (because resource locking is involved). This affects the performance of the application largely because most threads servicing users are affected and slowed down -- they end up waiting for resources instead of doing real processing work.If you want to improve synchronization issues, application performance management tools can help; the right tool can enable you to monitor application execution under high loads (aka &quot;in production&quot;) and quickly pinpoint the execution times. In doing so, you will increase your ability to identify thread synchronization issues become greatly increase -- and the overall MTTR will drop dramatically.
  • #11: Length of time in seconds thread can be active before considered hung Number of times that false alarms can occur before automatically increasing the thresholdOpportunity to implement in apache Commons ThreadPoolDoes not include any spawned threads or unmanaged threads
  • #12: Calling interrupt does not necessarily stop the target thread from doing what it is doing; it merely delivers the message that interruption has been requestedDeprecated in JDK1.2 because it can corrupt object state:General‐purpose application task &amp; application library code should never swallow interruption requests
  • #15: and makes enough progress that you can get its attention some other way
  • #27: Path to GC roots – Reference chain that prevents object from being GcedDominator tree grouped by Class Loader- Limit analysis to a single application in a JEE environment Retained Size Graphs- set of objects that can be reclaimed if we could delete XSELECT data as &quot;MemorySessionData&quot;, data.@usedHeapSize as &quot;Heap Size&quot;, data.@retainedHeapSize as &quot;Retained Heap Size&quot;, mSwappableData, toString(data.mManager.scAppParms._J2EEName) as &quot;J2EE Name&quot;, toString(data.appName) as &quot;App Name&quot;, toString(data.mSessionId) as &quot;Session ID&quot; FROM com.ibm.ws.webcontainer.httpsession.MemorySessionData data
  • #30: If the Javacores show most threads are idle, it is possible that the requests are not making their way to the Application ServerThe following example shows multiple threads waiting for a DB2 database to respond. This indicates the bottleneck is in the DB
  • #37: Connection Manager, Node Synchronization, Node agent, Deployment Manager, WebContainer Runtime AdvisorSpecialized tracing and Runtime checksConnection Leak, WsByteBuffer leak detection, Session crossover, transaction ID, request ID The advisors provide a variety of advice on the following application server resources: Object Request Broker service thread pools Web container thread pools Connection pool size Persisted session size and time Data source statement cache size Session cache size Dynamic cache size Java virtual machine heap size DB2 Performance Configuration wizard