SlideShare a Scribd company logo
Prescriptive Analytics:
Optimization and
Simulation
• Understand the applications of prescriptive analytics techniques in
combination with reporting and predictive analytics
• Understand the basic concepts of analytical decision modeling
• Understand the concepts of analytical models for selected decision
problems, including linear programming and simulation models for decision
support
• Describe how spreadsheets can be used for analytical modeling and
solutions
• Explain the basic concepts of optimization and when to use them
• Describe how to structure a linear programming model
• Explain what is meant by sensitivity analysis, what-if analysis, and goal
seeking
• Understand the concepts and applications of different types of simulation
• Understand potential applications of discrete event simulation
School District of Philadelphia Uses Prescriptive
Analytics to Find Optimal Solution for Awarding Bus
Route Contracts
• The School District of Philadelphia was in search of
private bus vendors to outsource some of their bus
routes.
• The vendors were evaluated based on five variables:
cost, capabilities, reliance, financial stability, and
business acumen.
School District of Philadelphia Uses Prescriptive
Analytics to Find Optimal Solution for Awarding Bus
Route Contracts
• Solution: The school created an optimization model (using
Solver analytic tool in Excel) that took into account the
aforementioned variables associated with each vendor.
• Benefits: In addition to determining how many of the vendors
should be awarded contracts, the model helped develop the
size of each of the contracts.
• The size of the contracts varied from one vendor getting 4
routes to another receiving 97 routes.
What can We Learn from this Case?
Most organizations face the problem of making
decisions where one has to select from multiple options.
Each option has a cost and capability associated with it.
The goal is to select the combination of options that
meet all the requirements and yet optimizes the costs.
Most organizations face the problem of making
decisions where one has to select from multiple options.
Each option has a cost and capability associated with it.
The goal is to select the combination of options that
meet all the requirements and yet optimizes the costs.
Model-Based Decision Making
• Prescriptive analytics – making decision using
some kind of analytical model
– Descriptive and predictive analytics creates the
foundation (i.e., choice alternatives) for prescriptive
analytics (i.e., making best possible decision)
• Descriptive and Predictive leads to Prescriptive
– Descriptive, Predictive  Prescriptive
Model-Based Decision Making
• Example
– Profit maximization based on product/service pricing.
– Which customers should receive certain promotional
offers to maximize overall response (while staying
within a pre-specified budget).
Model-Based Decision Making
https://www.youtube.com/watch?v=vI1B_GEfJKs
Case 6.1: Optimal Transport for ExxonMobil
Downstream through a Decision Support System (DSS)
ExxonMobil provides several ranges of petroleum products, including
clean fuels, lubricants, and high-value products and feedstock to
several customers.
Challenge: The manual process could not determine the actual
routes of vessels, the timing of each vessel, and the quantity of
vacuum gas oil loaded and discharged.
Solution: the company used mathematical programming language,
GAMS, to make strategic business decisions in terms of the type of
ships it uses, the types of cargo it carries, the volume of cargo it
carries, and the ports that it works with most frequently.
https://www.google.ca/url?sa=i&rct=j&q=&esrc=s&source=images&cd=&ved=2ahUKEwi6qK_eqNPZAhVV_WMKHYr0CVQQjRx6BAgAEAY&url=https%3A%2F%2Fwww.offshoreenergytoday.com%2F
Identification of the Problem
• Environmental analysis (information collection)
• Variable identification
• Forecasting (predictive analytics)
– More information leads to better forecast/prediction
Mathematical modeling is a key element to prescriptive analytics
Category Process and Objective Representative Techniques
Optimization of
problems with few
alternatives
Find the best solution from a
small number of alternatives
Decision tables, decision trees
Optimization via
algorithm
Find the best solution from a
large number of alternatives,
using a step-by-step
improvement process
Linear and other mathematical
programming models
Optimization via an
analytic formula
Find the best solution in one
step, using a formula
Some inventory models
Simulation
Find a good enough solution or
the best among the alternatives
checked, using experimentation
Several types of simulation
Heuristics Find a good enough solution,
using rules
Heuristic programming, expert
systems
Predictive models Predict the future for a given
scenario
Forecasting models, Markov
analysis
Other models Solve a what-if case, using a
formula
Financial modeling, waiting
lines
Categories of Models
• Quantitative Models: Mathematically links decision
variables, uncontrollable variables, and result variables
Structure of Mathematical Models
for Decision Support
Independent Variables
Dependent Variable
Area Decision
Variables
Result Variables Uncontrollable
Variables and
Parameters
Financial
investment
• Investment
alternatives and
amounts
• Total profit
• Rate of return on
investment
• Liquidity level
• Inflation rate
• Prime interest rate
• Competition
Marketing
• Advertising
budget
• Where to
advertise
• Market share
• Customer satisfaction
• Customer’s income
• Competitor’s actions
Manufacturing
• What and how
much to
produce
• Inventory levels
• Compensation
programs
• Total cost
• Quality level
• Employee satisfaction
• Machine capacity
• Materials prices
Structure of Mathematical Models
for Decision Support
Area Decision
Variables
Result Variables Uncontrollable
Variables and
Parameters
Accounting
• Audit
schedule
• Error rate • Tax rates
• Legal requirements
Transportation
• Shipments
schedule
• Total transport cost • Delivery distance
• Regulations
Services
• Staffing
levels
• Customer
satisfaction
• Demand for services
Structure of Mathematical Models
for Decision Support
Modeling and Decision Making -
Under Certainty, Uncertainty, and Risk
• Assume complete knowledge
• All potential outcomes are known
• May yield optimal solution
• Assume complete knowledge
• All potential outcomes are known
• May yield optimal solution
Certainty
Certainty
•Several outcomes for each decision
•Probability of each outcome is unknown
•Knowledge would lead to less uncertainty
•Several outcomes for each decision
•Probability of each outcome is unknown
•Knowledge would lead to less uncertainty
Uncertainty
Uncertainty
• Considering several possible outcomes for
each alternative
• The long-run probabilities that the given
outcomes will occur are assumed to be known.
• Considering several possible outcomes for
each alternative
• The long-run probabilities that the given
outcomes will occur are assumed to be known.
Under Risk
Under Risk
Modeling and Decision Making -
Under Certainty, Uncertainty, and Risk
The zones of decision making
Decision Modeling with Spreadsheets
• Spreadsheet
– Most popular end-user modeling tool
– Flexible and easy to use
– Powerful functions (add-in functions)
– Programmability
– What-if analysis and goal seeking
– Simple database management
– Seamless integration of model and data
– Example: Microsoft Excel
Case 6.4: Pennsylvania Adoption Exchange Uses
Spreadsheet Model to Better Match Children with
Families
• Challenge: PAE had a system that was complex and
antiquated, and did not provide good match information for
adoptions.
• Solution: The new spreadsheet-based tool allows for greater
customization of the results and search methodology. It allows
for a weighted model based on the importance of different
attributes, and also allows weight to be given based on the
location of the family and child.
Case 6.5: Metro Meals on Wheels Treasure Valley
Uses Excel to Find Optimal Delivery Routes
• Meals on Wheels is a not-for-profit
organization that delivers approximately
one million meals to homes of older
people in need across the United States.
• A team of volunteer drivers that drive their
personal vehicles each day to deliver
meals to 800 clients along 21 routes and
cover an area of 2,745 square kilometers.
http://www.startribune.com/less-money-more-meals-twin-cities-meals-on-wheels-opens-dedicated-kitchen-in-minneapolis/421238373/
Challenge: The organization was dealing with a very complex
process due to the large volume of meals delivered and the time
sensitivity of delivering those meals. Existing procedures are very
time intensive in order to meet the organization's needs.
Case 6.5: Metro Meals on Wheels Treasure Valley
Uses Excel to Find Optimal Delivery Routes
• Solution: The spreadsheet managed each
client’s information, particularly their
address. The spreadsheet then used an
application programming interface (API) to
connect to a map service. This allowed for
the calculation of the most efficient routes
based on the actual location of each
client.
 As a result of using this tool,
the total annual driving
distance decreased by
10,000 miles, while travel
time was reduced by 530
hours.
• Decision Modeling with Spreadsheets
• Mathematical Programming Optimization
• Multiple Goals, Sensitivity Analysis, What-If
Analysis and Goal Seeking
Decision Analysis with Decision Tables and
Decision Trees
• Decision situations that involve a finite and usually not too
large number of alternatives are modeled through an
approach called decision analysis.
• Alternatives are listed in a table or a graph
Decision Analysis with Decision Tables and
Decision Trees
• Decision Tables – a tabular representation of the decision
situation (alternatives)
Condition
Food prompt
Food tasty
Actions
Complain
Tell your friends
Write positive
review
Decision Analysis with Decision Tables and
Decision Trees
• Decision Trees
Prompt Tasty
Y
N
Y
N
Y
N
Action
Tell friends,
positive review
Do nothing
Tell friends
Complain
https://www.youtube.com/watch?v=A5-w3mof-3I
Decision Trees
• Graphical representation of relationships
• Demonstrates complex relationships
• Cumbersome, if many alternatives
exist
• Many tools exist:
o Mind Tools Ltd., mindtools.com
o TreeAge Software Inc., treeage.com
o Palisade Corp., palisade.com
Decision Table - Investment Example: Possible
Situations
1. If solid growth in the economy, bonds yield 12%; stocks
15%; time deposits 6.5%
2. If stagnation, bonds yield 6%; stocks 3%; time deposits
6.5%
3. If inflation, bonds yield 3%; stocks lose 2%; time deposits
yield 6.5%
Investment example:
Goal: maximize the yield after one year
Yield depends on the status of the economy
• Solid growth
• Stagnation
• Inflation
Decision Table
Investment Example: Decision Table
Tabular representation
Alternative Solid Growth (%) Stagnation (%) Inflation (%)
Bonds 12.0 6.0 3.0
Stocks 15.0 3.0 –2.0
Time deposits 6.5 6.5 6.5
 Treating Uncertainty: Optimistic approach vs. pessimistic
approach
Decision Table
• Treating Risk:
– Use known probabilities (expected values)
– E.g., the chance of solid growth at 50%, the
chance of stagnation at 30%, and the chance of
inflation at 20%.
Decision Table
Investment Example: Decision Table
Tabular representation
Alternative Solid Growth (%) Stagnation (%) Inflation (%)
Bonds 12.0 (0.5) 6.0 (0.3) 3.0 (0.2)
Stocks 15.0 (0.5) 3.0 (0.3) –2.0 (0.2)
Time deposits 6.5 (0.5) 6.5 (0.3) 6.5 (0.2)
Simulation
• Simulation is the “appearance” of reality
• It is often used to conduct what-if analysis on the model of
the actual system
• It is a popular DSS technique for conducting experiments
with a computer
• Often used when the system is too complex for other DSS
techniques
Simulation
https://www.youtube.com/watch?v=-6qlX_ihOwQ
• Imitates reality and captures its richness both in
shape and behavior
– “Represent” versus “Imitate”
• Technique for conducting experiments
• Often to “solve” [i.e., analyze] very complex
systems/problems
• Simulation should be used only when a numerical
optimization is not possible
Major Characteristics of Simulation
Advantages of Simulation
• It is fairly straightforward
• Experiment with different alternatives
• Can handle wide variety of problem types
• Can include the real complexities of problems
• Produces important performance measures
• Often it is the only DSS modeling tool for non-structured
problems
Disadvantages of Simulation
• Cannot guarantee an optimal solution, but relatively
good ones are generally found
• Time-demanding and costly construction process
• Cannot transfer solutions and inferences to solve other
problems (models are problem specific)
• So easy to explain/sell to managers, may lead to
overlooking analytical/optimal solutions
• Software may require special skills/experience
Simulation Methodology
Model Development Steps:
1. Define problem 5. Conduct experiments
2. Construct the model 6. Evaluate results
3. Test and validate model 7. Implement solution
4. Design experiments
• Visual interactive modeling (VIM), also called Visual
Interactive Simulation or Visual Interactive Problem Solving
• Goal is to address conventional simulation modeling
inadequacies
• Uses computer graphics and animation
• Virtual reality
Visual Interactive Simulation (VIS)
https://www.youtube.com/watch?v=HBNH8tzsfVM
Simulation Software
• A comprehensive list can be found at
– orms-today.org/surveys/Simulation/Simulation.html
• Simio LLC, simio.com
• SAS Simulation [SAS OR], sas.com
• Lumina Decision Systems, lumina.com
• Oracle Crystal Ball, oracle.com
• Palisade Corp., palisade.com
• Rockwell Software, arenasimulation.com …
Simulation Software
https://www.youtube.com/watch?v=N-xP2W1wgpI
BSI: Teradata Episode: The Sad Case of StagnoBank
Business Scenario Investigations:
• A large international Bank is in trouble as customer
service is lousy, most marketing offers are rejected by
customers, and the bank has lost its appeal to younger
households. BSI is engaged to work on new ideas for
investments in Better Marketing, Better Customer
Service, and New Mobile Apps.
BSI: Teradata Episode: The Sad Case of StagnoBank
https://www.youtube.com/watch?v=MScwTqhM3TI
BSI: Teradata Episode: The Sad Case of StagnoBank
Chapter_6_Prescriptive_Analytics_Optimization_and_Simulation.pptx.pdf
Chapter 6- Review
Prescriptive Analytics: Optimization and
Simulation

More Related Content

DOCX
Chapter 9Model-Based Decision Making Optimization and Multi-.docx
PPT
Introduction to Decision Science
PPTX
Ch9_Model Bases Decision Making Turban.pptx
DOCX
httphome.ubalt.eduntsbarshbusiness-statoprepartIX.htmTool.docx
PDF
1-2 Introduction to MS.pdf
PDF
Business Intelligence Analytics and Data Science A Managerial Perspective 4th...
PPTX
chapter_1_UGBA.pptx
PPTX
Prescriptive analytics BA4206 Anna University PPT
Chapter 9Model-Based Decision Making Optimization and Multi-.docx
Introduction to Decision Science
Ch9_Model Bases Decision Making Turban.pptx
httphome.ubalt.eduntsbarshbusiness-statoprepartIX.htmTool.docx
1-2 Introduction to MS.pdf
Business Intelligence Analytics and Data Science A Managerial Perspective 4th...
chapter_1_UGBA.pptx
Prescriptive analytics BA4206 Anna University PPT

Similar to Chapter_6_Prescriptive_Analytics_Optimization_and_Simulation.pptx.pdf (20)

PPTX
QT final.pptx
PPT
01 intro qa
PPTX
Synthesis of analytical methods data driven decision-making
PPTX
Predictive Analytics Predictive Analytics
PPTX
Modeling and analysis
PPTX
Introduction to Business Analytics.pptxx
PPTX
Prescriptive Analytics.pptx
PPTX
Introduction to Management Science and Linear Programming
PPTX
BA notes unit - V.pptx y
PPT
Lecture notes about system analysis 7.ppt
PPT
Operation research complete note
PPT
MIS Wk-10.ppt
PDF
PDF
Operations research
PPTX
Fundamentals of Quantitative Analysis
PPT
Bba 3274 qm week 1 introduction
PPTX
chapter 1.pptx
PDF
Lesson1.2.pptx.pdf
PPTX
BA4206 UNIT 5.ppt business analytics ppt
PPTX
Lesson 8 the Prescriptive-Analytics.pptx
QT final.pptx
01 intro qa
Synthesis of analytical methods data driven decision-making
Predictive Analytics Predictive Analytics
Modeling and analysis
Introduction to Business Analytics.pptxx
Prescriptive Analytics.pptx
Introduction to Management Science and Linear Programming
BA notes unit - V.pptx y
Lecture notes about system analysis 7.ppt
Operation research complete note
MIS Wk-10.ppt
Operations research
Fundamentals of Quantitative Analysis
Bba 3274 qm week 1 introduction
chapter 1.pptx
Lesson1.2.pptx.pdf
BA4206 UNIT 5.ppt business analytics ppt
Lesson 8 the Prescriptive-Analytics.pptx
Ad

Recently uploaded (20)

PPTX
Qualitative Qantitative and Mixed Methods.pptx
PPTX
AI Strategy room jwfjksfksfjsjsjsjsjfsjfsj
PPT
ISS -ESG Data flows What is ESG and HowHow
PPT
Reliability_Chapter_ presentation 1221.5784
PPTX
Supervised vs unsupervised machine learning algorithms
PPTX
Database Infoormation System (DBIS).pptx
PPTX
Introduction to Basics of Ethical Hacking and Penetration Testing -Unit No. 1...
PDF
Foundation of Data Science unit number two notes
PPTX
Computer network topology notes for revision
PPTX
DISORDERS OF THE LIVER, GALLBLADDER AND PANCREASE (1).pptx
PPTX
oil_refinery_comprehensive_20250804084928 (1).pptx
PPTX
STUDY DESIGN details- Lt Col Maksud (21).pptx
PPTX
The THESIS FINAL-DEFENSE-PRESENTATION.pptx
PPTX
1_Introduction to advance data techniques.pptx
PPTX
iec ppt-1 pptx icmr ppt on rehabilitation.pptx
PDF
.pdf is not working space design for the following data for the following dat...
PPTX
Introduction to machine learning and Linear Models
PPTX
Introduction-to-Cloud-ComputingFinal.pptx
PPT
Quality review (1)_presentation of this 21
PPTX
Microsoft-Fabric-Unifying-Analytics-for-the-Modern-Enterprise Solution.pptx
Qualitative Qantitative and Mixed Methods.pptx
AI Strategy room jwfjksfksfjsjsjsjsjfsjfsj
ISS -ESG Data flows What is ESG and HowHow
Reliability_Chapter_ presentation 1221.5784
Supervised vs unsupervised machine learning algorithms
Database Infoormation System (DBIS).pptx
Introduction to Basics of Ethical Hacking and Penetration Testing -Unit No. 1...
Foundation of Data Science unit number two notes
Computer network topology notes for revision
DISORDERS OF THE LIVER, GALLBLADDER AND PANCREASE (1).pptx
oil_refinery_comprehensive_20250804084928 (1).pptx
STUDY DESIGN details- Lt Col Maksud (21).pptx
The THESIS FINAL-DEFENSE-PRESENTATION.pptx
1_Introduction to advance data techniques.pptx
iec ppt-1 pptx icmr ppt on rehabilitation.pptx
.pdf is not working space design for the following data for the following dat...
Introduction to machine learning and Linear Models
Introduction-to-Cloud-ComputingFinal.pptx
Quality review (1)_presentation of this 21
Microsoft-Fabric-Unifying-Analytics-for-the-Modern-Enterprise Solution.pptx
Ad

Chapter_6_Prescriptive_Analytics_Optimization_and_Simulation.pptx.pdf

  • 2. • Understand the applications of prescriptive analytics techniques in combination with reporting and predictive analytics • Understand the basic concepts of analytical decision modeling • Understand the concepts of analytical models for selected decision problems, including linear programming and simulation models for decision support • Describe how spreadsheets can be used for analytical modeling and solutions • Explain the basic concepts of optimization and when to use them • Describe how to structure a linear programming model • Explain what is meant by sensitivity analysis, what-if analysis, and goal seeking • Understand the concepts and applications of different types of simulation • Understand potential applications of discrete event simulation
  • 3. School District of Philadelphia Uses Prescriptive Analytics to Find Optimal Solution for Awarding Bus Route Contracts • The School District of Philadelphia was in search of private bus vendors to outsource some of their bus routes. • The vendors were evaluated based on five variables: cost, capabilities, reliance, financial stability, and business acumen.
  • 4. School District of Philadelphia Uses Prescriptive Analytics to Find Optimal Solution for Awarding Bus Route Contracts • Solution: The school created an optimization model (using Solver analytic tool in Excel) that took into account the aforementioned variables associated with each vendor. • Benefits: In addition to determining how many of the vendors should be awarded contracts, the model helped develop the size of each of the contracts. • The size of the contracts varied from one vendor getting 4 routes to another receiving 97 routes.
  • 5. What can We Learn from this Case? Most organizations face the problem of making decisions where one has to select from multiple options. Each option has a cost and capability associated with it. The goal is to select the combination of options that meet all the requirements and yet optimizes the costs. Most organizations face the problem of making decisions where one has to select from multiple options. Each option has a cost and capability associated with it. The goal is to select the combination of options that meet all the requirements and yet optimizes the costs.
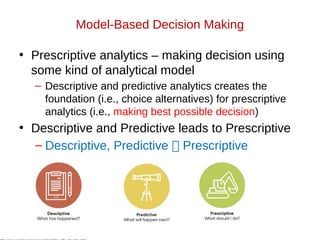
  • 6. Model-Based Decision Making • Prescriptive analytics – making decision using some kind of analytical model – Descriptive and predictive analytics creates the foundation (i.e., choice alternatives) for prescriptive analytics (i.e., making best possible decision) • Descriptive and Predictive leads to Prescriptive – Descriptive, Predictive  Prescriptive
  • 7. Model-Based Decision Making • Example – Profit maximization based on product/service pricing. – Which customers should receive certain promotional offers to maximize overall response (while staying within a pre-specified budget).
  • 9. Case 6.1: Optimal Transport for ExxonMobil Downstream through a Decision Support System (DSS) ExxonMobil provides several ranges of petroleum products, including clean fuels, lubricants, and high-value products and feedstock to several customers. Challenge: The manual process could not determine the actual routes of vessels, the timing of each vessel, and the quantity of vacuum gas oil loaded and discharged. Solution: the company used mathematical programming language, GAMS, to make strategic business decisions in terms of the type of ships it uses, the types of cargo it carries, the volume of cargo it carries, and the ports that it works with most frequently. https://www.google.ca/url?sa=i&rct=j&q=&esrc=s&source=images&cd=&ved=2ahUKEwi6qK_eqNPZAhVV_WMKHYr0CVQQjRx6BAgAEAY&url=https%3A%2F%2Fwww.offshoreenergytoday.com%2F
  • 10. Identification of the Problem • Environmental analysis (information collection) • Variable identification • Forecasting (predictive analytics) – More information leads to better forecast/prediction Mathematical modeling is a key element to prescriptive analytics
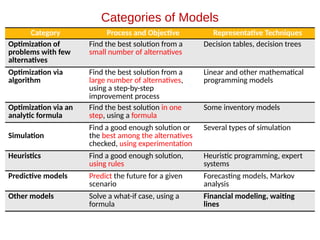
  • 11. Category Process and Objective Representative Techniques Optimization of problems with few alternatives Find the best solution from a small number of alternatives Decision tables, decision trees Optimization via algorithm Find the best solution from a large number of alternatives, using a step-by-step improvement process Linear and other mathematical programming models Optimization via an analytic formula Find the best solution in one step, using a formula Some inventory models Simulation Find a good enough solution or the best among the alternatives checked, using experimentation Several types of simulation Heuristics Find a good enough solution, using rules Heuristic programming, expert systems Predictive models Predict the future for a given scenario Forecasting models, Markov analysis Other models Solve a what-if case, using a formula Financial modeling, waiting lines Categories of Models
  • 12. • Quantitative Models: Mathematically links decision variables, uncontrollable variables, and result variables Structure of Mathematical Models for Decision Support Independent Variables Dependent Variable
  • 13. Area Decision Variables Result Variables Uncontrollable Variables and Parameters Financial investment • Investment alternatives and amounts • Total profit • Rate of return on investment • Liquidity level • Inflation rate • Prime interest rate • Competition Marketing • Advertising budget • Where to advertise • Market share • Customer satisfaction • Customer’s income • Competitor’s actions Manufacturing • What and how much to produce • Inventory levels • Compensation programs • Total cost • Quality level • Employee satisfaction • Machine capacity • Materials prices Structure of Mathematical Models for Decision Support
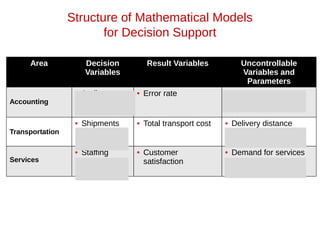
  • 14. Area Decision Variables Result Variables Uncontrollable Variables and Parameters Accounting • Audit schedule • Error rate • Tax rates • Legal requirements Transportation • Shipments schedule • Total transport cost • Delivery distance • Regulations Services • Staffing levels • Customer satisfaction • Demand for services Structure of Mathematical Models for Decision Support
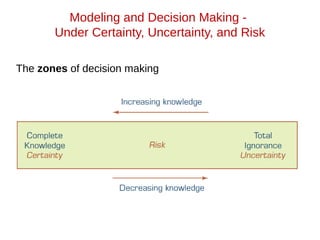
  • 15. Modeling and Decision Making - Under Certainty, Uncertainty, and Risk • Assume complete knowledge • All potential outcomes are known • May yield optimal solution • Assume complete knowledge • All potential outcomes are known • May yield optimal solution Certainty Certainty •Several outcomes for each decision •Probability of each outcome is unknown •Knowledge would lead to less uncertainty •Several outcomes for each decision •Probability of each outcome is unknown •Knowledge would lead to less uncertainty Uncertainty Uncertainty • Considering several possible outcomes for each alternative • The long-run probabilities that the given outcomes will occur are assumed to be known. • Considering several possible outcomes for each alternative • The long-run probabilities that the given outcomes will occur are assumed to be known. Under Risk Under Risk
  • 16. Modeling and Decision Making - Under Certainty, Uncertainty, and Risk The zones of decision making
  • 17. Decision Modeling with Spreadsheets • Spreadsheet – Most popular end-user modeling tool – Flexible and easy to use – Powerful functions (add-in functions) – Programmability – What-if analysis and goal seeking – Simple database management – Seamless integration of model and data – Example: Microsoft Excel
  • 18. Case 6.4: Pennsylvania Adoption Exchange Uses Spreadsheet Model to Better Match Children with Families • Challenge: PAE had a system that was complex and antiquated, and did not provide good match information for adoptions. • Solution: The new spreadsheet-based tool allows for greater customization of the results and search methodology. It allows for a weighted model based on the importance of different attributes, and also allows weight to be given based on the location of the family and child.
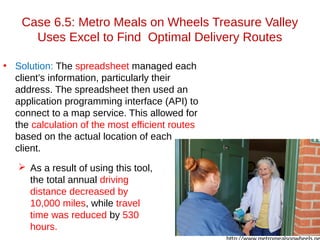
  • 19. Case 6.5: Metro Meals on Wheels Treasure Valley Uses Excel to Find Optimal Delivery Routes • Meals on Wheels is a not-for-profit organization that delivers approximately one million meals to homes of older people in need across the United States. • A team of volunteer drivers that drive their personal vehicles each day to deliver meals to 800 clients along 21 routes and cover an area of 2,745 square kilometers. http://www.startribune.com/less-money-more-meals-twin-cities-meals-on-wheels-opens-dedicated-kitchen-in-minneapolis/421238373/ Challenge: The organization was dealing with a very complex process due to the large volume of meals delivered and the time sensitivity of delivering those meals. Existing procedures are very time intensive in order to meet the organization's needs.
  • 20. Case 6.5: Metro Meals on Wheels Treasure Valley Uses Excel to Find Optimal Delivery Routes • Solution: The spreadsheet managed each client’s information, particularly their address. The spreadsheet then used an application programming interface (API) to connect to a map service. This allowed for the calculation of the most efficient routes based on the actual location of each client.  As a result of using this tool, the total annual driving distance decreased by 10,000 miles, while travel time was reduced by 530 hours.
  • 21. • Decision Modeling with Spreadsheets • Mathematical Programming Optimization • Multiple Goals, Sensitivity Analysis, What-If Analysis and Goal Seeking
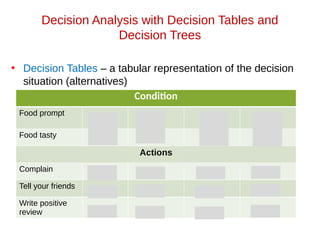
  • 22. Decision Analysis with Decision Tables and Decision Trees • Decision situations that involve a finite and usually not too large number of alternatives are modeled through an approach called decision analysis. • Alternatives are listed in a table or a graph
  • 23. Decision Analysis with Decision Tables and Decision Trees • Decision Tables – a tabular representation of the decision situation (alternatives) Condition Food prompt Food tasty Actions Complain Tell your friends Write positive review
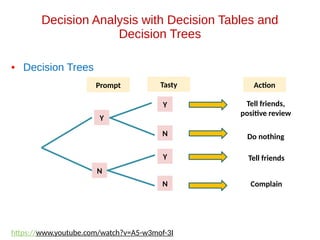
  • 24. Decision Analysis with Decision Tables and Decision Trees • Decision Trees Prompt Tasty Y N Y N Y N Action Tell friends, positive review Do nothing Tell friends Complain https://www.youtube.com/watch?v=A5-w3mof-3I
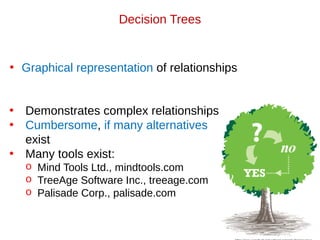
  • 25. Decision Trees • Graphical representation of relationships • Demonstrates complex relationships • Cumbersome, if many alternatives exist • Many tools exist: o Mind Tools Ltd., mindtools.com o TreeAge Software Inc., treeage.com o Palisade Corp., palisade.com
  • 26. Decision Table - Investment Example: Possible Situations 1. If solid growth in the economy, bonds yield 12%; stocks 15%; time deposits 6.5% 2. If stagnation, bonds yield 6%; stocks 3%; time deposits 6.5% 3. If inflation, bonds yield 3%; stocks lose 2%; time deposits yield 6.5% Investment example: Goal: maximize the yield after one year Yield depends on the status of the economy • Solid growth • Stagnation • Inflation
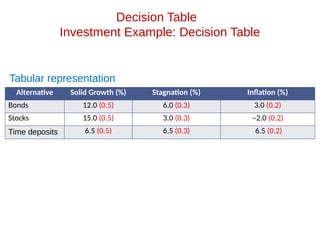
  • 27. Decision Table Investment Example: Decision Table Tabular representation Alternative Solid Growth (%) Stagnation (%) Inflation (%) Bonds 12.0 6.0 3.0 Stocks 15.0 3.0 –2.0 Time deposits 6.5 6.5 6.5  Treating Uncertainty: Optimistic approach vs. pessimistic approach
  • 28. Decision Table • Treating Risk: – Use known probabilities (expected values) – E.g., the chance of solid growth at 50%, the chance of stagnation at 30%, and the chance of inflation at 20%.
  • 29. Decision Table Investment Example: Decision Table Tabular representation Alternative Solid Growth (%) Stagnation (%) Inflation (%) Bonds 12.0 (0.5) 6.0 (0.3) 3.0 (0.2) Stocks 15.0 (0.5) 3.0 (0.3) –2.0 (0.2) Time deposits 6.5 (0.5) 6.5 (0.3) 6.5 (0.2)
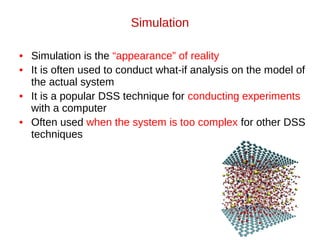
  • 30. Simulation • Simulation is the “appearance” of reality • It is often used to conduct what-if analysis on the model of the actual system • It is a popular DSS technique for conducting experiments with a computer • Often used when the system is too complex for other DSS techniques
  • 32. • Imitates reality and captures its richness both in shape and behavior – “Represent” versus “Imitate” • Technique for conducting experiments • Often to “solve” [i.e., analyze] very complex systems/problems • Simulation should be used only when a numerical optimization is not possible Major Characteristics of Simulation
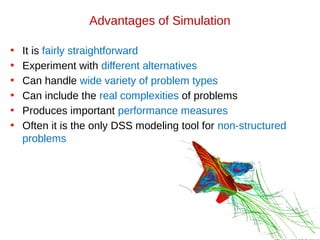
  • 33. Advantages of Simulation • It is fairly straightforward • Experiment with different alternatives • Can handle wide variety of problem types • Can include the real complexities of problems • Produces important performance measures • Often it is the only DSS modeling tool for non-structured problems
  • 34. Disadvantages of Simulation • Cannot guarantee an optimal solution, but relatively good ones are generally found • Time-demanding and costly construction process • Cannot transfer solutions and inferences to solve other problems (models are problem specific) • So easy to explain/sell to managers, may lead to overlooking analytical/optimal solutions • Software may require special skills/experience
  • 35. Simulation Methodology Model Development Steps: 1. Define problem 5. Conduct experiments 2. Construct the model 6. Evaluate results 3. Test and validate model 7. Implement solution 4. Design experiments
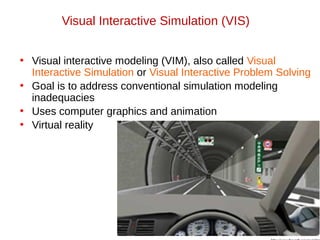
  • 36. • Visual interactive modeling (VIM), also called Visual Interactive Simulation or Visual Interactive Problem Solving • Goal is to address conventional simulation modeling inadequacies • Uses computer graphics and animation • Virtual reality Visual Interactive Simulation (VIS)
  • 37. Visual Interactive Simulation (VIS) https://www.youtube.com/watch?v=HBNH8tzsfVM
  • 38. Simulation Software • A comprehensive list can be found at – orms-today.org/surveys/Simulation/Simulation.html • Simio LLC, simio.com • SAS Simulation [SAS OR], sas.com • Lumina Decision Systems, lumina.com • Oracle Crystal Ball, oracle.com • Palisade Corp., palisade.com • Rockwell Software, arenasimulation.com …
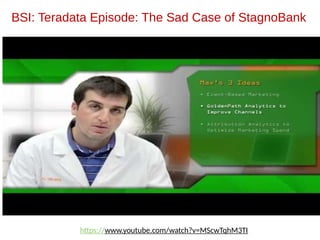
  • 40. BSI: Teradata Episode: The Sad Case of StagnoBank Business Scenario Investigations: • A large international Bank is in trouble as customer service is lousy, most marketing offers are rejected by customers, and the bank has lost its appeal to younger households. BSI is engaged to work on new ideas for investments in Better Marketing, Better Customer Service, and New Mobile Apps.
  • 41. BSI: Teradata Episode: The Sad Case of StagnoBank https://www.youtube.com/watch?v=MScwTqhM3TI
  • 42. BSI: Teradata Episode: The Sad Case of StagnoBank
  • 44. Chapter 6- Review Prescriptive Analytics: Optimization and Simulation