SlideShare a Scribd company logo
Data-driven modeling
                                           APAM E4990


                                           Jake Hofman

                                          Columbia University


                                           April 9, 2012


Jake Hofman   (Columbia University)        Data-driven modeling   April 9, 2012   1 / 11
Clustering images


         Clustering is an unsupervised learning task by which we look for
            structure in the data, grouping similar examples together


                 e.g., find groups of similar pixels within a single image


Jake Hofman   (Columbia University)   Data-driven modeling             April 9, 2012   2 / 11
Clustering images


         Clustering is an unsupervised learning task by which we look for
            structure in the data, grouping similar examples together


          e.g., find groups of similar images across a collection of images


Jake Hofman   (Columbia University)   Data-driven modeling         April 9, 2012   2 / 11
K-means clustering
              K-means: represent each cluster by the average of its points


         Learn by iteratively updating cluster means and point assigments

Jake Hofman   (Columbia University)   Data-driven modeling           April 9, 2012   3 / 11
K-means clustering


 K-means:
 Choose number of clusters
 Initialize cluster centers
 While not converged:
   Assign each point to closest
 cluster
   Update cluster centers


Jake Hofman   (Columbia University)   Data-driven modeling   April 9, 2012   4 / 11
K-means clustering


 K-means:
 Choose number of clusters
 Initialize cluster centers
 While not converged:
   Assign each point to closest
 cluster
   Update cluster centers


Jake Hofman   (Columbia University)   Data-driven modeling   April 9, 2012   4 / 11
K-means clustering


 K-means:
 Choose number of clusters
 Initialize cluster centers
 While not converged:
   Assign each point to closest
 cluster
   Update cluster centers


Jake Hofman   (Columbia University)   Data-driven modeling   April 9, 2012   4 / 11
K-means clustering


 K-means:
 Choose number of clusters
 Initialize cluster centers
 While not converged:
   Assign each point to closest
 cluster
   Update cluster centers


Jake Hofman   (Columbia University)   Data-driven modeling   April 9, 2012   4 / 11
K-means clustering


 K-means:
 Choose number of clusters
 Initialize cluster centers
 While not converged:
   Assign each point to closest
 cluster
   Update cluster centers


Jake Hofman   (Columbia University)   Data-driven modeling   April 9, 2012   4 / 11
Clustering pixels


                     Find groups of similar pixels within a single image
                              (e.g. “the bright red circles”)


                          Represent each pixel as a separate example
                         with its (R,G,B) value as a 3-d feature vector


Jake Hofman   (Columbia University)      Data-driven modeling              April 9, 2012   5 / 11
Images as arrays
          Color images ↔ 3-d arrays of M × N × 3 RGB pixel intensities


       import matplotlib . image as mpimg
       I = mpimg . imread ( ' chairs . jpg ')

Jake Hofman   (Columbia University)   Data-driven modeling      April 9, 2012   6 / 11
Images as arrays
          Color images ↔ 3-d arrays of M × N × 3 RGB pixel intensities


       import matplotlib . image as mpimg
       I = mpimg . imread ( ' chairs . jpg ')


Jake Hofman   (Columbia University)   Data-driven modeling      April 9, 2012   6 / 11
Clustering pixels

       Group pixels within candy.jpg into 7 clusters
          ./ cluster_pixels . py candy . jpg 7


Jake Hofman   (Columbia University)   Data-driven modeling   April 9, 2012   7 / 11
Clustering images


               Find groups of similar images within a collection of images
                                 (e.g. “warm” photos)


              Represent each image with a binned RGB intensity histogram


Jake Hofman    (Columbia University)   Data-driven modeling          April 9, 2012   8 / 11
Intensity histograms

        Disregard all spatial information, simply count pixels by intensities
               (e.g. lots of pixels with bright green and dark blue)


Jake Hofman   (Columbia University)   Data-driven modeling          April 9, 2012   9 / 11
Intensity histograms


                                How many bins for pixel intensities?


        Too many bins gives a noisy, overly complex representation of
       the data, while using too few bins results in an overly simple one


Jake Hofman   (Columbia University)        Data-driven modeling        April 9, 2012   10 / 11
Clustering images

       Group ’vivid’ images into 3 clusters
          ./ cluster_flickr . py flickr_vivid 7 10


Jake Hofman   (Columbia University)   Data-driven modeling   April 9, 2012   11 / 11

More Related Content

PDF
Data-driven modeling: Lecture 02
PDF
Data-driven modeling: Lecture 09
PDF
Data-driven modeling: Lecture 01
PDF
Data-driven Modeling: Lecture 03
PDF
Using Data to Understand the Brain
PDF
Large-scale social media analysis with Hadoop
PPTX
Dynamic and Static Modeling
PPS
Data-driven modeling: Lecture 02
Data-driven modeling: Lecture 09
Data-driven modeling: Lecture 01
Data-driven Modeling: Lecture 03
Using Data to Understand the Brain
Large-scale social media analysis with Hadoop
Dynamic and Static Modeling

Viewers also liked (20)

KEY
1강 기업교육론 20110302
PPT
Verkiezing schaduwburgemeester dorpscafé malden ruud van gisteren d.d. 3 3-20...
PPT
Zeynep asa 2011 privacy
PPS
PDF
Hieu qua san xuat bap lai tren dat lua Dong bang song Cuu Long-TS. Ho Cao Viet
PDF
Modeling Social Data, Lecture 1: Case Studies
PPS
κινα νο 3
PPT
Collective action under autocracies
PPSX
Greek islands !!
PDF
Dynamics of household africa
PDF
The Voice 2000 edition
PPTX
PPTX
Прориси
PPS
Pps delz@-forbidden city-reissue 2011
PDF
Costing System example מערכת תמחיר - דוגמא
PDF
Socioeconomic Transformations in the Atlantic World from 1492 1750 CE Due to ...
PPTX
Introduction to Steens Furniture
PPTX
11강 기업교육론 20110518
PPS
Luciano pavarotti chitarra romana
1강 기업교육론 20110302
Verkiezing schaduwburgemeester dorpscafé malden ruud van gisteren d.d. 3 3-20...
Zeynep asa 2011 privacy
Hieu qua san xuat bap lai tren dat lua Dong bang song Cuu Long-TS. Ho Cao Viet
Modeling Social Data, Lecture 1: Case Studies
κινα νο 3
Collective action under autocracies
Greek islands !!
Dynamics of household africa
The Voice 2000 edition
Прориси
Pps delz@-forbidden city-reissue 2011
Costing System example מערכת תמחיר - דוגמא
Socioeconomic Transformations in the Atlantic World from 1492 1750 CE Due to ...
Introduction to Steens Furniture
11강 기업교육론 20110518
Luciano pavarotti chitarra romana
Ad

More from jakehofman (20)

PPTX
Modeling Social Data, Lecture 12: Causality & Experiments, Part 2
PPTX
Modeling Social Data, Lecture 11: Causality and Experiments, Part 1
PDF
Modeling Social Data, Lecture 10: Networks
PDF
Modeling Social Data, Lecture 8: Classification
PDF
Modeling Social Data, Lecture 7: Model complexity and generalization
PDF
Modeling Social Data, Lecture 6: Regression, Part 1
PDF
Modeling Social Data, Lecture 4: Counting at Scale
PDF
Modeling Social Data, Lecture 3: Data manipulation in R
PDF
Modeling Social Data, Lecture 2: Introduction to Counting
PDF
Modeling Social Data, Lecture 1: Overview
PDF
Modeling Social Data, Lecture 8: Recommendation Systems
PDF
Modeling Social Data, Lecture 6: Classification with Naive Bayes
PDF
Modeling Social Data, Lecture 3: Counting at Scale
PDF
Modeling Social Data, Lecture 2: Introduction to Counting
PDF
NYC Data Science Meetup: Computational Social Science
PDF
Computational Social Science, Lecture 13: Classification
PDF
Computational Social Science, Lecture 11: Regression
PDF
Computational Social Science, Lecture 10: Online Experiments
PDF
Computational Social Science, Lecture 09: Data Wrangling
PDF
Computational Social Science, Lecture 08: Counting Fast, Part II
Modeling Social Data, Lecture 12: Causality & Experiments, Part 2
Modeling Social Data, Lecture 11: Causality and Experiments, Part 1
Modeling Social Data, Lecture 10: Networks
Modeling Social Data, Lecture 8: Classification
Modeling Social Data, Lecture 7: Model complexity and generalization
Modeling Social Data, Lecture 6: Regression, Part 1
Modeling Social Data, Lecture 4: Counting at Scale
Modeling Social Data, Lecture 3: Data manipulation in R
Modeling Social Data, Lecture 2: Introduction to Counting
Modeling Social Data, Lecture 1: Overview
Modeling Social Data, Lecture 8: Recommendation Systems
Modeling Social Data, Lecture 6: Classification with Naive Bayes
Modeling Social Data, Lecture 3: Counting at Scale
Modeling Social Data, Lecture 2: Introduction to Counting
NYC Data Science Meetup: Computational Social Science
Computational Social Science, Lecture 13: Classification
Computational Social Science, Lecture 11: Regression
Computational Social Science, Lecture 10: Online Experiments
Computational Social Science, Lecture 09: Data Wrangling
Computational Social Science, Lecture 08: Counting Fast, Part II
Ad

Recently uploaded (20)

PPTX
Pharma ospi slides which help in ospi learning
PPTX
master seminar digital applications in india
PDF
Saundersa Comprehensive Review for the NCLEX-RN Examination.pdf
PDF
TR - Agricultural Crops Production NC III.pdf
PPTX
PPH.pptx obstetrics and gynecology in nursing
PDF
Basic Mud Logging Guide for educational purpose
PPTX
1st Inaugural Professorial Lecture held on 19th February 2020 (Governance and...
PDF
102 student loan defaulters named and shamed – Is someone you know on the list?
PDF
Complications of Minimal Access Surgery at WLH
PDF
BÀI TẬP BỔ TRỢ 4 KỸ NĂNG TIẾNG ANH 9 GLOBAL SUCCESS - CẢ NĂM - BÁM SÁT FORM Đ...
PPTX
Lesson notes of climatology university.
PPTX
Final Presentation General Medicine 03-08-2024.pptx
PDF
O7-L3 Supply Chain Operations - ICLT Program
PDF
2.FourierTransform-ShortQuestionswithAnswers.pdf
PDF
Physiotherapy_for_Respiratory_and_Cardiac_Problems WEBBER.pdf
PDF
ANTIBIOTICS.pptx.pdf………………… xxxxxxxxxxxxx
PDF
Abdominal Access Techniques with Prof. Dr. R K Mishra
PDF
Module 4: Burden of Disease Tutorial Slides S2 2025
PDF
O5-L3 Freight Transport Ops (International) V1.pdf
PDF
STATICS OF THE RIGID BODIES Hibbelers.pdf
Pharma ospi slides which help in ospi learning
master seminar digital applications in india
Saundersa Comprehensive Review for the NCLEX-RN Examination.pdf
TR - Agricultural Crops Production NC III.pdf
PPH.pptx obstetrics and gynecology in nursing
Basic Mud Logging Guide for educational purpose
1st Inaugural Professorial Lecture held on 19th February 2020 (Governance and...
102 student loan defaulters named and shamed – Is someone you know on the list?
Complications of Minimal Access Surgery at WLH
BÀI TẬP BỔ TRỢ 4 KỸ NĂNG TIẾNG ANH 9 GLOBAL SUCCESS - CẢ NĂM - BÁM SÁT FORM Đ...
Lesson notes of climatology university.
Final Presentation General Medicine 03-08-2024.pptx
O7-L3 Supply Chain Operations - ICLT Program
2.FourierTransform-ShortQuestionswithAnswers.pdf
Physiotherapy_for_Respiratory_and_Cardiac_Problems WEBBER.pdf
ANTIBIOTICS.pptx.pdf………………… xxxxxxxxxxxxx
Abdominal Access Techniques with Prof. Dr. R K Mishra
Module 4: Burden of Disease Tutorial Slides S2 2025
O5-L3 Freight Transport Ops (International) V1.pdf
STATICS OF THE RIGID BODIES Hibbelers.pdf

Data-driven modeling: Lecture 10

  • 1. Data-driven modeling APAM E4990 Jake Hofman Columbia University April 9, 2012 Jake Hofman (Columbia University) Data-driven modeling April 9, 2012 1 / 11
  • 2. Clustering images Clustering is an unsupervised learning task by which we look for structure in the data, grouping similar examples together e.g., find groups of similar pixels within a single image Jake Hofman (Columbia University) Data-driven modeling April 9, 2012 2 / 11
  • 3. Clustering images Clustering is an unsupervised learning task by which we look for structure in the data, grouping similar examples together e.g., find groups of similar images across a collection of images Jake Hofman (Columbia University) Data-driven modeling April 9, 2012 2 / 11
  • 4. K-means clustering K-means: represent each cluster by the average of its points Learn by iteratively updating cluster means and point assigments Jake Hofman (Columbia University) Data-driven modeling April 9, 2012 3 / 11
  • 5. K-means clustering K-means: Choose number of clusters Initialize cluster centers While not converged: Assign each point to closest cluster Update cluster centers Jake Hofman (Columbia University) Data-driven modeling April 9, 2012 4 / 11
  • 6. K-means clustering K-means: Choose number of clusters Initialize cluster centers While not converged: Assign each point to closest cluster Update cluster centers Jake Hofman (Columbia University) Data-driven modeling April 9, 2012 4 / 11
  • 7. K-means clustering K-means: Choose number of clusters Initialize cluster centers While not converged: Assign each point to closest cluster Update cluster centers Jake Hofman (Columbia University) Data-driven modeling April 9, 2012 4 / 11
  • 8. K-means clustering K-means: Choose number of clusters Initialize cluster centers While not converged: Assign each point to closest cluster Update cluster centers Jake Hofman (Columbia University) Data-driven modeling April 9, 2012 4 / 11
  • 9. K-means clustering K-means: Choose number of clusters Initialize cluster centers While not converged: Assign each point to closest cluster Update cluster centers Jake Hofman (Columbia University) Data-driven modeling April 9, 2012 4 / 11
  • 10. Clustering pixels Find groups of similar pixels within a single image (e.g. “the bright red circles”) Represent each pixel as a separate example with its (R,G,B) value as a 3-d feature vector Jake Hofman (Columbia University) Data-driven modeling April 9, 2012 5 / 11
  • 11. Images as arrays Color images ↔ 3-d arrays of M × N × 3 RGB pixel intensities import matplotlib . image as mpimg I = mpimg . imread ( ' chairs . jpg ') Jake Hofman (Columbia University) Data-driven modeling April 9, 2012 6 / 11
  • 12. Images as arrays Color images ↔ 3-d arrays of M × N × 3 RGB pixel intensities import matplotlib . image as mpimg I = mpimg . imread ( ' chairs . jpg ') Jake Hofman (Columbia University) Data-driven modeling April 9, 2012 6 / 11
  • 13. Clustering pixels Group pixels within candy.jpg into 7 clusters ./ cluster_pixels . py candy . jpg 7 Jake Hofman (Columbia University) Data-driven modeling April 9, 2012 7 / 11
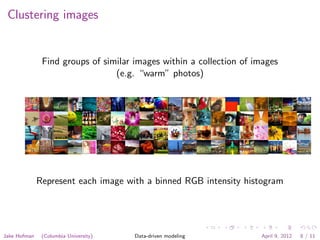
  • 14. Clustering images Find groups of similar images within a collection of images (e.g. “warm” photos) Represent each image with a binned RGB intensity histogram Jake Hofman (Columbia University) Data-driven modeling April 9, 2012 8 / 11
  • 15. Intensity histograms Disregard all spatial information, simply count pixels by intensities (e.g. lots of pixels with bright green and dark blue) Jake Hofman (Columbia University) Data-driven modeling April 9, 2012 9 / 11
  • 16. Intensity histograms How many bins for pixel intensities? Too many bins gives a noisy, overly complex representation of the data, while using too few bins results in an overly simple one Jake Hofman (Columbia University) Data-driven modeling April 9, 2012 10 / 11
  • 17. Clustering images Group ’vivid’ images into 3 clusters ./ cluster_flickr . py flickr_vivid 7 10 Jake Hofman (Columbia University) Data-driven modeling April 9, 2012 11 / 11