Detailed Investment Analysis PowerPoint Presentation Slides
2 likes2,906 views

The document provides a comprehensive analysis of investment strategies, portfolio management, and various financial instruments including stocks, bonds, and mutual funds. It covers detailed market statistics, investment objectives, risks, and financial performance metrics to aid in decision-making. Additionally, it includes technical analyses, valuation methods for equity securities, and insights on market trends and opportunities.


Detailed Investment Analysis PowerPoint Presentation Slides
- 2. Agenda This slide is 100% editable. Adapt it to your needs and capture your audience's attention. To achieve Client’s investment objectives through an individual approach Manage a portfolio of financial instruments and cash funds for a particular investor To analyse and provide information about multiple securities This slide is 100% editable. Adapt it to your needs and capture your audience's attention. This slide is 100% editable. Adapt it to your needs and capture your audience's attention. This slide is 100% editable. Adapt it to your needs and capture your audience's attention. 2
- 3. Table Of Content This slide is 100% editable. Adapt it to your needs and capture your audience's attention. 3 Introduction to investments Derivative Products Analysis and valuation of equity securities Broadening the investment perspective Issues in efficient markets Risk & return analysis Fixed-income and leveraged securities KPI & dashboards
- 4. Introduction to Investments 4 Types of Investment Detailed Investment Options Objectives of Portfolio Management Your objectives here Investment Instruments Fund Categorization and Risk Involved Top Performing Securities in our Portfolio Market Scenario Overview Statistics and Market Size Current Industry Threats and Opportunities
- 5. Objectives Of Portfolio Management 5 Consistency of Returns Provide the stability of returns Text Here This slide is 100% editable. Capital Growth To guarantee the growth of capital by reinvesting or purchase of growth securities Marketability To ensure flexibility in portfolio Liquidity Portfolio ensures that there are enough funds available at short notice. Diversification of Portfolio To reduce risk by investing in different securities
- 6. Types of Investment - Detailed Investment Options Induced Investment Investment which does not change with income level Autonomous Investment Investment which does not change with income level Financial Investment Investment made in buying financial instruments Real Investment Investment made in new plant and equipment Unplanned Investment Investment done without any planning Planned Investment Investment made with a plan in several sectors of the economy Gross Investment Amount spent for creation of new capital assets Net Investment Gross Investment less Capital Consumption during a period of time 6
- 7. Market Scenario Overview – Statistics and Market Size 7 Revenue $274bn Forecast Growth x.x% Profit x.x% Annual Growth 13-18 2.0% Employment 459,448 Business 162,774 This slide is 100% editable. Adapt it to your needs and capture your audience's attention.
- 8. Market Scenario Overview - Current Industry Threats & Opportunities 8 Income generated by the securities held by mutual funds may decline Lack of marketability of an investment Security's issuer or the counter party may unable to meet its obligation Investment's value may change This slide is 100% editable. Adapt it to your needs and capture your audience's attention. This slide is 100% editable. Adapt it to your needs and capture your audience's attention. Increasing disposable income drive industry trends Shifting consumer preferences are driving change in the industry External Growth Opportunities (Mergers and Acquisitions) Internal Growth Opportunities (New markets, new product) Threats Opportunities
- 9. Investment Instruments 9 Stocks Bonds Cash Annuities Real Estate Domestic Options Mutual Funds ETF’s Foreign Emerging Markets Hedge Funds This slide is 100% editable. Adapt it to your needs and capture your audience's attention.
- 10. Investment Instruments-Funds Categorization & Risk Involved 10 Less than 1 months 1 to 9 months 6 months to 3 years 1-3 years <1 years >3 years <3 years >3 years <3 years >3 years <3 years Low risk High risk Liquid funds MIP With Less Than 25% Equity Long Term G- sec Funds Long Term Bond Funds Corporate Bond Funds Short Term Funds Ultra-Short Term Funds Medium to high risk Very high risk Medium to high risk Very high risk Medium to high risk Very high risk Medium risk Very high risk Low risk Low risk Very Low risk
- 11. Top Performing Securities in Our Portfolio 11 Investors Portfolio Investment Percentage(%) Security Returns Government Bonds $2500 75 Mutual Funds $1125 85 Stock NamePortfolio 2 $6589 46 Stock NamePortfolio 2 $4589 88 HighAverageLow This slide is 100% editable. Adapt it to your needs and capture your audience's attention.
- 12. Industry Analysis Porter’s 5 Forces PESTERL Analysis SWOT Analysis Valuation of Equity Securities Discounted Cash Flow Method 12 Financial Statement Analysis P&L (tabular form) Balance Sheet (tabular form) Cash Flow Statement (tabular form Analysis and Valuation of Equity Securities
- 13. Bargaining Power of Buyer (High) Barriers to Entry (Low/Moderate) Competition /Rivalry (High) Bargaining Power of suppliers (High) Threat of Substitutes (High) INDUSTRY ANALYSIS- Porter’s 5 Forces Competitive Forces Model This slide is 100% editable. Adapt it to your needs and capture your audience's attention. 13
- 14. Industry Analysis- Pestel Analysis 14 L Health & Safety Policy Regulation Your text here Your text here Your text here Your text here Legal P Government Policy Foreign Policy Your text here Your text here Your text here Your text here Political E Economic Growth Interest rates Your text here Your text here Your text here Your text here Economic T Goods Production Changing Trends Your text here Your text here Your text here Your text here Technological S Career Attitudes Population Matrix Your text here Your text here Your text here Your text here Social E Pollution Check Healthy Hazards Your text here Your text here Your text here Your text here Environmental
- 15. Industry Analysis- Swot Analysis 15 This slide is 100% editable. Adapt it to your needs and capture your audience's attention. This slide is 100% editable. Adapt it to your needs and capture your audience's attention. This slide is 100% editable. Adapt it to your needs and capture your audience's attention. This slide is 100% editable. Adapt it to your needs and capture your audience's attention.
- 16. This slide is 100% editable. Adapt it to your needs and capture your audience's attention. Valuation of Equity Securities Net Asset Value Method Maintainable Profit Method or Discounted Cash Flows Method Comparable Company Market Multiple Price / Earnings multiple Market Cap/ Sales Multiple Industry Valuation Benchmarks This slide is 100% editable. Adapt it to your needs and capture your audience's attention. 16
- 17. Valuation of Equity Securities - Discounted Cash Flow Method 17 DCF Valuation Projected Free Cash Flow Calendar Years ending December 31, Year 1 Year 2 Year 3 Year 4 Year 5 (S in thousands) EBITDA 6554 1198 11251 5656 45896 Less: D&A 4412 1222 41343 4524 1623 EBIT 7842 9676 6668 4546 11745 Less: Taxes (35%) 2745 3037 3359 3716 4111 Tax Adjusted EBIT 8097 5639 6239 6901 7634 Plus: D&A 1112 1222 5456 1476 1623 Less: Capital Expenditure 1750 1750 1750 1750 1750 Less: Change In Net Working Capital 318 350 384 423 465 Unlevered Free Cash Flow 2132 3256 6658 4598 7042 Perpetuity Growth Rate Approach Discount Rate 11% 12% Perpetuity Growth 5% 2% 8% 4% 2% 8% Terminal Unlevered FCF* $6589 $5689 $2356 $6589 $6589 $6589 Terminal Value $46548 $54879 $25665 $6589 $45896 $36548 This slide is 100% editable. Adapt it to your needs and capture your audience's attention.
- 18. Financial Statement Analysis - P&L Statement (Tabular Form) 18 Q1 FY18 Q2 FY18 Q3 FY18 Q4 FY18 Net Sales 1,526.1 5,042.0 8,184.5 9,476.6 Other Income 3.0 6.9 21.8 61.8 Total Income 2,707.2 9,031.9 9,196.3 3,508.4 Expenses Total Material Consumed 1,282.5 1,374.7 2,028.2 2,200.4 Employee Benefit Expense 92.1 128.4 155.6 226.5 Other Expenses 71.2 167.3 265.6 299.7 EBITDA 961.3 961.6 846.9 381.8 % EBITDA 15.3% 17.8% 23.4% 22.3% Depreciation Expense 28.4 45.8 60.0 69.3 Financing Cost 66.9 128.8 198.1 273.9 Profit Before Tax 226.0 566.9 88.8 438.5 Taxes 4.0 -0.8 138.8 100.8 Profit After Tax 162.0 187.7 350.0 337.7 % PAT 9.5% 9.2% 11.0% 9.6% This slide is 100% editable. Adapt it to your needs and capture your audience's attention.
- 19. Balance Sheet (Tabular Form) 19 All Figures in USD MM Q1 FY18 Q2 FY18 Q3 FY18 Q4 FY18 Shareholders‘ Equity 659.8 2,067.8 5,294.6 3,632.4 Non–Current Liabilities 835.0 548.2 913.5 689.0 Short–Term Borrowings 569.8 722.7 850.6 1,603.8 Trade Payables 352.9 508.9 760.4 433.7 Other Current Liabilities 5.9 147.3 289.5 372.6 Short Term Provisions 21.4 6.2 15.0 28.0 Current Liabilities 820.1 1,285.0 1,785.5 2,438.1 Total Liabilities 2,760.4 3,678.1 4,316.3 5,730.4 This slide is 100% editable. Adapt it to your needs and capture your audience's attention.
- 20. Balance Sheet (Tabular Form) 20 Total Fixed Assets 763.2 2,024.6 3,889.5 8,781.3 Non–Current Investments 46.9 66.8 94.5 26.6 Long Term Loans and Advances - 9.0 63.4 204.8 Other Non–Current Assets - 13.8 - - Current Investments - - - 77.9 Inventories 641.3 991.3 881.3 1,215.8 Trade Receivables 477.6 605.1 996.1 1,061.3 Cash and Bank Balances 93.0 89.5 782.2 358.8 Short–term Loans & Advances 75.8 169.1 76.9 131.6 Other Current Assets 8.9 1.0 6.3 3.4 Current Assets 830.5 1,595.1 1,978.8 2,747.8 Total Assets 2,760.4 8,998.1 6,416.3 4,730.4 This slide is 100% editable. Adapt it to your needs and capture your audience's attention.
- 21. Company Cash Flow Statement (Tabular Form) 21 All Figures in USD MM FY12 FY13 FY14 FY15 Cash Flow from Operations 7,184 5,476 2,621 8,168 Cash Flow from Investing Activities 566 781 888 1,210 Cash Flow from Financing Activities 326 337 666 459 Change in Cash & Cash Equivalents 1,017 1,303 1,490 1,836 This slide is 100% editable. Adapt it to your needs and capture your audience's attention.
- 22. Major Efficient Market Issues Your text here Basic View of Technical Analysis Technical Analysis Types Your text here Investments in Special Situation Your text here 22 Issues in Efficient Markets
- 23. Major Efficient Market Issues 23 Issue 1 Issue 2 Issue 3 Issue 4 Issue 5 Transactions Cost related to exchange of goods and services overcome market imperfections. Regulatory Restrictions that are subject to control and guidelines for efficient market U.S. market interest rates spreads for high-yield and emerging market bonds remain very compressed by historic standards This slide is 100% editable. Adapt it to your needs and capture your audience's attention. This slide is 100% editable. Adapt it to your needs and capture your audience's attention.
- 24. Technical Analysis Types 24 Identify areas of support and resistance on a chart by looking at specific patterns › Your text here Chart Patterns Add chart patterns methodologies here › Your text here Technicians apply various mathematical formulas to prices and volumes › Your text here Add technical indicators methodologies here › Your text here Technical Indicators Key Result Areas ‹ This slide is 100% editable. Adapt it to your needs and capture your audience's attention. Technical Analysis Types
- 25. 25This slide is 100% editable. Adapt it to your needs and capture your audience's attention. Cash Payouts /Acquisitions Large number of companies eventually acquire for a premium by a competitor Litigation Time Market tends to undervalue litigated assets Company Breakups And Spinoffs Part of a larger company that is made to stand on its own as a corporate entity Distressed Debt Investing Financial instruments issued by a company that is near to or currently going through bankruptcy Investments in Special Situation
- 26. Convertible Securities & Warrants Types of Convertible Securities Options Analysis Bond and Fixed-Income Securities BondsFixed Income Securities Overview Top Performing Bonds Bond Valuation Bond Valuation Estimation Bond Valuation Analysis Duration & Reinvestment Duration of a Bond DividendInterest Reinvestment Risk Table 26 Fixed-income and Leveraged Securities
- 27. List of Bond & Fixed Income Securities 27 Types of Bond Types of Fixed Income Securities Your Text Here Securities Your Text Here Treasury Bonds Your Text Here Fixed Deposit Your Text Here U.S. Government Bonds Your Text Here Recurring Deposit Your Text Here Investment-Grade Corporate Bonds Your Text Here Treasury Bills Your Text Here High-Yield Corporate Bonds Your Text Here Certificates of Deposit Your Text Here Foreign Bonds Your Text Here Commercial Paper Your Text Here Mortgage-Backed Bonds Your Text Here Post Office Monthly Income Schemes Your Text Here Municipal Bonds Your Text Here Fixed deposit Your Text Here This slide is 100% editable. Adapt it to your needs and capture your audience's attention.
- 28. Top Performing Bonds 28 Security Holding Period Return Class Bond 1 22% Your Text Here Bond 2 28% Your Text Here Bond 3 13% Your Text Here Bond 4 08% Your Text Here Bond 5 16% Your Text Here Bond 6 11% Your Text Here Bond 8 22% Your Text Here Bond 9 34% Your Text Here Bond 10 48% Your Text Here This slide is 100% editable. Adapt it to your needs and capture your audience's attention.
- 29. Bond Valuation Estimation 29 Time (in years) Cash Flows on Dollar Bond ($) Present Value ($) Cash Flows on Yen Bond Present Value 1 0.7 0.4513 70 67.43 3 0.6 0.2387 70 54.46 2 0.6 0.4671 70 52.24 4 9.0 6.7833 1,100 1,146.20 5 1.5 4.3618 176 34.76 Total - 12.3022 1486 1295.09
- 30. Bond Valuation Analysis 30 Bond Valuation 1 Settlement Date 22/6/2014 2 Maturity Date 22/6/2034 3 First Call Date 2/6/2020 4 Coupon Rate 7.00% 5 YTM 6.00% 6 Face Value $2,500.00 7 Call Price $3,060.00 8 Add Text Here 7 9 Add Text Here 15 10 Add Text Here 3 Return Measures 1 Current Yield 7.45% 2 Yield to Maturity 9.00% 3 Add Text Here 4.00% This slide is 100% editable. Adapt it to your needs and capture your audience's attention.
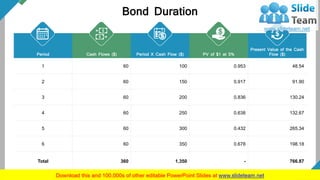
- 31. Bond Duration 31 Period Cash Flows ($) Period X Cash Flow ($) PV of $1 at 5% Present Value of the Cash Flow ($) 1 60 100 0.953 48.54 2 60 150 0.917 91.90 3 60 200 0.836 130.24 4 60 250 0.638 132.67 5 60 300 0.432 265.34 6 60 350 0.678 198.18 Total 360 1,350 - 766.87 This slide is 100% editable. Adapt it to your needs and capture your audience's attention.
- 32. DividendInterest Reinvestment Risk Table 32 Market Interest Rate Investment Horizon Dominance Holding Period > Maturity Period Reinvestment Risk Dominates Interest Rate Risk Holding Period < Maturity Period Interest Rate Risk Dominates Reinvestment Risk Holding Period > Maturity Period Interest Rate Risk Dominates Reinvestment Risk Holding Period < Maturity Period Reinvestment Risk Dominates Interest Rate Risk This slide is 100% editable. Adapt it to your needs and capture your audience's attention.
- 33. Types Of Convertible Securities 33 Convertible Bond This slide is 100% editable. Adapt it to your needs and capture your audience's attention. Convertible Preferred Stock This slide is 100% editable. Adapt it to your needs and capture your audience's attention. Warrant This slide is 100% editable. Adapt it to your needs and capture your audience's attention. Capital Note This slide is 100% editable. Adapt it to your needs and capture your audience's attention. Right Issue This slide is 100% editable. Adapt it to your needs and capture your audience's attention. Add Security Here This slide is 100% editable. Adapt it to your needs and capture your audience's attention. 01 02 03 04 05 06 Convertible Securities Types
- 34. Options Analysis 34 Name Common Preferred A Preferred A Convertibles Option Total Founder 1 5,000,000 4,00,000 5,400,000 Add Text Here 6,500,000 6,500,000 Investor A 1,500,000 1,500,000 Add Text Here 2,150,000 600,000 2,750,000 Add Text Here 3,200,000 3,200,000 Employee X 150,000 150,000 Add Text Here 250,000 250,000 Add Text Here 200,000 200,000 Unissued Options 600,000 600,000 Total 11,500,000 6,850,000 600,000 1,600,000 20,550,000 This slide is 100% editable. Adapt it to your needs and capture your audience's attention.
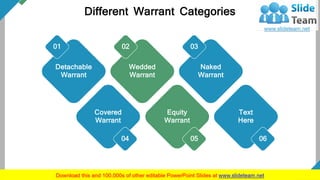
- 35. Different Warrant Categories 35 Covered Warrant 04 Equity Warrant 05 Text Here 06 Detachable Warrant 01 Wedded Warrant 02 Naked Warrant 03 This slide is 100% editable. Adapt it to your needs and capture your audience's attention.
- 36. Warrants Summarization Overview 36 Warrants Overview Warrant A Warrant B AIG Warrant Warrant Strike Price $15.50 $31.92 $34.00 Warrant Price $8.16 $0.65 $19.81 Warrant Expiration Date March 15, 2020 February 24, 2019 December 14, 2022 Time until Expiration (Years) 5.89 5.65 5.30 Stock Price $16.67 $15.65 $61.78 Breakeven Price $22.54 $32.45 $56.46 Add Text Here $25.87 $25.87 $46.12 Book Value Per Share $19.34 $19.34 $70.76
- 37. 37 Different Warrant Categories Put and Call Options • Put and Call Options • Put and Call Options Time Value Stock Index Futures & Options • Stock Indexes Comparison Table • Add Text Here
- 38. Put and Call Options 38 Market Opinion With Option Without Options Call Bullish Very Somewhat Buy Buy Call Sell Put Buy Neutral Sell Options Sell Option Spreads Do Nothing Do Nothing Put Bearish Somewhat Very Buy Put Spread Sell Call Spread Buy Put Sell
- 39. Put and Call Options Time Value 39 Total Value Time Value Calls Strike Price Puts Time Value Total Value Intrinsic Value Intrinsic Value 1 1 0 80 10 1 11 3 1 0 85 5 4 7 6 4 0 90 10 2 4 10 5 5 100 0 1 5 11 3 3 115 5 3 3 This slide is 100% editable. Adapt it to your needs and capture your audience's attention.
- 40. Stock Index Futures and Options 40 Contract Ticker Symbol Futures Options Globex E-mini S&P 500 ES X X X S&P 500 SP X X X E-mini NASDAQ-100 NQ X X X Add Text Here YM X X X E-mini S&P Midcap 400 EMD X X X Add Text Here NIY X X X Nikkei 225 (Dollar) NKD X X X This slide is 100% editable. Adapt it to your needs and capture your audience's attention.
- 41. Stock Indexes Comparison Table 41 Your Text Here Notional Value/ Volume (‘000 USD) Volume/ Open Interest (No. of Contracts) Index Options Index Futures Index Options Index Futures Korea Exchange 0.5 122.6 2,781 562 Australia Exchange 1.2 1.7.5 17 34 China Financial Futures Exchange 7 119.8 N.A. 489 Hong Kong Exchange 4.8 95.8 14 137 National Stock Exchange of India 3.9 45.6 507 251 Bombay Stock Exchange 16.2 4.2 5,982 984 Your Text Here 3.5 21.7 13 265 TAIFEX (Taiwan) 8.1 N.A. 122 230 Chicago Board Options Exchange 11 62.9 24 N.A. You Text Here 5 50.1 29 140 London Stock Exchange Group 9.2 66.9 43.7 305 World Total 3.4 45.1 67 128 This slide is 100% editable. Adapt it to your needs and capture your audience's attention.
- 42. International Security Markets International Security Markets Highlights Recent Global Security Market Trends Mutual Funds Mutual Funds Investment Criteria Overview Top 5 Mutual Funds to Invest in 2018-19 Investments in Real Assets Diversified Real Assets Classification This slide is 100% editable. Adapt it to your needs and capture your audience's attention 42 Broadening the Investment Perspective
- 43. International Security Market Highlights The Global Physical Security Market is Expected to Grow at A CAGR of More than 17% from 2018-2022 Market Growth Integration of Lot in Physical Security Market Trend Increase in Domestic and International Security Threats Market Driver This slide is 100% editable. Adapt it to your needs and capture your audience's attention. 43
- 44. Recent Global Security Market Trendsbehavior 44 Global Growth to remain in Autopilot Monetary stimulus to become less prevalent Geopolitical Risks Add Text Here Reduced Reward for Risk Inflation to make a comeback - but only in the us This slide is 100% editable. Adapt it to your needs and capture your audience's attention.
- 45. Mutual Funds Investment Criteria Overview 45 Equity Balanced Fixed Income Money Market Investment 75%-90% invested in stocks 100% in fixed-income securities 100% in fixed-income securities 100% in short term fixed-income securities Average Annul Return 15%-20% Medium risk, Higher risk compared to other Mf types 6%-10% 6%-10% 1%-2% Risk For aggressive investors Medium Risk, Lower risk compared to other MF types Medium Risk, Lower risk compared to other MF types Medium Risk, Even Lower risk compared to other MF types Investors Ideal for long term growth (5 years or more) For conservative investors For conservative investors For conservative investors This slide is 100% editable. Adapt it to your needs and capture your audience's attention.
- 46. Top 5 Mutual Funds to Invest in 2018-19 46This slide is 100% editable. Adapt it to your needs and capture your audience's attention. Mutual Funds Crisil Rank Value Research Rating (Out of 5) Assets Under Management (in SMM) 1 Month 3 Month I Year 3 Year 5 Year Franklin Build India Fund Rank-3 5 Star 23 -4% 1% 22% 14% 26% L&T Infrastructure Fund Rank-1 5 Star 27 -6% 1% 35% 19% 24% Kotak Infras. & Eco Reform Fund Rank-2 4 Star 33 -7% 1% 23% 13% 22% Aditya Birla SL Infrastructure Fund Rank-3 4 Star 63 -7% -1% 26% 12% 20% IDFC Infra Fund Rank-2 4 Star 203 -7% -1% 33% 18% 18%
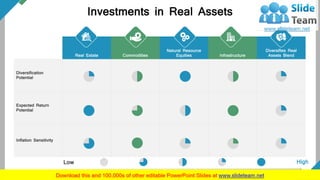
- 47. Investments in Real Assets Real Estate Commodities Natural Resource Equities Infrastructure Diversifies Real Assets Blend Diversification Potential Expected Return Potential Inflation Sensitivity HighLow 47
- 48. Risk & Return Analysis 48 Risk and Return of Portfolio Managers (Tabular Form) Your Text Here Your Text Here Your Text Here Your Text Here Your Text Here Your Text Here Your Text Here Your Text Here Your Text Here Your Text Here Your Text Here Your Text Here Your Text Here Your Text Here Your Text Here Your Text Here Your Text Here Your Text Here Your Text Here Your Text Here Your Text Here Your Text Here Your Text Here Your Text Here Your Text Here Your Text Here Your Text Here This slide is 100% editable. Adapt it to your needs and capture your audience's attention.
- 49. Risk And Return of Portfolio Managers (Tabular Form) 49 Year Security A Risk (%) Security A Return (%) Security B Risk (%) Security B Return (%) 2013 8 4 14 6 2014 10 6 4 13 2015 15 3 7 12 2016 9 -4 17 6 2017 10 5 8 7 This slide is 100% editable. Adapt it to your needs and capture your audience's attention.
- 50. 50 KPI Dashboard Portfolio Management Dashboard Portfolio Summary Management Dashboard Portfolio Management Security Allocation Dashboard KPI Metrics Portfolio Management KPI’s Portfolio Investment Management KPI’s Your Text Here KPI & Dashboard
- 51. Portfolio Management Dashboard QNA +3,05% C +2,78% DUAL +1,80% BWT -3,46% TARH -0,79% VNK -1,00% -3$ -1$ 1$ 3$ 5$ 7$ 9$ 11$ 13$ 15$ 2013 2014 2015 2016 2017 Alternatives Equity Fixed Income 26% 24% 16% 13% 11% 10% HOLDINGS NET WORTH TRANSACTIONS NET FLOWS ALLOCATIONS SECTORS REGIONS 50% 26% 24% Equity Fixed Income Alternatives Technology Energy Healthcare Financials Material Industrial 2017-11-24 Inpayment Transfer +$400,000 2017-11-20 Sell Shares +$976,452 2017-11-15 Purchase Bonds -$845,321 2017-11-11 Sell Bonds +$421,987 2017-11-07 Outpayment Transfer -$420,000 2017-11-02 Purchase Shares -$818,341 EMEA America ACAP 48% 37% 15% 51This graph/chart is linked to excel, and changes automatically based on data. Just left click on it and select “Edit Data”.
- 52. Portfolio Summary Management Dashboard Portfolio Name Portfolio Owner Health Budget Used Budget #Projects Facilities Upgrade Thomas Beddov 1.75M 845.00K 3 Human Capital Initiatives Thomas Beddov 2.46M 794.00K 2 Insurance Biz Thomas Beddov 3.98M 3.20M 5 Internal Activities Portfolio Thomas Beddov 1.87M 2.01M 4 IT Long Haul Thomas Beddov 4.67M 654.67K 12 Operational Excellence Thomas Beddov 6.32M 2.04M 3 Product Engineering Thomas Beddov 2.65M 1.90M 1 Strategic Initiatives Thomas Beddov 3.12M 2.65M 9 Actual Cost Across Portfolios 6.65M Estimated Cost Across Portfolios 10.42M Used Budget Percentage 45% Used Budget Across Portfolios 11.45M Allocated Budget Across Portfolios 34.67M PORTFOLIO BUDGET PROJECT SUMMARY 2000000 1750000 3755000 4650000 3250000 3200000 7024000 3218000 Facilities Upgrade Human Capital Insurance Biz Internal Activities Portfolio IT Long Haul Operational Excellence Product Engineering Strategic Initiatives 52This graph/chart is linked to excel, and changes automatically based on data. Just left click on it and select “Edit Data”.
- 53. Portfolio Management Securities Allocation Dashboard Portfolio Criteria 2 Criteria 3 Criteria 4 Profile Total Current Allocation ETF (%) Stocks $11,990.87 (56.8%) US Large Company Stocks - Fundamental $2,831.67 Us Large Company Stocks $2,134.75 Fixed Income $3,763.97 (20.24%) US Corporate High Yield Bonds $2,117.54 International Emerging Market Bonds $2,341.75 $8.2$3.2 $1.4 $1.2 Stocks Fixed Income Commodities Cash My Portfolio $14,351.76 53This graph/chart is linked to excel, and changes automatically based on data. Just left click on it and select “Edit Data”.
- 54. Portfolio Management KPI’s 54 Allocated Budget Across Portfolios 25.89M This slide is 100% editable. Adapt it to your needs and capture your audience's attention Used Budget Across Portfolios 11.46M This slide is 100% editable. Adapt it to your needs and capture your audience's attention Used Budget Percentage 29% This slide is 100% editable. Adapt it to your needs and capture your audience's attention
- 55. Diversified Real Assets Classification Diversified real asset 0% Diversified real asset 10% Diversified real asset 20% 0% 15% 30% Annual Returns 6.0% 8.1% 6.1% Volatility (Standard Deviation) 8.5% 7.2% 7.9% Sharpe Ratio 0.34 0.51 0.64 55 Bonds Stocks Diversified Real Assets 70% 40% 0% 15% 45% 45% 10% 30% 38% 32% 20% DIVERSIFIED REAL ASSETS Bonds Stocks Diversified Real Assets This graph/chart is linked to excel, and changes automatically based on data. Just left click on it and select “Edit Data”.
- 56. Put and Call Options Put and Call Options Put and Call Options Time Value Stock Index Futures & Options Stock Indexes Comparison Table Add Text Here 56 Derivative Products
- 57. Types of Convertible Securities Convertible Securities Types 01 Convertible Bond 02 Convertible Preferred Stock 03 Warrant 04Capital Note 05Right Issue 06Add Security Here 57This slide is 100% editable. Adapt it to your needs and capture your audience's attention.
- 58. Consistency of Returns Provide the stability of returns Consistency of Returns Provide the stability of returns Consistency of Returns Provide the stability of returns Consistency of Returns Provide the stability of returns Consistency of Returns Provide the stability of returns Consistency of Returns Provide the stability of returns 01 02 03 04 05 06 58 Different Warrant Categories
- 59. › The global physical security market is expected to grow at a CAGR of more than 17% from 2018-2022 › This slide is 100% editable. Adapt it to your needs and capture your audience's attention › Integration of IoT in physical security › This slide is 100% editable. Adapt it to your needs and capture your audience's attention › Increase in domestic and international security threats › This slide is 100% editable. Adapt it to your needs and capture your audience's attention 01 MARKET GROWTH 03 MARKET DRIVER 02 MARKET TREND International Security Market Highlights 59
- 60. 60 Portfolio Management Investment Allocation KPI’s MY PORTFOLIO Portfolio summary Vs Previous Month -4.2% 5,437,000 Net allocations Vs Previous Month -1.4% 32,730 Used budget % Vs Previous Month 0.6% 45 % Returns Vs Previous Month 0.0% 85% Current allocations Vs Previous Month 0.5% 1.2% Vs Previous Month Holdings 21.9% 1.2% Add criteria here Vs Previous Month 0.0% 8 Add criteria here 19 Vs Previous Month 0.0% This slide is 100% editable. Adapt it to your needs and capture your audience's attention.
- 61. 61 Detailed Investment Analysis – Icons Slide
- 63. 63 Let’s Start again in 30 Minutes Coffee Break 11:00am-11:15am This slide is 100% editable. Adapt it to your needs and capture your audience's attention.
- 64. Quotes Success is NEITHER MAGICAL NOR MYSTERIOUS. Success is the natural consequence of consistently applying basic fundamentals. _ Jim Rohm 64
- 65. Technical Analysis Types 65 Our Mission This slide is 100% editable. Adapt it to your needs and capture your audience's attention. Vision This slide is 100% editable. Adapt it to your needs and capture your audience's attention. Our Goal This slide is 100% editable. Adapt it to your needs and capture your audience's attention. Mission
- 66. 66 Meet the Team Name Here This slide is 100% editable. Adapt it to your needs and capture your audience's attention. (Designation) Name Here This slide is 100% editable. Adapt it to your needs and capture your audience's attention. (Designation) Name Here This slide is 100% editable. Adapt it to your needs and capture your audience's attention. (Designation) Name Here This slide is 100% editable. Adapt it to your needs and capture your audience's attention. (Designation)
- 67. 67 Idea Bulb Idea Text Here 01 This slide is 100% editable. Adapt it to your needs and capture your audience's attention. Text Here 02 This slide is 100% editable. Adapt it to your needs and capture your audience's attention. Text Here 03 This slide is 100% editable. Adapt it to your needs and capture your audience's attention. Text Here 04 This slide is 100% editable. Adapt it to your needs and capture your audience's attention.
- 68. 68 Pie Chart 31% 11% 17% 41% Product 01 This slide is 100% editable. Adapt it to your needs and capture your audience's attention. Product 02 This slide is 100% editable. Adapt it to your needs and capture your audience's attention. Product 03 This slide is 100% editable. Adapt it to your needs and capture your audience's attention. Product 04 This slide is 100% editable. Adapt it to your needs and capture your audience's attention.
- 69. 69 Stacked Area - Clustered Column 0 1 2 3 4 5 6 7 8 9 10 2015 2016 2017 2018 Product 01 This graph/chart is linked to excel, and changes automatically based on data. Just left click on it and select “Edit Data”. Product 02 This graph/chart is linked to excel, and changes automatically based on data. Just left click on it and select “Edit Data”. Product 03 This graph/chart is linked to excel, and changes automatically based on data. Just left click on it and select “Edit Data”.
- 70. 70 Clustered Bar 35 45 40 50 60 10 30 25 40 85 55 60 65 70 97 0 10 20 30 40 50 60 70 80 90 100 2013 2014 2015 2016 2017 Product 01 This graph/chart is linked to excel, and changes automatically based on data. Just left click on it and select “Edit Data”. Product 02 This graph/chart is linked to excel, and changes automatically based on data. Just left click on it and select “Edit Data”. Product 03 This graph/chart is linked to excel, and changes automatically based on data. Just left click on it and select “Edit Data”.
- 71. Thanks For Watching Address: # Street Number, City, State Contact Numbers: 0123456789 Email Address: email address123@gmail.com 71