SlideShare a Scribd company logo
Financial
Investigation
Your Company Name
Due Diligence Outline
Environmental Issues &
General Business Affairs
Marketing & Business
Development
Competitive
Analysis
Due Diligence
Summary
Financial Due
Diligence
Technology/Intellectual
Property
Customer
/Sales
Strategic Fit
with Buyer
Insurance, Antitrust
& Regulatory Issues
Taxation Litigation
Employee
Management Issues
Material
Contract
2This slide is 100% editable. Adapt it to your needs and capture your audience's attention.
Financial
Due
Diligence
3
P&L - KPIs
50
60 65
72
Q1 FY18 Q2 FY18 Q3 FY18 Q4 FY18
Revenue
50
60 65
72
Q1 FY18 Q2 FY18 Q3 FY18 Q4 FY18
Operating Profit
50
60 65
72
Q1 FY18 Q2 FY18 Q3 FY18 Q4 FY18
Net Profit
50
60 65
72
Q1 FY18 Q2 FY18 Q3 FY18 Q4 FY18
COGS
4This graph/chart is linked to excel, and changes automatically based on data. Just left click on it and select “Edit Data”.
All Figures in USD MM
P&L - KPIs (Tabular Form)
All figures in $
MM
Q1 Q2 Q3 Q4
Net Sales 1,703.1 2,022.0 3,184.5 3,476.6
Other Income 4.0 9.9 11.8 31.8
Total Income 1,707.2 2,031.9 3,196.3 3,508.4
Expenses
Total Material Consumed 1,282.5 1,374.7 2,028.2 2,200.4
Employee Benefit Expense 92.1 128.4 155.6 226.5
Other Expenses 71.2 167.3 265.6 299.7
EBITDA 261.3 361.6 746.9 781.8
% EBITDA 15.3% 17.8% 23.4% 22.3%
Depreciation Expense 28.4 45.8 60.0 69.3
Financing Cost 66.9 128.8 198.1 273.9
Profit Before Tax 166.0 186.9 488.8 438.5
Taxes 4.0 -0.8 138.8 100.8
Profit After Tax 162.0 187.7 350.0 337.7
% PAT 9.5% 9.2% 11.0% 9.6%
FY
2018
5This slide is 100% editable. Adapt it to your needs and capture your audience's attention.
Balance Sheet - KPIs
50
60 65
72
Q1 FY18 Q2 FY18 Q3 FY18 Q4 FY18
Total Assets
50
60 65
72
Q1 FY18 Q2 FY18 Q3 FY18 Q4 FY18
Current Assets
50
60 65
72
Q1 FY18 Q2 FY18 Q3 FY18 Q4 FY18
Current Liabilities
50
60 65
72
Q1 FY18 Q2 FY18 Q3 FY18 Q4 FY18
Total Liabilities
6This graph/chart is linked to excel, and changes automatically based on data. Just left click on it and select “Edit Data”.
Balance Sheet - KPIs (Tabular Form )
All figures in $ MM Q1 Q2 Q3 Q4
Shareholders‘ Equity 529.8 1,067.8 1,294.6 1,632.4
Non–current Liabilities 535.0 548.2 513.5 989.0
Short–term Borrowings 439.8 622.7 720.6 1,603.8
Trade Payables 352.9 508.9 760.4 433.7
Other Current Liabilities 5.9 147.3 289.5 372.6
Short Term Provisions 21.4 6.2 15.0 28.0
Current Liabilities 820.1 1,285.0 1,785.5 2,438.1
Total Liabilities 1,760.4 2,678.1 3,316.3 4,730.4
FY
2018
7This slide is 100% editable. Adapt it to your needs and capture your audience's attention.
Balance Sheet - KPIs (Tabular Form) Cont.…
8
Total Fixed Assets 803.2 1,034.6 1,159.5 1,751.3
Non–Current Investments 26.6 26.6 104.5 26.6
Long Term Loans and Advances - 8.0 73.4 204.8
Other Non–Current Assets - 13.8 - -
Current Investments - - - 77.9
Inventories 341.3 731.3 771.3 1,215.8
Trade Receivables 477.6 605.1 996.1 1,061.3
Cash and Bank Balances 33.0 89.5 132.2 258.8
Short–term Loans & Advances 75.8 169.1 76.9 131.6
Total Assets 1,760.4 2,678.1 3,316.3 4,730.4
This slide is 100% editable. Adapt it to your needs and capture your audience's attention.
Cash Flow Statement - KPIs
50
60 65
72
Q1 FY18 Q2 FY18 Q3 FY18 Q4 FY18
Operations
50
60 65
72
Q1 FY18 Q2 FY18 Q3 FY18 Q4 FY18
Net Increase in Cash
50
60 65
72
Q1 FY18 Q2 FY18 Q3 FY18 Q4 FY18
Investing Activities
50
60 65
72
Q1 FY18 Q2 FY18 Q3 FY18 Q4 FY18
Financing Activities
9This graph/chart is linked to excel, and changes automatically based on data. Just left click on it and select “Edit Data”.
Cash Flow Statement - KPIs (Tabular Form)
FY12 FY13 FY14 FY15
Cash flow from Operations 3,184 3,476 4,621 6,168
Cash flow from Investing Activities 723 781 834 1,210
Cash flow from Financing Activities 326 337 223 459
Change in Cash & Cash Equivalents 1,017 1,303 1,490 1,836
10This slide is 100% editable. Adapt it to your needs and capture your audience's attention.
Financial Projections – P&L
Income Statement (USD MM)
Mar-13 Mar-14 Mar-15 Mar-16 Mar-17 Mar-18 Mar-19 Mar-20 Mar-21 Mar-22 Mar-23
Net Sales 1,703.1 2,022.0 3,184.5 3,476.6 4,632.6 6,421.4 8,542.4 11,451.0 14,418.8 18,109.4 20,979.0
Expenses
Cost Of Goods Sold 1,282.5 1,374.7 2,028.2 2,200.4 2,859.0 4,148.2 5,467.2 7,271.4 9,156.0 11,499.5 13,321.7
Employee Benefit
Expense
92.1 128.4 155.6 226.5 280.5 321.1 507.2 583.9 675.3 875.4 962.3
Other Expenses 71.2 167.3 265.6 299.7 552.9 570.1 728.9 939.7 1,162.5 1,429.8 1,667.8
EBITDA 261.3 361.6 746.9 781.8 971.7 1,409.1 1,868.5 2,687.8 3,459.5 4,342.0 5,067.7
%EBITDA 15.3% 17.8% 23.4% 22.3% 20.8% 21.9% 21.8% 23.4% 23.9% 23.9% 24.1%
Financing Cost 66.9 128.8 198.1 273.9 293.0 305.3 361.9 423.0 500.6 646.0 786.3
Profit After Tax 162.0 187.7 350.0 337.7 409.5 691.5 972.9 1,614.7 2,109.5 2,361.8 2,742.3
% Pat 9.5% 9.2% 11.0% 9.6% 8.8% 10.7% 11.4% 14.1% 14.6% 13.0% 13.0%
11This slide is 100% editable. Adapt it to your needs and capture your audience's attention.
Financial Projections – Balance Sheet
Balance Sheet ($ MM)
Mar-13 Mar-14 Mar-15 Mar-16 Mar-17 Mar-18 Mar-19 Mar-20 Mar-21 Mar-22 Mar-23
Shareholders‘ Equity 529.8 1,067.8 1,294.6 1,632.4 1,856.0 3,247.5 4,220.4 5,835.2 7,944.6 10,306.4 13,048.6
Non–current Liabilities 535.0 548.2 513.5 989.0 1,155.0 1,033.3 829.1 744.2 569.8 1,285.4 1,283.5
Short–term Borrowings 439.8 622.7 720.6 1,603.8 1,681.6 2,139.6 2,835.0 3,813.4 4,797.6 5,982.1 6,897.9
Trade Payables 352.9 508.9 760.4 433.7 682.6 852.4 1,123.4 1,494.1 1,881.4 2,362.9 2,737.3
Current Liabilities 820.1 1,285.0 1,785.5 2,438.1 3,258.5 4,097.1 5,434.9 7,287.5 9,170.6 11,472.5 13,252.3
Total Liabilities 1,760.4 2,678.1 3,316.3 4,730.4 5,904.1 8,012.6 10,119.1 13,501.5 17,319.7 22,699.0 27,219.1
Total Fixed Assets 803.2 1,034.6 1,159.5 1,751.3 2,073.3 2,734.8 2,726.7 2,848.2 2,943.7 4,462.7 4,693.7
Inventories 341.3 731.3 771.3 1,215.8 1,355.2 2,120.6 2,754.6 3,649.3 4,569.9 5,730.8 6,627.5
Trade Receivables 477.6 605.1 996.1 1,061.3 1,713.1 2,068.3 2,742.9 3,657.9 4,596.4 5,752.4 6,637.4
Cash and Bank Balances 33.0 89.5 132.2 258.8 264.4 375.5 1,018.9 2,288.3 3,948.9 5,287.4 7,542.8
Short–term Loans &
Advances
75.8 169.1 76.9 131.6 290.6 325.8 387.1 456.4 530.7 623.2 702.2
Current Assets 930.5 1,595.1 1,978.8 2,747.8 3,624.0 4,890.9 6,904.1 10,052.5 13,646.5 17,394.5 21,510.6
Total Assets 1,760.4 2,678.1 3,316.3 4,730.4 5,904.1 8,012.6 10,119.1 13,501.5 17,319.7 22,699.0 27,219.1
12This slide is 100% editable. Adapt it to your needs and capture your audience's attention.
Key Financial Ratios (1/1)
10%
P/E Ratio
(Price-to-Earnings)
Q2 FY18
10
Return
on Assets
Q2 FY18
10%
P/E Ratio
(Price-to-Earnings)
Q1 FY18
10
Return
on Assets
Q1 FY18
10%
Debt To Equity
Ratio
10
Return
on Equity
10%
Current Ratio
10
Return
on Investment
13This graph/chart is linked to excel, and changes automatically based on data. Just left click on it and select “Edit Data”.
14
Key Financial
Ratios (1/2)
Liquidity
This slide is 100% editable. Adapt it to your needs and
capture your audience's attention.
Profitability
This slide is 100% editable. Adapt it to your needs and
capture your audience's attention.
Activity
This slide is 100% editable. Adapt it to your needs and
capture your audience's attention.
Solvency
This slide is 100% editable. Adapt it to your needs and
capture your audience's attention.
Liquidity Ratios
4.3
2.5
2
5.5
6.4
0
1
2
3
4
5
6
7
FY 14 FY 15 FY 16 FY 17 FY 18
Current Ratio: Current Assets/ Current
liabilities
3.1
2.01
0.67
1.98
4.1
0
0.5
1
1.5
2
2.5
3
3.5
4
4.5
FY 14 FY 15 FY 16 FY 17 FY 18
Quick Ratio: Current Assets/ Current
liabilities
15This graph/chart is linked to excel, and changes automatically based on data. Just left click on it and select “Edit Data”.
Profitability Ratios
22.5
29.8
34.6
42.5
54.2
0
10
20
30
40
50
60
FY 14 FY 15 FY 16 FY 17 FY 18
Net Profit Ratio: Net Profit After Tax/Net
Sales
31
21
38
45
49
0
10
20
30
40
50
60
FY 14 FY 15 FY 16 FY 17 FY 18
Gross Profit Ratio: Gross Profit / Net
Sales
16This graph/chart is linked to excel, and changes automatically based on data. Just left click on it and select “Edit Data”.
Activity Ratios
1.3
1.6
2.2
3.4
4.1
0
0.5
1
1.5
2
2.5
3
3.5
4
4.5
FY 14 FY 15 FY 16 FY 17 FY 18
Inventory Turnover: COGS / Avg.
Inventory
1
1.56
2
4
5
0
1
2
3
4
5
6
FY 14 FY 15 FY 16 FY 17 FY 18
Receivables Turnover: Net Credit Sales
/ Average Accounts Receivable
17This graph/chart is linked to excel, and changes automatically based on data. Just left click on it and select “Edit Data”.
Solvency Ratios
22.1
10.5
25.6
29.5
35.2
0
5
10
15
20
25
30
35
40
FY 14 FY 15 FY 16 FY 17 FY 18
Debt-Equity Ratio : Total Liabilities Total
Equity
12.5
17.5
9.5
12.5
16.5
0
2
4
6
8
10
12
14
16
18
20
FY 14 FY 15 FY 16 FY 17 FY 18
Time Interest Earned Ratio : EBIT
/Interest Expense
18This graph/chart is linked to excel, and changes automatically based on data. Just left click on it and select “Edit Data”.
Conclusion
Are the company’s financial statements audited, and if so for how long? Text Here
Do the financial statements set forth all liabilities of the company, both current & contingent? Text Here
Are the margins for the business growing or deteriorating? Text Here
Are the company’s projections for the future and underlying assumptions reasonable and believable? Text Here
How do the company’s projections for the current year compare to the board-approved budget for the same period? Text Here
What normalized working capital will be necessary to continue running the business? Text Here
What is the condition of assets and liens thereon? Text Here
Has EBITDA and any adjustments to EBITDA been appropriately calculated? Text Here
Are the company’s financial statements audited, and if so for how long? Text Here
19This slide is 100% editable. Adapt it to your needs and capture your audience's attention.
Technology/
Intellectual
Property
20
What domestic and foreign patents (and patents pending)
does the company have?
01
Has the company taken appropriate steps to protect its
intellectual property?
02
What registered and common law trademarks and service
marks does the company have?
03
What copyrighted products and materials are used,
controlled, or owned by the company?
04
Is the company involved in any intellectual property
litigation or other disputes?
05
What technology in-licenses does the company have and
how critical are they to the company’s business?
06
Has the company granted any exclusive technology
licenses to third parties?
07
What indemnities has the company provided third parties with
respect to possible intellectual property disputes or problems?
08
Technology/
Intellectual
Property
21
Customer/
Sales
22
Top Customers & Revenue
S. No. Customer Revenue
1 - $
2 - $
3 - $
4 - $
5 - $
6 - $
7 - $
8 - $
9 - $
10 - $
11 - $
12 - $
13 - $
14 - $
23This slide is 100% editable. Adapt it to your needs and capture your audience's attention.
Customer Concentration Issues/Risk
This slide is 100%
editable. Adapt it to
your needs and
capture your
audience's attention.
This slide is 100%
editable. Adapt it to
your needs and
capture your
audience's attention.
This slide is 100%
editable. Adapt it to
your needs and
capture your
audience's attention.
Risk
Management
Action ControlAnalysis
24
Customer Satisfaction
2017
2018 57% 85% 75%
Overall Satisfaction
with Service
Satisfaction with
Value For Money
Overall Satisfaction
with Relationship
25This slide is 100% editable. Adapt it to your needs and capture your audience's attention.
Other Customer Focus Areas
Text Here
Are there any
warranty issues
with current or
former
customers?
Text Here
What is the
customer
backlog?
Text Here
What are the sales
terms/policies, and
have there been any
unusual levels of
returns/ exchanges/
refunds?
Text Here
How are sales people
compensated/motivat
ed, and what effect
will the transaction
have on the financial
incentives offered to
employees?
Text Here
What seasonality
in revenue and
working capital
requirements
does the company
typically
experience?
26This slide is 100% editable. Adapt it to your needs and capture your audience's attention.
Strategic Fit
With Buyer
27
Business
Compatibility2 Press conferences
✓ 1 month before
✓ 2 days before
Text Here
Covered by 54 media
outlets on an average
Text Here
Social Media and Web
appearance
Text Here
28
This slide is 100% editable. Adapt it to your needs and capture your
audience's attention.
Financial Compatibility
What integration will be necessary, how
long will the process take, and how
much will it cost?
What cost savings and other
synergies will be obtainable after
the acquisition?
What marginal costs (e.g., costs of
obtaining third party consents) might be
generated by the acquisition?
29This slide is 100% editable. Adapt it to your needs and capture your audience's attention.
Material
Contract
30
Material Contract Checklist
S. No. Checklist Y/N
1 Guaranties, loans, and credit agreements
2 Customer and supplier contracts
3 Agreements of partnership or joint venture; limited liability company or operating agreements
4 Contracts involving payments over a material dollar threshold
5 Settlement agreements
6 Past acquisition agreements
7 Equipment leases
8 Indemnification agreements
9 Employment agreements
10 Exclusivity agreements
11 Real estate leases/purchase agreements
12 License agreements
13 Powers of attorney
14 Franchise agreements
15 Equity finance agreements
16 Distribution, dealer, sales agency, or advertising agreements
17 Non-competition agreements
Yes No
31This slide is 100% editable. Adapt it to your needs and capture your audience's attention.
Employee
Management
Issues
32
Management Organizational Chart
Cindy J.
Florence
Tina
Mou
Rosie
Green
Max
Brown
Stephen
Woods
Jennie
CurryEmployee
Employee
Employee
Employee
Employee
Employee
Grace
Maria Employee
David
Meyer
Employee
James
Kristy
Employee
Dona
Madina
Employee
Julie
Warren Employee
Lora
Blair
Marketing
Communication
Manager
Tony
Williams
Marketing
Communication
Manager
Kate
Jeter
Responsibility
1
Derek
Crisp
Responsibility
2
Marketing
Communication
Manager
Bill
Durbin
Marketing
Director
Robert
Fowler
Business
Development
Manager
David
Johnson
33This slide is 100% editable. Adapt it to your needs and capture your audience's attention.
Key Issues
Summary Of Labor Disputes
This slide is 100% editable. Adapt it to your needs and capture your
audience's attention.
Employment And Consulting Agreements, Loan Agreements
This slide is 100% editable. Adapt it to your needs and capture your
audience's attention.
Schedule Of Compensation Paid To Management Showing
Separately Salary, Bonuses, & Non-cash Compensation
This slide is 100% editable. Adapt it to your needs and capture your
audience's attention.
Summary Of Management Incentive Or Bonus Plans
This slide is 100% editable. Adapt it to your needs and capture your
audience's attention.
34
Litigation
35
Litigation Timeline
1 2 3 4 5 6 7 8 9
Event 1 12 Days
10 DaysEvent 2
17 DaysEvent 3
10 DaysEvent 4
Event 5
14 Days
Week
Milestone1
9/1/18
Milestone2
9/16/18
Milestone3
9/30/18
Milestone4
10/10/18
Milestone5
10/28/18
36This slide is 100% editable. Adapt it to your needs and capture your audience's attention.
Litigation And Judicial Activities
Litigation And
Judicial Activities
This slide is 100% editable. Adapt it to
your needs and capture your
audience's attention.
Environmental
Management
This slide is 100% editable. Adapt it to
your needs and capture your
audience's attention.
Disaster
Management
This slide is 100% editable. Adapt it to
your needs and capture your
audience's attention.
International Affairs
& Commerce
This slide is 100% editable. Adapt it to
your needs and capture your
audience's attention.
Correctional
Activities
This slide is 100% editable. Adapt it to
your needs and capture your
audience's attention.
Natural
Resources
This slide is 100% editable. Adapt it to
your needs and capture your
audience's attention.
37
Litigation KPIs
Average Cost Per Lawsuit
This slide is 100% editable. Adapt it to your needs and capture
your audience's attention.
Average Legal Opinion Response Time
This slide is 100% editable. Adapt it to your needs and capture
your audience's attention.
% Litigation Cases 'Won'
This slide is 100% editable. Adapt it to your needs and capture
your audience's attention.
38
Taxation
39
Taxation Checklist
S.No. Checklist Y/N
1 Federal, state, local, and foreign incomes sales and other tax returns filed in the last five years
2 Government audits
3
Copies of any correspondence or notice from any foreign, federal, state, or local taxing
authority regarding any filed tax return
4 Tax sharing and transfer pricing agreements
5 Net operating losses or credit carryforwards
6 IRS Form 5500 for 401(k) plans
7 Agreements waiving or extending the tax statute of limitations
8 Allocation of acquisition purchase price issues
9 Correspondence with taxing authorities regarding key tax items
10 Settlement documents with the IRS or other government taxing authorities
Yes No
40This slide is 100% editable. Adapt it to your needs and capture your audience's attention.
Insurance,
Antitrust &
Regulatory Issues
41
Antitrust And Regulatory Issues
Your Text Here
Analyzing scope
of any antitrust
issues
Your Text Here
If the company has been
involved in prior
antitrust or regulatory
inquiries or
investigations
Your Text Here
How consolidation trends
in the company’s industry
might impact the
likelihood and speed of
antitrust or regulatory
approval
42This slide is 100% editable. Adapt it to your needs and capture your audience's attention.
Insurance Checklist
S.No. Checklist Y/N
1 General liability insurance
2 D&O insurance
3 Intellectual property insurance
4 Car insurance
5 Health insurance
6 E&O insurance
7 Key man insurance
8 Employee liability insurance
9 Worker’s compensation insurance
10 Umbrella policies
Yes No
43This slide is 100% editable. Adapt it to your needs and capture your audience's attention.
Environmental
Issues & General
Business Affairs
44
Environmental Issues
Your Text Here
This slide is 100% editable. Adapt it to your
needs and capture your audience's attention.
01
Your Text Here
This slide is 100% editable. Adapt it to your
needs and capture your audience's attention.
02
Your Text Here
This slide is 100% editable. Adapt it to your
needs and capture your audience's attention.
03
Your Text Here
This slide is 100% editable. Adapt it to your
needs and capture your audience's attention.
04
45
General Corporate Matters
03
▪ Point 1
▪ Point 2
▪ Point 3
▪ Point 4
List of subsidiaries and
their respective charter
documents
04List of “No-shop” or
exclusivity obligations
▪ Point 1
▪ Point 2
▪ Point 3
▪ Point 4
01
▪ Point 1
▪ Point 2
▪ Point 3
▪ Point 4
List of current
officers and directors
02
▪ Point 1
▪ Point 2
▪ Point 3
▪ Point 4
Lists of all security
holders
46
This slide is 100% editable. Adapt it to your needs and capture your audience's attention.
Related Party Transactions
Any direct or indirect interest of
any officer, director, stockholder or
employee of the company in any
business that competes with or
does business with the company
Any agreements with any
officer, director, stockholder
or employee that is entitled
to compensation
Any agreements where any
officer, director, stockholder
or employee has an interest
in any asset
47
This slide is 100% editable. Adapt it to your needs and capture your audience's attention.
Governmental Regulations, Filings, And Compliance With Laws
This slide is 100% editable.
Adapt it to your needs and
capture your audience's
attention.
Plan
Operations
This slide is 100% editable.
Adapt it to your needs and
capture your audience's
attention.
Plan
Documentation
This slide is 100% editable.
Adapt it to your needs and
capture your audience's
attention.
Non-discrimination
Testing Results
This slide is 100% editable.
Adapt it to your needs and
capture your audience's
attention.
Government Reporting
and Filing
This slide is 100% editable.
Adapt it to your needs and
capture your audience's
attention.
Government
Documents
48
Property
This slide is 100% editable. Adapt it to your
needs and capture your audience's attention
Title Reports
This slide is 100% editable. Adapt it to your
needs and capture your audience's attention
Other interests in Real
Property
This slide is 100% editable. Adapt it to your
needs and capture your audience's attention
Financing Leases
This slide is 100% editable. Adapt it to your
needs and capture your audience's attention
Operating Leases
This slide is 100% editable. Adapt it to your
needs and capture your audience's attention
Deeds
This slide is 100% editable. Adapt it to your
needs and capture your audience's attention
Deeds of Trust & Mortgages
This slide is 100% editable. Adapt it to your
needs and capture your audience's attention
Leases of Real Property
49
Yearly Production
This slide is 100%editable.
Adapt it to your needs and
capture your audience’s
attention.
Product A
55
This slide is 100%editable.
Adapt it to your needs and
capture your audience’s
attention.
Product B
700
This slide is 100%editable.
Adapt it to your needs and
capture your audience’s
attention.
Product C
405
This slide is 100%editable.
Adapt it to your needs and
capture your audience’s
attention.
Product D
60
50
Marketing &
Business
Development
51
Business Development Process
Attract
Visitors
▪ Blog Posts
▪ Articles
▪ Web Content
▪ Videos
Gather
Contact Info
▪ E-Newsletter
▪ Webinars
▪ E-Books
▪ White Papers
More
Interaction
▪ Phone
Consultations
▪ Demos
▪ Assessments
Request a
Proposal
▪ Text Here
▪ Your Text Here
52
This slide is 100% editable. Adapt it to your needs and capture your audience's attention.
Marketing Strategy
Management
Website
Design
Content
Management
Traffic
Building
Search
Engine
Marketing
Planning
Execution
07
08
10
09
11
12
Social Media
Marketing
Search
Engine
Blogging
Email
Marketing
Conversion
Analysis
Integration
Offline Marketing
01
02
04
03
05
06
53
This slide is 100% editable. Adapt it to your needs and capture your audience's attention.
Competitive
Analysis
54
Competitive Landscape
US Competitor 1 Competitor 2 Competitor 3
Image 5 1 9
Experience 10 8
Capital 2
Credit 1 5
Revenue
Sales 4 9 1
Location 9
Debt 3
Management 7 6
Investments 9
Poor – 1,2,3 Good – 4,5,6,7 Excellent – 8,9,10
55This slide is 100% editable. Adapt it to your needs and capture your audience's attention.
Competitor Analysis
Competitors Market Leader Challenger Niche Competitor Explanations
Own Business Text Here Text Here Text Here
▪ Good Service
▪ Small Product Range
▪ We provide maintain flexibilty
Competitor 1 Text Here Text Here Text Here
▪ Good Service
▪ Small Product Range
▪ We provide maintain flexibilty
Competitor 2 Text Here Text Here Text Here
▪ Good Service
▪ Small Product Range
▪ We provide maintain flexibilty
Competitor 3 Text Here Text Here Text Here
▪ Good Service
▪ Small Product Range
▪ We provide maintain flexibilty
Competitor 4 Text Here Text Here Text Here
▪ Good Service
▪ Small Product Range
▪ We provide maintain flexibilty
Competitor Text Here Text Here Text Here
▪ Good Service
▪ Small Product Range
▪ We provide maintain flexibilty
Other Text Here Text Here Text Here
▪ Good Service
▪ Small Product Range
▪ We provide maintain flexibilty
56
This slide is 100% editable. Adapt it to your needs and capture your audience's attention.
Summary
57
Due Diligence Summary
Area 1 Solution 1
Area 2 Solution 2
Area 3 Solution 3
Area 4 Solution 4
Areas Of Concern Possible Solutions
58
This slide is 100% editable. Adapt it to your needs and capture your audience's attention.
We back in
10 min
This slide is 100% editable. Adapt it to your needs
and capture your audience's attention.
This slide is 100% editable. Adapt it to your needs
and capture your audience's attention.
This slide is 100% editable. Adapt it to your needs
and capture your audience's attention.
01
02
03
Coffee
Break Time
59
Charts &
Graphs
60
Area Chart
0
10
20
30
40
50
60
70
80
90
100
DecNovOctSepAugJulJunMayAprMarFebJan
SalesinPercentage(%)
Financial Year 2018
This graph/chart is linked to excel, and changes automatically based on data. Just left
click on it and select “Edit Data”.
This slide is 100% editable. Adapt it to your
needs and capture your audience's attention.
Product01
This slide is 100% editable. Adapt it to your
needs and capture your audience's attention.
Product02
61
Jan
Feb
Mar
Apr
May
Jun
This graph/chart is linked to excel, and changes automatically based on data. Just left
click on it and select “Edit Data”.
62
Radar Chart
This slide is 100% editable. Adapt it to your
needs and capture your audience's attention.
Product01
This slide is 100% editable. Adapt it to your
needs and capture your audience's attention.
Product02
12
10
30
50 48
43
25
23
0
10
20
30
40
50
60
$0 $10 $20 $30 $40 $50
SalesinPercentage(%)
This graph/chart is linked to excel, and changes automatically based on data. Just left
click on it and select “Edit Data”.
63
Bubble Chart
This slide is 100% editable. Adapt it to your
needs and capture your audience's attention.
Product01
This slide is 100% editable. Adapt it to your
needs and capture your audience's attention.
Product02
Additional
Slides
64
Our
Mission
This is a representative image, and should
be replaced by your own image. Just right
click and replace image.
01
This is a representative image, and should
be replaced by your own image. Just right
click and replace image.
02
65
66
John
Smith
Sofia
Banks
Graphic Designer
This slide is 100% editable. Adapt it
to your needs and capture your
audience's attention.
General Manager
This slide is 100% editable. Adapt
it to your needs and capture your
audience's attention.
Our Team
67
Target Audiences
This slide is 100% editable. Adapt it to your needs and
capture your audience's attention.
Preferred By Many
This slide is 100% editable. Adapt it to your needs and
capture your audience's attention.
Values Client
This slide is 100% editable. Adapt it to your needs and
capture your audience's attention.
About Us
Financial
68
Maximum
80%
This slide is 100% editable.
Adapt it to your needs and
capture your audience's
attention.
Minimum
20%
This slide is 100% editable.
Adapt it to your needs and
capture your audience's
attention.
Comparison
18 Minutes/Day
Avg.Time Spent On Twitter
1,230,000,000
Users
350 Million
Tweets Every Day
2017 2018
12:51 Minutes/Day
Avg.Time Spent On Twitter
645,750,000
Users
500+ Million
Tweets Every Day
2017 2018
69
Puzzle
This slide is 100%
editable. Adapt it to your
needs and capture your
audience's attention.
This slide is 100%
editable. Adapt it to your
needs and capture your
audience's attention.
This slide is 100%
editable. Adapt it to your
needs and capture your
audience's attention.
This slide is 100%
editable. Adapt it to your
needs and capture your
audience's attention.
This slide is 100%
editable. Adapt it to your
needs and capture your
audience's attention.
01 02
03
04 05
70
Target
Text 1
Text 2
Text 3
Text 4
Text 5
Text 6
Text 7
Text 8
This slide is 100% editable. Adapt it to your needs and capture your audience's attention.
71
Mind Map
This slide is 100% editable. Adapt it to your needs and
capture your audience's attention.
This slide is 100% editable. Adapt it to your needs and
capture your audience's attention.
This slide is 100% editable. Adapt it to your needs and
capture your audience's attention.
01
02
03
72
Venn
02
01
03
This slide is 100% editable. Adapt it to
your needs and capture your audience's
attention.
This slide is 100% editable. Adapt it to
your needs and capture your audience's
attention.
This slide is 100% editable. Adapt it to
your needs and capture your audience's
attention.
73
Magnifying Glass
01
02
03
04
05
This slide is 100% editable.
Adapt it to your needs and
capture your audience's
attention.
This slide is 100% editable.
Adapt it to your needs and
capture your audience's
attention.
This slide is 100% editable.
Adapt it to your needs and
capture your audience's
attention.
This slide is 100% editable.
Adapt it to your needs and
capture your audience's
attention.
This slide is 100% editable.
Adapt it to your needs and
capture your audience's
attention.
74
Bulb Or
Idea
This slide is 100% editable. Adapt it to your needs
and capture your audience's attention.
This slide is 100% editable. Adapt it to your needs
and capture your audience's attention.
This slide is 100% editable. Adapt it to your needs
and capture your audience's attention.
01
02
03
75
Address:
# street number, city, state
Contact Numbers:
0123456789
Email Address:
emailaddress123@gmail.com
For Your Business
Thanks
76

More Related Content

PPTX
Best practices in conducting Financial Investigations
PPT
Ch 01 Multinational Financial Management - An Over view.ppt
PPTX
Positive Theory
DOCX
Financial Statements Analysis for Credit Decision
PDF
Mencegah Dan Mendeteksi Fraud Serta Profil Pelaku, Korban Dan Perbuatan Fraud
PPTX
Money Laundering by Vivek Singh,Aryan College
PPTX
Enterprise Risk Management
PPTX
Best practices in conducting Financial Investigations
Ch 01 Multinational Financial Management - An Over view.ppt
Positive Theory
Financial Statements Analysis for Credit Decision
Mencegah Dan Mendeteksi Fraud Serta Profil Pelaku, Korban Dan Perbuatan Fraud
Money Laundering by Vivek Singh,Aryan College
Enterprise Risk Management

What's hot (20)

PPT
Money Laundering and Corruption
PDF
Understanding forensic investigation process by G. E. Oyedokun
PPT
Understanding Financial Statement fraud- Forensic Accounting Perspective
PPTX
Bank frauds & its safety
PPTX
Chapter 1 the nature of fraud
PPTX
Anti-money Laundering
PDF
IMPLEMENTATION OF FORENSIC ACCOUNTING ON FRAUD DETECTION: CASE STUDY OF LAGOS...
PPT
International accounting
PDF
Fraud & Risk Management - A Guide to Good Practice
PDF
Nexus Mutual - A mutual for the Ethereum community - D1Conf 2018
PDF
Forensic accounting
DOCX
Audit investasi
PPTX
Anti money laundering
DOC
Sistem Pengendalian Manajemen :: Chapter 1
PPTX
perusahaan induk dan anak
PPTX
Mishkin fmi9ge ppt_c02
DOCX
Contoh Surat tugas
PPTX
PPT AKPEM KEL. VI - Sistem Akuntansi Pemerintah Pusat dan Sistem Pemerintah D...
PPTX
AML presentation
PPT
Liquidity Risk
Money Laundering and Corruption
Understanding forensic investigation process by G. E. Oyedokun
Understanding Financial Statement fraud- Forensic Accounting Perspective
Bank frauds & its safety
Chapter 1 the nature of fraud
Anti-money Laundering
IMPLEMENTATION OF FORENSIC ACCOUNTING ON FRAUD DETECTION: CASE STUDY OF LAGOS...
International accounting
Fraud & Risk Management - A Guide to Good Practice
Nexus Mutual - A mutual for the Ethereum community - D1Conf 2018
Forensic accounting
Audit investasi
Anti money laundering
Sistem Pengendalian Manajemen :: Chapter 1
perusahaan induk dan anak
Mishkin fmi9ge ppt_c02
Contoh Surat tugas
PPT AKPEM KEL. VI - Sistem Akuntansi Pemerintah Pusat dan Sistem Pemerintah D...
AML presentation
Liquidity Risk
Ad

Similar to Financial Investigation PowerPoint Presentation Slides (20)

PDF
Reasonable Investigation PowerPoint Presentation Slides
PDF
Investment Audit PowerPoint Presentation Slides
PDF
Legal Investigation PowerPoint Presentation Slides
PDF
Funding Investigation PowerPoint Presentation Slides
PDF
Due Diligence PowerPoint Presentation Slides
PDF
Commercial Due Diligence Process PowerPoint Presentation Slides
PDF
Financial Statement Analysis PowerPoint Presentation Slides
PDF
Evaluation Of Companys Performance Powerpoint Presentation Slides
PDF
Corporate Due Dilaigence Powerpoint Presentation Slides
PDF
Due Diligence For Investment PowerPoint Presentation Slides
PDF
Due Diligence For Mergers And Acquisition PowerPoint Presentation Slides
PDF
Accounting Analysis And Planning PowerPoint Presentation Slide
PDF
Financing Forecasting Process And Methods PowerPoint Presentation Slides
PDF
Current Assessment PowerPoint Presentation Slides
PDF
Corporate Financial Debt Restructuring PowerPoint Presentation Slides
PDF
Financial Ratio Analysis PowerPoint Presentation Slides
PDF
Current Years Estimation PowerPoint Presentation Slides
PDF
Strategies To Overcome Bankruptcy PowerPoint Presentation Slides
PDF
Example Presentation Of Financial Reports Powerpoint Presentation Slides
PDF
Business Performance Analysis And Planning PowerPoint Presentation Slides
Reasonable Investigation PowerPoint Presentation Slides
Investment Audit PowerPoint Presentation Slides
Legal Investigation PowerPoint Presentation Slides
Funding Investigation PowerPoint Presentation Slides
Due Diligence PowerPoint Presentation Slides
Commercial Due Diligence Process PowerPoint Presentation Slides
Financial Statement Analysis PowerPoint Presentation Slides
Evaluation Of Companys Performance Powerpoint Presentation Slides
Corporate Due Dilaigence Powerpoint Presentation Slides
Due Diligence For Investment PowerPoint Presentation Slides
Due Diligence For Mergers And Acquisition PowerPoint Presentation Slides
Accounting Analysis And Planning PowerPoint Presentation Slide
Financing Forecasting Process And Methods PowerPoint Presentation Slides
Current Assessment PowerPoint Presentation Slides
Corporate Financial Debt Restructuring PowerPoint Presentation Slides
Financial Ratio Analysis PowerPoint Presentation Slides
Current Years Estimation PowerPoint Presentation Slides
Strategies To Overcome Bankruptcy PowerPoint Presentation Slides
Example Presentation Of Financial Reports Powerpoint Presentation Slides
Business Performance Analysis And Planning PowerPoint Presentation Slides
Ad

More from SlideTeam (20)

PDF
Customer Support And Services Guide Powerpoint Presentation Slides
PDF
Word Of Mouth WOM Marketing Strategies To Build Brand Awareness Powerpoint Pr...
PDF
Strategic Staff Engagement Action Plan Powerpoint Presentation Slides
PDF
Traditional Marketing Channel Analysis Powerpoint Presentation Slides Mkt Cd
PDF
Integrating Asset Tracking System To Enhance Operational Effectiveness Comple...
PDF
Designing And Implementing Brand Leadership Strategy Powerpoint Presentation ...
PDF
How Amazon Generates Revenues Across Globe Powerpoint Presentation Slides Str...
PDF
Guide For Effective Event Marketing Powerpoint Presentation Slides Mkt Cd
PDF
Managing Business Customers Technology Powerpoint Presentation Slides
PDF
Unearthing Apples Billion Dollar Branding Secret Powerpoint Presentation Slid...
PDF
Developing Flexible Working Practices To Improve Employee Engagement Powerpoi...
PDF
Product Corporate And Umbrella Branding Powerpoint Presentation Slides Brandi...
PDF
Communication Channels And Strategies For Shareholder Engagement Powerpoint P...
PDF
Responsible Tech Playbook To Leverage Business Ethics Powerpoint Presentation...
PDF
Generating Leads Through Targeted Digital Marketing Campaign Powerpoint Prese...
PDF
Boosting Profits With New And Effective Sales Strategic Plan Powerpoint Prese...
PDF
ChatGPT IT Powerpoint Presentation Slides
PDF
Methods To Implement Traditional Marketing Powerpoint Presentation Slides Mkt Cd
PDF
Comprehensive Guide To Sports Marketing Strategy Powerpoint Presentation Slid...
PDF
Global Shift Towards Flexible Working Powerpoint Presentation Slides
Customer Support And Services Guide Powerpoint Presentation Slides
Word Of Mouth WOM Marketing Strategies To Build Brand Awareness Powerpoint Pr...
Strategic Staff Engagement Action Plan Powerpoint Presentation Slides
Traditional Marketing Channel Analysis Powerpoint Presentation Slides Mkt Cd
Integrating Asset Tracking System To Enhance Operational Effectiveness Comple...
Designing And Implementing Brand Leadership Strategy Powerpoint Presentation ...
How Amazon Generates Revenues Across Globe Powerpoint Presentation Slides Str...
Guide For Effective Event Marketing Powerpoint Presentation Slides Mkt Cd
Managing Business Customers Technology Powerpoint Presentation Slides
Unearthing Apples Billion Dollar Branding Secret Powerpoint Presentation Slid...
Developing Flexible Working Practices To Improve Employee Engagement Powerpoi...
Product Corporate And Umbrella Branding Powerpoint Presentation Slides Brandi...
Communication Channels And Strategies For Shareholder Engagement Powerpoint P...
Responsible Tech Playbook To Leverage Business Ethics Powerpoint Presentation...
Generating Leads Through Targeted Digital Marketing Campaign Powerpoint Prese...
Boosting Profits With New And Effective Sales Strategic Plan Powerpoint Prese...
ChatGPT IT Powerpoint Presentation Slides
Methods To Implement Traditional Marketing Powerpoint Presentation Slides Mkt Cd
Comprehensive Guide To Sports Marketing Strategy Powerpoint Presentation Slid...
Global Shift Towards Flexible Working Powerpoint Presentation Slides

Recently uploaded (20)

PPTX
operations management : demand supply ch
PDF
Tata consultancy services case study shri Sharda college, basrur
PPTX
2025 Product Deck V1.0.pptxCATALOGTCLCIA
PDF
THE COMPLETE GUIDE TO BUILDING PASSIVE INCOME ONLINE
PDF
Comments on Crystal Cloud and Energy Star.pdf
PDF
Blood Collected straight from the donor into a blood bag and mixed with an an...
PDF
1911 Gold Corporate Presentation Aug 2025.pdf
PDF
SIMNET Inc – 2023’s Most Trusted IT Services & Solution Provider
PDF
Keppel_Proposed Divestment of M1 Limited
PDF
Outsourced Audit & Assurance in USA Why Globus Finanza is Your Trusted Choice
PDF
Module 2 - Modern Supervison Challenges - Student Resource.pdf
PPTX
Slide gioi thieu VietinBank Quy 2 - 2025
PDF
Introduction to Generative Engine Optimization (GEO)
PDF
Daniels 2024 Inclusive, Sustainable Development
PDF
Module 3 - Functions of the Supervisor - Part 1 - Student Resource (1).pdf
PPT
Lecture 3344;;,,(,(((((((((((((((((((((((
PDF
Solaris Resources Presentation - Corporate August 2025.pdf
PDF
NEW - FEES STRUCTURES (01-july-2024).pdf
PDF
Charisse Litchman: A Maverick Making Neurological Care More Accessible
PDF
kom-180-proposal-for-a-directive-amending-directive-2014-45-eu-and-directive-...
operations management : demand supply ch
Tata consultancy services case study shri Sharda college, basrur
2025 Product Deck V1.0.pptxCATALOGTCLCIA
THE COMPLETE GUIDE TO BUILDING PASSIVE INCOME ONLINE
Comments on Crystal Cloud and Energy Star.pdf
Blood Collected straight from the donor into a blood bag and mixed with an an...
1911 Gold Corporate Presentation Aug 2025.pdf
SIMNET Inc – 2023’s Most Trusted IT Services & Solution Provider
Keppel_Proposed Divestment of M1 Limited
Outsourced Audit & Assurance in USA Why Globus Finanza is Your Trusted Choice
Module 2 - Modern Supervison Challenges - Student Resource.pdf
Slide gioi thieu VietinBank Quy 2 - 2025
Introduction to Generative Engine Optimization (GEO)
Daniels 2024 Inclusive, Sustainable Development
Module 3 - Functions of the Supervisor - Part 1 - Student Resource (1).pdf
Lecture 3344;;,,(,(((((((((((((((((((((((
Solaris Resources Presentation - Corporate August 2025.pdf
NEW - FEES STRUCTURES (01-july-2024).pdf
Charisse Litchman: A Maverick Making Neurological Care More Accessible
kom-180-proposal-for-a-directive-amending-directive-2014-45-eu-and-directive-...

Financial Investigation PowerPoint Presentation Slides

  • 2. Due Diligence Outline Environmental Issues & General Business Affairs Marketing & Business Development Competitive Analysis Due Diligence Summary Financial Due Diligence Technology/Intellectual Property Customer /Sales Strategic Fit with Buyer Insurance, Antitrust & Regulatory Issues Taxation Litigation Employee Management Issues Material Contract 2This slide is 100% editable. Adapt it to your needs and capture your audience's attention.
  • 4. P&L - KPIs 50 60 65 72 Q1 FY18 Q2 FY18 Q3 FY18 Q4 FY18 Revenue 50 60 65 72 Q1 FY18 Q2 FY18 Q3 FY18 Q4 FY18 Operating Profit 50 60 65 72 Q1 FY18 Q2 FY18 Q3 FY18 Q4 FY18 Net Profit 50 60 65 72 Q1 FY18 Q2 FY18 Q3 FY18 Q4 FY18 COGS 4This graph/chart is linked to excel, and changes automatically based on data. Just left click on it and select “Edit Data”. All Figures in USD MM
  • 5. P&L - KPIs (Tabular Form) All figures in $ MM Q1 Q2 Q3 Q4 Net Sales 1,703.1 2,022.0 3,184.5 3,476.6 Other Income 4.0 9.9 11.8 31.8 Total Income 1,707.2 2,031.9 3,196.3 3,508.4 Expenses Total Material Consumed 1,282.5 1,374.7 2,028.2 2,200.4 Employee Benefit Expense 92.1 128.4 155.6 226.5 Other Expenses 71.2 167.3 265.6 299.7 EBITDA 261.3 361.6 746.9 781.8 % EBITDA 15.3% 17.8% 23.4% 22.3% Depreciation Expense 28.4 45.8 60.0 69.3 Financing Cost 66.9 128.8 198.1 273.9 Profit Before Tax 166.0 186.9 488.8 438.5 Taxes 4.0 -0.8 138.8 100.8 Profit After Tax 162.0 187.7 350.0 337.7 % PAT 9.5% 9.2% 11.0% 9.6% FY 2018 5This slide is 100% editable. Adapt it to your needs and capture your audience's attention.
  • 6. Balance Sheet - KPIs 50 60 65 72 Q1 FY18 Q2 FY18 Q3 FY18 Q4 FY18 Total Assets 50 60 65 72 Q1 FY18 Q2 FY18 Q3 FY18 Q4 FY18 Current Assets 50 60 65 72 Q1 FY18 Q2 FY18 Q3 FY18 Q4 FY18 Current Liabilities 50 60 65 72 Q1 FY18 Q2 FY18 Q3 FY18 Q4 FY18 Total Liabilities 6This graph/chart is linked to excel, and changes automatically based on data. Just left click on it and select “Edit Data”.
  • 7. Balance Sheet - KPIs (Tabular Form ) All figures in $ MM Q1 Q2 Q3 Q4 Shareholders‘ Equity 529.8 1,067.8 1,294.6 1,632.4 Non–current Liabilities 535.0 548.2 513.5 989.0 Short–term Borrowings 439.8 622.7 720.6 1,603.8 Trade Payables 352.9 508.9 760.4 433.7 Other Current Liabilities 5.9 147.3 289.5 372.6 Short Term Provisions 21.4 6.2 15.0 28.0 Current Liabilities 820.1 1,285.0 1,785.5 2,438.1 Total Liabilities 1,760.4 2,678.1 3,316.3 4,730.4 FY 2018 7This slide is 100% editable. Adapt it to your needs and capture your audience's attention.
  • 8. Balance Sheet - KPIs (Tabular Form) Cont.… 8 Total Fixed Assets 803.2 1,034.6 1,159.5 1,751.3 Non–Current Investments 26.6 26.6 104.5 26.6 Long Term Loans and Advances - 8.0 73.4 204.8 Other Non–Current Assets - 13.8 - - Current Investments - - - 77.9 Inventories 341.3 731.3 771.3 1,215.8 Trade Receivables 477.6 605.1 996.1 1,061.3 Cash and Bank Balances 33.0 89.5 132.2 258.8 Short–term Loans & Advances 75.8 169.1 76.9 131.6 Total Assets 1,760.4 2,678.1 3,316.3 4,730.4 This slide is 100% editable. Adapt it to your needs and capture your audience's attention.
  • 9. Cash Flow Statement - KPIs 50 60 65 72 Q1 FY18 Q2 FY18 Q3 FY18 Q4 FY18 Operations 50 60 65 72 Q1 FY18 Q2 FY18 Q3 FY18 Q4 FY18 Net Increase in Cash 50 60 65 72 Q1 FY18 Q2 FY18 Q3 FY18 Q4 FY18 Investing Activities 50 60 65 72 Q1 FY18 Q2 FY18 Q3 FY18 Q4 FY18 Financing Activities 9This graph/chart is linked to excel, and changes automatically based on data. Just left click on it and select “Edit Data”.
  • 10. Cash Flow Statement - KPIs (Tabular Form) FY12 FY13 FY14 FY15 Cash flow from Operations 3,184 3,476 4,621 6,168 Cash flow from Investing Activities 723 781 834 1,210 Cash flow from Financing Activities 326 337 223 459 Change in Cash & Cash Equivalents 1,017 1,303 1,490 1,836 10This slide is 100% editable. Adapt it to your needs and capture your audience's attention.
  • 11. Financial Projections – P&L Income Statement (USD MM) Mar-13 Mar-14 Mar-15 Mar-16 Mar-17 Mar-18 Mar-19 Mar-20 Mar-21 Mar-22 Mar-23 Net Sales 1,703.1 2,022.0 3,184.5 3,476.6 4,632.6 6,421.4 8,542.4 11,451.0 14,418.8 18,109.4 20,979.0 Expenses Cost Of Goods Sold 1,282.5 1,374.7 2,028.2 2,200.4 2,859.0 4,148.2 5,467.2 7,271.4 9,156.0 11,499.5 13,321.7 Employee Benefit Expense 92.1 128.4 155.6 226.5 280.5 321.1 507.2 583.9 675.3 875.4 962.3 Other Expenses 71.2 167.3 265.6 299.7 552.9 570.1 728.9 939.7 1,162.5 1,429.8 1,667.8 EBITDA 261.3 361.6 746.9 781.8 971.7 1,409.1 1,868.5 2,687.8 3,459.5 4,342.0 5,067.7 %EBITDA 15.3% 17.8% 23.4% 22.3% 20.8% 21.9% 21.8% 23.4% 23.9% 23.9% 24.1% Financing Cost 66.9 128.8 198.1 273.9 293.0 305.3 361.9 423.0 500.6 646.0 786.3 Profit After Tax 162.0 187.7 350.0 337.7 409.5 691.5 972.9 1,614.7 2,109.5 2,361.8 2,742.3 % Pat 9.5% 9.2% 11.0% 9.6% 8.8% 10.7% 11.4% 14.1% 14.6% 13.0% 13.0% 11This slide is 100% editable. Adapt it to your needs and capture your audience's attention.
  • 12. Financial Projections – Balance Sheet Balance Sheet ($ MM) Mar-13 Mar-14 Mar-15 Mar-16 Mar-17 Mar-18 Mar-19 Mar-20 Mar-21 Mar-22 Mar-23 Shareholders‘ Equity 529.8 1,067.8 1,294.6 1,632.4 1,856.0 3,247.5 4,220.4 5,835.2 7,944.6 10,306.4 13,048.6 Non–current Liabilities 535.0 548.2 513.5 989.0 1,155.0 1,033.3 829.1 744.2 569.8 1,285.4 1,283.5 Short–term Borrowings 439.8 622.7 720.6 1,603.8 1,681.6 2,139.6 2,835.0 3,813.4 4,797.6 5,982.1 6,897.9 Trade Payables 352.9 508.9 760.4 433.7 682.6 852.4 1,123.4 1,494.1 1,881.4 2,362.9 2,737.3 Current Liabilities 820.1 1,285.0 1,785.5 2,438.1 3,258.5 4,097.1 5,434.9 7,287.5 9,170.6 11,472.5 13,252.3 Total Liabilities 1,760.4 2,678.1 3,316.3 4,730.4 5,904.1 8,012.6 10,119.1 13,501.5 17,319.7 22,699.0 27,219.1 Total Fixed Assets 803.2 1,034.6 1,159.5 1,751.3 2,073.3 2,734.8 2,726.7 2,848.2 2,943.7 4,462.7 4,693.7 Inventories 341.3 731.3 771.3 1,215.8 1,355.2 2,120.6 2,754.6 3,649.3 4,569.9 5,730.8 6,627.5 Trade Receivables 477.6 605.1 996.1 1,061.3 1,713.1 2,068.3 2,742.9 3,657.9 4,596.4 5,752.4 6,637.4 Cash and Bank Balances 33.0 89.5 132.2 258.8 264.4 375.5 1,018.9 2,288.3 3,948.9 5,287.4 7,542.8 Short–term Loans & Advances 75.8 169.1 76.9 131.6 290.6 325.8 387.1 456.4 530.7 623.2 702.2 Current Assets 930.5 1,595.1 1,978.8 2,747.8 3,624.0 4,890.9 6,904.1 10,052.5 13,646.5 17,394.5 21,510.6 Total Assets 1,760.4 2,678.1 3,316.3 4,730.4 5,904.1 8,012.6 10,119.1 13,501.5 17,319.7 22,699.0 27,219.1 12This slide is 100% editable. Adapt it to your needs and capture your audience's attention.
  • 13. Key Financial Ratios (1/1) 10% P/E Ratio (Price-to-Earnings) Q2 FY18 10 Return on Assets Q2 FY18 10% P/E Ratio (Price-to-Earnings) Q1 FY18 10 Return on Assets Q1 FY18 10% Debt To Equity Ratio 10 Return on Equity 10% Current Ratio 10 Return on Investment 13This graph/chart is linked to excel, and changes automatically based on data. Just left click on it and select “Edit Data”.
  • 14. 14 Key Financial Ratios (1/2) Liquidity This slide is 100% editable. Adapt it to your needs and capture your audience's attention. Profitability This slide is 100% editable. Adapt it to your needs and capture your audience's attention. Activity This slide is 100% editable. Adapt it to your needs and capture your audience's attention. Solvency This slide is 100% editable. Adapt it to your needs and capture your audience's attention.
  • 15. Liquidity Ratios 4.3 2.5 2 5.5 6.4 0 1 2 3 4 5 6 7 FY 14 FY 15 FY 16 FY 17 FY 18 Current Ratio: Current Assets/ Current liabilities 3.1 2.01 0.67 1.98 4.1 0 0.5 1 1.5 2 2.5 3 3.5 4 4.5 FY 14 FY 15 FY 16 FY 17 FY 18 Quick Ratio: Current Assets/ Current liabilities 15This graph/chart is linked to excel, and changes automatically based on data. Just left click on it and select “Edit Data”.
  • 16. Profitability Ratios 22.5 29.8 34.6 42.5 54.2 0 10 20 30 40 50 60 FY 14 FY 15 FY 16 FY 17 FY 18 Net Profit Ratio: Net Profit After Tax/Net Sales 31 21 38 45 49 0 10 20 30 40 50 60 FY 14 FY 15 FY 16 FY 17 FY 18 Gross Profit Ratio: Gross Profit / Net Sales 16This graph/chart is linked to excel, and changes automatically based on data. Just left click on it and select “Edit Data”.
  • 17. Activity Ratios 1.3 1.6 2.2 3.4 4.1 0 0.5 1 1.5 2 2.5 3 3.5 4 4.5 FY 14 FY 15 FY 16 FY 17 FY 18 Inventory Turnover: COGS / Avg. Inventory 1 1.56 2 4 5 0 1 2 3 4 5 6 FY 14 FY 15 FY 16 FY 17 FY 18 Receivables Turnover: Net Credit Sales / Average Accounts Receivable 17This graph/chart is linked to excel, and changes automatically based on data. Just left click on it and select “Edit Data”.
  • 18. Solvency Ratios 22.1 10.5 25.6 29.5 35.2 0 5 10 15 20 25 30 35 40 FY 14 FY 15 FY 16 FY 17 FY 18 Debt-Equity Ratio : Total Liabilities Total Equity 12.5 17.5 9.5 12.5 16.5 0 2 4 6 8 10 12 14 16 18 20 FY 14 FY 15 FY 16 FY 17 FY 18 Time Interest Earned Ratio : EBIT /Interest Expense 18This graph/chart is linked to excel, and changes automatically based on data. Just left click on it and select “Edit Data”.
  • 19. Conclusion Are the company’s financial statements audited, and if so for how long? Text Here Do the financial statements set forth all liabilities of the company, both current & contingent? Text Here Are the margins for the business growing or deteriorating? Text Here Are the company’s projections for the future and underlying assumptions reasonable and believable? Text Here How do the company’s projections for the current year compare to the board-approved budget for the same period? Text Here What normalized working capital will be necessary to continue running the business? Text Here What is the condition of assets and liens thereon? Text Here Has EBITDA and any adjustments to EBITDA been appropriately calculated? Text Here Are the company’s financial statements audited, and if so for how long? Text Here 19This slide is 100% editable. Adapt it to your needs and capture your audience's attention.
  • 21. What domestic and foreign patents (and patents pending) does the company have? 01 Has the company taken appropriate steps to protect its intellectual property? 02 What registered and common law trademarks and service marks does the company have? 03 What copyrighted products and materials are used, controlled, or owned by the company? 04 Is the company involved in any intellectual property litigation or other disputes? 05 What technology in-licenses does the company have and how critical are they to the company’s business? 06 Has the company granted any exclusive technology licenses to third parties? 07 What indemnities has the company provided third parties with respect to possible intellectual property disputes or problems? 08 Technology/ Intellectual Property 21
  • 23. Top Customers & Revenue S. No. Customer Revenue 1 - $ 2 - $ 3 - $ 4 - $ 5 - $ 6 - $ 7 - $ 8 - $ 9 - $ 10 - $ 11 - $ 12 - $ 13 - $ 14 - $ 23This slide is 100% editable. Adapt it to your needs and capture your audience's attention.
  • 24. Customer Concentration Issues/Risk This slide is 100% editable. Adapt it to your needs and capture your audience's attention. This slide is 100% editable. Adapt it to your needs and capture your audience's attention. This slide is 100% editable. Adapt it to your needs and capture your audience's attention. Risk Management Action ControlAnalysis 24
  • 25. Customer Satisfaction 2017 2018 57% 85% 75% Overall Satisfaction with Service Satisfaction with Value For Money Overall Satisfaction with Relationship 25This slide is 100% editable. Adapt it to your needs and capture your audience's attention.
  • 26. Other Customer Focus Areas Text Here Are there any warranty issues with current or former customers? Text Here What is the customer backlog? Text Here What are the sales terms/policies, and have there been any unusual levels of returns/ exchanges/ refunds? Text Here How are sales people compensated/motivat ed, and what effect will the transaction have on the financial incentives offered to employees? Text Here What seasonality in revenue and working capital requirements does the company typically experience? 26This slide is 100% editable. Adapt it to your needs and capture your audience's attention.
  • 28. Business Compatibility2 Press conferences ✓ 1 month before ✓ 2 days before Text Here Covered by 54 media outlets on an average Text Here Social Media and Web appearance Text Here 28 This slide is 100% editable. Adapt it to your needs and capture your audience's attention.
  • 29. Financial Compatibility What integration will be necessary, how long will the process take, and how much will it cost? What cost savings and other synergies will be obtainable after the acquisition? What marginal costs (e.g., costs of obtaining third party consents) might be generated by the acquisition? 29This slide is 100% editable. Adapt it to your needs and capture your audience's attention.
  • 31. Material Contract Checklist S. No. Checklist Y/N 1 Guaranties, loans, and credit agreements 2 Customer and supplier contracts 3 Agreements of partnership or joint venture; limited liability company or operating agreements 4 Contracts involving payments over a material dollar threshold 5 Settlement agreements 6 Past acquisition agreements 7 Equipment leases 8 Indemnification agreements 9 Employment agreements 10 Exclusivity agreements 11 Real estate leases/purchase agreements 12 License agreements 13 Powers of attorney 14 Franchise agreements 15 Equity finance agreements 16 Distribution, dealer, sales agency, or advertising agreements 17 Non-competition agreements Yes No 31This slide is 100% editable. Adapt it to your needs and capture your audience's attention.
  • 33. Management Organizational Chart Cindy J. Florence Tina Mou Rosie Green Max Brown Stephen Woods Jennie CurryEmployee Employee Employee Employee Employee Employee Grace Maria Employee David Meyer Employee James Kristy Employee Dona Madina Employee Julie Warren Employee Lora Blair Marketing Communication Manager Tony Williams Marketing Communication Manager Kate Jeter Responsibility 1 Derek Crisp Responsibility 2 Marketing Communication Manager Bill Durbin Marketing Director Robert Fowler Business Development Manager David Johnson 33This slide is 100% editable. Adapt it to your needs and capture your audience's attention.
  • 34. Key Issues Summary Of Labor Disputes This slide is 100% editable. Adapt it to your needs and capture your audience's attention. Employment And Consulting Agreements, Loan Agreements This slide is 100% editable. Adapt it to your needs and capture your audience's attention. Schedule Of Compensation Paid To Management Showing Separately Salary, Bonuses, & Non-cash Compensation This slide is 100% editable. Adapt it to your needs and capture your audience's attention. Summary Of Management Incentive Or Bonus Plans This slide is 100% editable. Adapt it to your needs and capture your audience's attention. 34
  • 36. Litigation Timeline 1 2 3 4 5 6 7 8 9 Event 1 12 Days 10 DaysEvent 2 17 DaysEvent 3 10 DaysEvent 4 Event 5 14 Days Week Milestone1 9/1/18 Milestone2 9/16/18 Milestone3 9/30/18 Milestone4 10/10/18 Milestone5 10/28/18 36This slide is 100% editable. Adapt it to your needs and capture your audience's attention.
  • 37. Litigation And Judicial Activities Litigation And Judicial Activities This slide is 100% editable. Adapt it to your needs and capture your audience's attention. Environmental Management This slide is 100% editable. Adapt it to your needs and capture your audience's attention. Disaster Management This slide is 100% editable. Adapt it to your needs and capture your audience's attention. International Affairs & Commerce This slide is 100% editable. Adapt it to your needs and capture your audience's attention. Correctional Activities This slide is 100% editable. Adapt it to your needs and capture your audience's attention. Natural Resources This slide is 100% editable. Adapt it to your needs and capture your audience's attention. 37
  • 38. Litigation KPIs Average Cost Per Lawsuit This slide is 100% editable. Adapt it to your needs and capture your audience's attention. Average Legal Opinion Response Time This slide is 100% editable. Adapt it to your needs and capture your audience's attention. % Litigation Cases 'Won' This slide is 100% editable. Adapt it to your needs and capture your audience's attention. 38
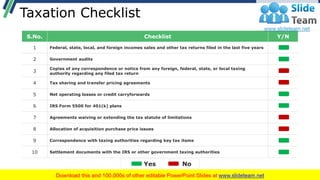
  • 40. Taxation Checklist S.No. Checklist Y/N 1 Federal, state, local, and foreign incomes sales and other tax returns filed in the last five years 2 Government audits 3 Copies of any correspondence or notice from any foreign, federal, state, or local taxing authority regarding any filed tax return 4 Tax sharing and transfer pricing agreements 5 Net operating losses or credit carryforwards 6 IRS Form 5500 for 401(k) plans 7 Agreements waiving or extending the tax statute of limitations 8 Allocation of acquisition purchase price issues 9 Correspondence with taxing authorities regarding key tax items 10 Settlement documents with the IRS or other government taxing authorities Yes No 40This slide is 100% editable. Adapt it to your needs and capture your audience's attention.
  • 42. Antitrust And Regulatory Issues Your Text Here Analyzing scope of any antitrust issues Your Text Here If the company has been involved in prior antitrust or regulatory inquiries or investigations Your Text Here How consolidation trends in the company’s industry might impact the likelihood and speed of antitrust or regulatory approval 42This slide is 100% editable. Adapt it to your needs and capture your audience's attention.
  • 43. Insurance Checklist S.No. Checklist Y/N 1 General liability insurance 2 D&O insurance 3 Intellectual property insurance 4 Car insurance 5 Health insurance 6 E&O insurance 7 Key man insurance 8 Employee liability insurance 9 Worker’s compensation insurance 10 Umbrella policies Yes No 43This slide is 100% editable. Adapt it to your needs and capture your audience's attention.
  • 45. Environmental Issues Your Text Here This slide is 100% editable. Adapt it to your needs and capture your audience's attention. 01 Your Text Here This slide is 100% editable. Adapt it to your needs and capture your audience's attention. 02 Your Text Here This slide is 100% editable. Adapt it to your needs and capture your audience's attention. 03 Your Text Here This slide is 100% editable. Adapt it to your needs and capture your audience's attention. 04 45
  • 46. General Corporate Matters 03 ▪ Point 1 ▪ Point 2 ▪ Point 3 ▪ Point 4 List of subsidiaries and their respective charter documents 04List of “No-shop” or exclusivity obligations ▪ Point 1 ▪ Point 2 ▪ Point 3 ▪ Point 4 01 ▪ Point 1 ▪ Point 2 ▪ Point 3 ▪ Point 4 List of current officers and directors 02 ▪ Point 1 ▪ Point 2 ▪ Point 3 ▪ Point 4 Lists of all security holders 46 This slide is 100% editable. Adapt it to your needs and capture your audience's attention.
  • 47. Related Party Transactions Any direct or indirect interest of any officer, director, stockholder or employee of the company in any business that competes with or does business with the company Any agreements with any officer, director, stockholder or employee that is entitled to compensation Any agreements where any officer, director, stockholder or employee has an interest in any asset 47 This slide is 100% editable. Adapt it to your needs and capture your audience's attention.
  • 48. Governmental Regulations, Filings, And Compliance With Laws This slide is 100% editable. Adapt it to your needs and capture your audience's attention. Plan Operations This slide is 100% editable. Adapt it to your needs and capture your audience's attention. Plan Documentation This slide is 100% editable. Adapt it to your needs and capture your audience's attention. Non-discrimination Testing Results This slide is 100% editable. Adapt it to your needs and capture your audience's attention. Government Reporting and Filing This slide is 100% editable. Adapt it to your needs and capture your audience's attention. Government Documents 48
  • 49. Property This slide is 100% editable. Adapt it to your needs and capture your audience's attention Title Reports This slide is 100% editable. Adapt it to your needs and capture your audience's attention Other interests in Real Property This slide is 100% editable. Adapt it to your needs and capture your audience's attention Financing Leases This slide is 100% editable. Adapt it to your needs and capture your audience's attention Operating Leases This slide is 100% editable. Adapt it to your needs and capture your audience's attention Deeds This slide is 100% editable. Adapt it to your needs and capture your audience's attention Deeds of Trust & Mortgages This slide is 100% editable. Adapt it to your needs and capture your audience's attention Leases of Real Property 49
  • 50. Yearly Production This slide is 100%editable. Adapt it to your needs and capture your audience’s attention. Product A 55 This slide is 100%editable. Adapt it to your needs and capture your audience’s attention. Product B 700 This slide is 100%editable. Adapt it to your needs and capture your audience’s attention. Product C 405 This slide is 100%editable. Adapt it to your needs and capture your audience’s attention. Product D 60 50
  • 52. Business Development Process Attract Visitors ▪ Blog Posts ▪ Articles ▪ Web Content ▪ Videos Gather Contact Info ▪ E-Newsletter ▪ Webinars ▪ E-Books ▪ White Papers More Interaction ▪ Phone Consultations ▪ Demos ▪ Assessments Request a Proposal ▪ Text Here ▪ Your Text Here 52 This slide is 100% editable. Adapt it to your needs and capture your audience's attention.
  • 55. Competitive Landscape US Competitor 1 Competitor 2 Competitor 3 Image 5 1 9 Experience 10 8 Capital 2 Credit 1 5 Revenue Sales 4 9 1 Location 9 Debt 3 Management 7 6 Investments 9 Poor – 1,2,3 Good – 4,5,6,7 Excellent – 8,9,10 55This slide is 100% editable. Adapt it to your needs and capture your audience's attention.
  • 56. Competitor Analysis Competitors Market Leader Challenger Niche Competitor Explanations Own Business Text Here Text Here Text Here ▪ Good Service ▪ Small Product Range ▪ We provide maintain flexibilty Competitor 1 Text Here Text Here Text Here ▪ Good Service ▪ Small Product Range ▪ We provide maintain flexibilty Competitor 2 Text Here Text Here Text Here ▪ Good Service ▪ Small Product Range ▪ We provide maintain flexibilty Competitor 3 Text Here Text Here Text Here ▪ Good Service ▪ Small Product Range ▪ We provide maintain flexibilty Competitor 4 Text Here Text Here Text Here ▪ Good Service ▪ Small Product Range ▪ We provide maintain flexibilty Competitor Text Here Text Here Text Here ▪ Good Service ▪ Small Product Range ▪ We provide maintain flexibilty Other Text Here Text Here Text Here ▪ Good Service ▪ Small Product Range ▪ We provide maintain flexibilty 56 This slide is 100% editable. Adapt it to your needs and capture your audience's attention.
  • 58. Due Diligence Summary Area 1 Solution 1 Area 2 Solution 2 Area 3 Solution 3 Area 4 Solution 4 Areas Of Concern Possible Solutions 58 This slide is 100% editable. Adapt it to your needs and capture your audience's attention.
  • 59. We back in 10 min This slide is 100% editable. Adapt it to your needs and capture your audience's attention. This slide is 100% editable. Adapt it to your needs and capture your audience's attention. This slide is 100% editable. Adapt it to your needs and capture your audience's attention. 01 02 03 Coffee Break Time 59
  • 61. Area Chart 0 10 20 30 40 50 60 70 80 90 100 DecNovOctSepAugJulJunMayAprMarFebJan SalesinPercentage(%) Financial Year 2018 This graph/chart is linked to excel, and changes automatically based on data. Just left click on it and select “Edit Data”. This slide is 100% editable. Adapt it to your needs and capture your audience's attention. Product01 This slide is 100% editable. Adapt it to your needs and capture your audience's attention. Product02 61
  • 62. Jan Feb Mar Apr May Jun This graph/chart is linked to excel, and changes automatically based on data. Just left click on it and select “Edit Data”. 62 Radar Chart This slide is 100% editable. Adapt it to your needs and capture your audience's attention. Product01 This slide is 100% editable. Adapt it to your needs and capture your audience's attention. Product02
  • 63. 12 10 30 50 48 43 25 23 0 10 20 30 40 50 60 $0 $10 $20 $30 $40 $50 SalesinPercentage(%) This graph/chart is linked to excel, and changes automatically based on data. Just left click on it and select “Edit Data”. 63 Bubble Chart This slide is 100% editable. Adapt it to your needs and capture your audience's attention. Product01 This slide is 100% editable. Adapt it to your needs and capture your audience's attention. Product02
  • 65. Our Mission This is a representative image, and should be replaced by your own image. Just right click and replace image. 01 This is a representative image, and should be replaced by your own image. Just right click and replace image. 02 65
  • 66. 66 John Smith Sofia Banks Graphic Designer This slide is 100% editable. Adapt it to your needs and capture your audience's attention. General Manager This slide is 100% editable. Adapt it to your needs and capture your audience's attention. Our Team
  • 67. 67 Target Audiences This slide is 100% editable. Adapt it to your needs and capture your audience's attention. Preferred By Many This slide is 100% editable. Adapt it to your needs and capture your audience's attention. Values Client This slide is 100% editable. Adapt it to your needs and capture your audience's attention. About Us
  • 68. Financial 68 Maximum 80% This slide is 100% editable. Adapt it to your needs and capture your audience's attention. Minimum 20% This slide is 100% editable. Adapt it to your needs and capture your audience's attention.
  • 69. Comparison 18 Minutes/Day Avg.Time Spent On Twitter 1,230,000,000 Users 350 Million Tweets Every Day 2017 2018 12:51 Minutes/Day Avg.Time Spent On Twitter 645,750,000 Users 500+ Million Tweets Every Day 2017 2018 69
  • 70. Puzzle This slide is 100% editable. Adapt it to your needs and capture your audience's attention. This slide is 100% editable. Adapt it to your needs and capture your audience's attention. This slide is 100% editable. Adapt it to your needs and capture your audience's attention. This slide is 100% editable. Adapt it to your needs and capture your audience's attention. This slide is 100% editable. Adapt it to your needs and capture your audience's attention. 01 02 03 04 05 70
  • 71. Target Text 1 Text 2 Text 3 Text 4 Text 5 Text 6 Text 7 Text 8 This slide is 100% editable. Adapt it to your needs and capture your audience's attention. 71
  • 72. Mind Map This slide is 100% editable. Adapt it to your needs and capture your audience's attention. This slide is 100% editable. Adapt it to your needs and capture your audience's attention. This slide is 100% editable. Adapt it to your needs and capture your audience's attention. 01 02 03 72
  • 73. Venn 02 01 03 This slide is 100% editable. Adapt it to your needs and capture your audience's attention. This slide is 100% editable. Adapt it to your needs and capture your audience's attention. This slide is 100% editable. Adapt it to your needs and capture your audience's attention. 73
  • 74. Magnifying Glass 01 02 03 04 05 This slide is 100% editable. Adapt it to your needs and capture your audience's attention. This slide is 100% editable. Adapt it to your needs and capture your audience's attention. This slide is 100% editable. Adapt it to your needs and capture your audience's attention. This slide is 100% editable. Adapt it to your needs and capture your audience's attention. This slide is 100% editable. Adapt it to your needs and capture your audience's attention. 74
  • 75. Bulb Or Idea This slide is 100% editable. Adapt it to your needs and capture your audience's attention. This slide is 100% editable. Adapt it to your needs and capture your audience's attention. This slide is 100% editable. Adapt it to your needs and capture your audience's attention. 01 02 03 75
  • 76. Address: # street number, city, state Contact Numbers: 0123456789 Email Address: emailaddress123@gmail.com For Your Business Thanks 76