


![4 Data Collection and Event Processing
30 ESM 101 Confidential
Collect Event Data
Event collection is the process of gathering information from network
nodes on your network. Network nodes may be primary (such as a
firewall or an IDS) or a concentrator (such as a syslog service, Symantec
SESA, or SiteProtector) that gathers data from multiple similar primary
network nodes. Events are then collected from these sources by ArcSight
SmartConnectors.
The data collected is log data generated by the different types of sources
on your network. Each item of the log is translated into one event. How
the data reaches the connector depends on the source that generates the logs.
For example, event data may be retrieved from databases, such as EPO or SiteProtector, or
sent as an event stream via the network, such as syslog or SNMP. In some cases, the data
is read from log files, and in other cases, it is pulled by the connector using proprietary
protocols, such as OPSEC (Check Point) or RDEP (Cisco IDS).
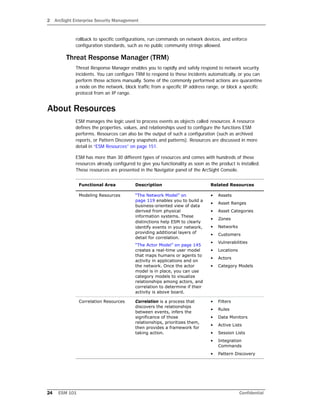
Normalize Event Data
Normalize means to conform to an accepted standard or
norm. Because networks are heterogeneous
environments, each device has a different logging format
and reporting mechanism. You may also have logs from
remote sites where security policies and procedures may
be different, with different types of network devices, security devices, operating systems
and application logs. Because the formats are all different, it is difficult to extract
information for querying without normalizing the events first.
The following examples are logs from different sources that each report on the same
packet traveling across the network. These logs represent a remote printer buffer overflow
that connects to IIS servers over port 80.
Check Point:
"14" "21Nov2013" "12:10:29" "eth-s1p4c0" "ip.of.firewall" "log"
"accept" "www-http" "65.65.65.65" "10.10.10.10" "tcp" "4" "1355" ""
"" "" "" "" "" "" "" "" "firewall" "len 68"
Cisco Router:
Nov 21 13:10:27: %SEC-6-IPACCESSLOGP: list 102 permitted tcp
65.65.65.65(1355) -> 10.10.10.10(80), 1 packet Cisco PIX: Nov 21
2005 12:10:28: %PIX-6-302001: Built inbound TCP connection 125891
for faddr 65.65.65.65/1355 gaddr 10.10.10.10/80 laddr
10.0.111.22/80
Snort:
[**] [1:971:1] WEB-IIS ISAPI .printer access [**] [Classification:
Attempted Information Leak] [Priority: 3] 11/21-12:10:29.100000
65.65.65.65:1355 -> 10.10.10.10:80 TCP TTL:63 TOS:0x0 ID:5752
IpLen:20 DgmLen:1234 DF ***AP*** Seq: 0xB13810DC Ack: 0xC5D2E066
Win: 0x7D78 TcpLen: 32 TCP Options (3) => NOP NOP TS: 493412860 0
[Xref => http://cve.mitre.org/cgi-bin/cvename.cgi?name=CAN-2001-
0241] [Xref => http://www.whitehats.com/info/IDS533]](https://image.slidesharecdn.com/esm1016-170530074016/85/ESM-101-for-ESM-6-8c-30-320.jpg)


![14 Managing Resources and Standard Content
164 ESM 101 Confidential
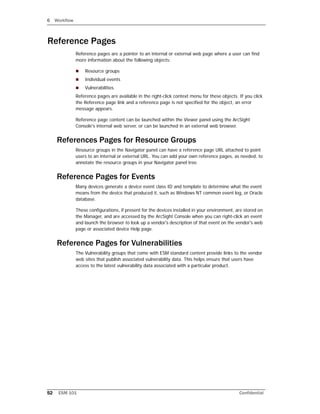
This content is installed automatically so that these functions and the infrastructure that
supports them are immediately available. To safeguard against accidental damage or
deletion, these resources are locked (read and write protected).
The core content infrastructure also serves the systems and solutions you deploy, and ESM
content you create yourself. The diagram below shows how the system content is used by
the ESM system.
The standard features included in the core content support basic ESM functions, such as
network modeling, correlation, basic monitoring, and benchmarking.
Use Cases
Use cases are a way to view, configure, and transport specially developed sets
of related resources that address specific security issues and business
requirements. Use cases are currently available for ArcSight-created content
only.
Once installed, use cases are presented in a new tab in the Navigator panel. When you
open a use case, the viewer panel displays all the different types of resources that make up
that use case and the types of devices whose events they operate on in a single view. This
makes it easy to see what resources are related to others.
For example, the ArcSight standard content usage scenario Internal Reconnaissance is
made up of two active lists, two data monitors, three filters, an asset category, two rules,
and a dashboard to monitor internal reconnaissance activity by users and machines. In the
Use Cases view, all these resources are displayed and accessible for editing from a single
panel.
Use cases are delivered by ArcSight in packages (ArcSight Resource Bundles [.arb]) ready
to be installed from the new Jumpstart directory. The Jumpstart directory delivers
ArcSight start-up content designed to streamline the process of getting your ESM
environment customized and online analyzing events quickly.](https://image.slidesharecdn.com/esm1016-170530074016/85/ESM-101-for-ESM-6-8c-164-320.jpg)


ESM 101 for ESM 6.8c
- 1. ESM 101 Concepts for ArcSight ESM 6.8c December 8, 2014
- 2. Copyright © 2015 Hewlett-Packard Development Company, L.P. Confidential computer software. Valid license from HP required for possession, use or copying. Consistent with FAR 12.211 and 12.212, Commercial Computer Software, Computer Software Documentation, and Technical Data for Commercial Items are licensed to the U.S. Government under vendor's standard commercial license. The information contained herein is subject to change without notice. The only warranties for HP products and services are set forth in the express warranty statements accompanying such products and services. Nothing herein should be construed as constituting an additional warranty. HP shall not be liable for technical or editorial errors or omissions contained herein. Follow this link to see a complete statement of copyrights and acknowledgements: http://www.hpenterprisesecurity.com/copyright Contact Information Revision History Phone A list of phone numbers for HP ArcSight Technical Support is available on the HP Enterprise Security contacts page: https://softwaresupport.hp.com/documents/10180/14684/esp- support-contact-list Support Web Site http://softwaresupport.hp.com Protect 724 Community https://protect724.hp.com Date Product Version Description 12/08/2014 ESM 6.8c Features update
- 3. Confidential ESM 101 3 Contents Chapter 1: About ArcSight ESM ........................................................................................... 9 Contacting Customer Support ........................................................................................... 9 ArcSight Send Log Utility .......................................................................................... 10 User Roles .................................................................................................................... 10 User Paths Through ESM .......................................................................................... 14 Chapter 2: ArcSight Enterprise Security Management ....................................................... 15 ESM Enables Situational Awareness ................................................................................. 15 ESM Anatomy ............................................................................................................... 16 SmartConnectors .......................................................................................................... 17 ArcSight Connector Appliance ................................................................................... 18 Supported Data Sources .......................................................................................... 19 FlexConnector ........................................................................................................ 20 Forwarding Connector .............................................................................................. 20 ArcSight Manager ......................................................................................................... 20 CORR-Engine Storage ................................................................................................... 20 User Interfaces ............................................................................................................. 21 The ArcSight Command Center ................................................................................. 21 The ArcSight Console ............................................................................................... 21 ArcSight Web ......................................................................................................... 21 ArcSight Risk Insight ..................................................................................................... 21 Pattern Discovery .......................................................................................................... 22 ArcSight Express ........................................................................................................... 22 Logger ......................................................................................................................... 23 ArcSight Solutions ......................................................................................................... 23 ArcSight NCM/TRM ........................................................................................................ 23 Network Configuration Manager (NCM) ................................................................ 23 Threat Response Manager (TRM) ......................................................................... 24 About Resources ........................................................................................................... 24 Chapter 3: Life Cycle of an Event Through ESM ................................................................. 27 Chapter 4: Data Collection and Event Processing .............................................................. 29 Collect Event Data ......................................................................................................... 30
- 4. Contents 4 ESM 101 Confidential Normalize Event Data .................................................................................................... 30 Event Severity ........................................................................................................ 31 Apply Event Categories .................................................................................................. 32 Event Categorization Utility ...................................................................................... 33 Look up Customer and Zone in Network Model .................................................................. 34 Filter and Aggregate Events ............................................................................................ 35 Configure SmartConnectors to Filter Out Events .......................................................... 35 Configure SmartConnector to Aggregate Events .......................................................... 35 Configure SmartConnector to Execute Commands ....................................................... 36 Managing SmartConnector Configurations ........................................................................ 36 Chapter 5: Priority Evaluation and Network Model Lookup ............................................... 37 Look Up the Network Model ............................................................................................ 37 Look Up the Actor Model ................................................................................................ 38 Evaluate the Priority Formula .......................................................................................... 38 Priority Rating ........................................................................................................ 40 Priority Evaluation Infrastructure ............................................................................... 41 Write Event to CORR-Engine Storage ............................................................................... 43 Chapter 6: Workflow ......................................................................................................... 45 Annotations .................................................................................................................. 46 Cases .......................................................................................................................... 47 Stages ......................................................................................................................... 48 Users and User Groups .................................................................................................. 49 Notifications ................................................................................................................. 49 How Notifications Work ............................................................................................ 50 Notification Groups .................................................................................................. 50 Escalation Levels ..................................................................................................... 50 Notification Destinations .......................................................................................... 51 Notification Acknowledgements ................................................................................. 51 Knowledge Base ............................................................................................................ 51 Reference Pages ........................................................................................................... 52 References Pages for Resource Groups ....................................................................... 52 Reference Pages for Events ...................................................................................... 52 Reference Pages for Vulnerabilities ............................................................................ 52 Chapter 7: Correlation Evaluation ..................................................................................... 53 Correlation Overview ..................................................................................................... 53 Filters .......................................................................................................................... 54 Named Conditions (Filters Resource) ......................................................................... 55 Unnamed Conditions ............................................................................................... 55 Filters in Active Channels ......................................................................................... 55 Filter Debugging ..................................................................................................... 56
- 5. Contents Confidential ESM 101 5 Rules ........................................................................................................................... 56 How Rules Work ..................................................................................................... 56 Standard Rules ....................................................................................................... 57 Joins ............................................................................................................... 57 Lightweight and Pre-persistence Rules ....................................................................... 57 Rule Aggregation .................................................................................................... 58 How Rules are Evaluated .......................................................................................... 58 Rule Actions and Thresholds ............................................................................... 59 Correlation Events Triggered by Rules .................................................................. 59 How Rules Use Active Lists ....................................................................................... 60 How Active Lists Work ....................................................................................... 61 How Rules Use Session Lists ..................................................................................... 63 Testing Standard Rules in a Rules Channel ................................................................. 63 Deploying Standard Rules in Real-Time Rules .............................................................. 63 Data Monitors ............................................................................................................... 65 Event-Based Data Monitors ...................................................................................... 65 Correlation Data Monitors ......................................................................................... 66 Non-Event Based Data Monitors ................................................................................ 67 How Correlation Uses Local and Global Variables ............................................................... 68 Velocity Templates ........................................................................................................ 69 Velocity Application Points ........................................................................................ 69 Examples of Velocity Expressions to Retrieve Values .................................................... 70 Event Types ................................................................................................................. 71 Raw Events ............................................................................................................ 71 Event Types in the Event Type Data Field ................................................................... 72 Other Types of Normalized Events ............................................................................. 72 Filtering Events ................................................................................................ 73 Monitoring ESM’s Audit Events ............................................................................ 73 Chapter 8: Monitoring and Investigation ........................................................................... 75 Active Channels ............................................................................................................ 75 Live Channels ......................................................................................................... 77 Rules Channels ....................................................................................................... 78 Resource Channels .................................................................................................. 78 Field Sets ..................................................................................................................... 79 Sortable Field Sets .................................................................................................. 79 Fields & Global Variables .......................................................................................... 79 Dashboards .................................................................................................................. 79 Event Graph Data Monitors ....................................................................................... 80 Event Graphs as a Monitoring Tool ............................................................................ 81 Event Graphs as an Investigation and Analysis Tool ..................................................... 82 Custom View Dashboards ............................................................................................... 83 Query Viewers .............................................................................................................. 84
- 6. Contents 6 ESM 101 Confidential Query Viewers as an Investigation and Analysis Tool ................................................... 85 Saved Searches and Search Filters .................................................................................. 86 Distributed Searches Among Peers .................................................................................. 87 Integration Commands .................................................................................................. 87 How Integration Commands Work ............................................................................. 88 Supported Command Types ...................................................................................... 89 How to Use Available Commands .............................................................................. 90 Chapter 9: Reporting and Incident Analysis ...................................................................... 93 Reports ........................................................................................................................ 93 Queries ................................................................................................................. 94 Trends ................................................................................................................... 95 Snapshot Trend ................................................................................................ 95 Interval Trend .................................................................................................. 96 How Trends Work ............................................................................................. 96 Templates .............................................................................................................. 97 Reports ................................................................................................................. 98 Archived Reports .............................................................................................. 98 Delta Reports ................................................................................................... 99 Focused Reports ............................................................................................... 99 Job Scheduler ......................................................................................................... 99 Scheduled Jobs Manager ...................................................................................100 ArcSight Pattern Discovery ............................................................................................100 Pattern Discovery Output: Snapshots and Patterns .....................................................101 Chapter 10: CORR-Engine ............................................................................................... 103 CORR-Engine Event Storage ..........................................................................................104 Active Retention Period ...........................................................................................104 Archives ...............................................................................................................105 Time- and Space-Based Storage Retention ................................................................105 System Storage ...........................................................................................................105 CORR-Engine Management ............................................................................................105 Chapter 11: The Event Schema ....................................................................................... 107 Event Data Fields .........................................................................................................107 Event Field Groups .................................................................................................108 Devices and Assets in the Event Schema .........................................................................111 Devices in the Event Schema ...................................................................................111 Assets in the Event Schema ....................................................................................112 Alternate Interface in the Event Schema .............................................................113 Devices and Connectors in a Network .............................................................................113 Source/Destination, Attacker/Target: An External Attack .............................................114 Source/Destination, Attacker/Target: A Trojan Attack .................................................115
- 7. Contents Confidential ESM 101 7 Destination/Target Only: A SysLog Reboot Report ......................................................116 Device Chain: Final Device and Original Agent ...........................................................117 Chapter 12: The Network Model ...................................................................................... 119 Network Model .............................................................................................................119 Assets ..................................................................................................................121 Auto-Created Assets .........................................................................................122 Managing Assets in Asset Channels ....................................................................124 Asset Ranges .........................................................................................................124 Zones ...................................................................................................................125 Dynamic and Static Zones .................................................................................126 Networks ..............................................................................................................127 Customers ............................................................................................................128 Network Modeling Resources Summary ...............................................................130 Ways to Populate the Network Model ..............................................................................131 ArcSight Console-Based Methods ..............................................................................131 Individually Using Network Modeling Resources ....................................................132 In a Batch Using the Network Modeling Wizard ....................................................132 SmartConnector-Based Methods ..............................................................................134 In a Batch Using the Asset Import FlexConnector .................................................134 Automatically From a Vulnerability Scanner Report ...............................................134 ArcSight-Assisted Methods ......................................................................................135 As an Archive File From an Existing Configuration Database ...................................135 Using Resource Graphs to Verify the Network Model ...................................................136 Asset Model .................................................................................................................136 Vulnerabilities ........................................................................................................137 How Vulnerability Scans Populate and Update the Network Model ...........................137 Reference Pages for Vulnerabilities .....................................................................139 Refer to External Databases Using External IDs ...................................................139 Calculating Event Priority ..................................................................................139 Locations ..............................................................................................................140 Asset Categories ....................................................................................................140 Asset Categories Assigned to Assets, Asset Ranges, and Asset Groups ....................141 Asset Categories Assigned to Zones ...................................................................142 Create Your Own Asset Categories .....................................................................143 Chapter 13: The Actor Model ........................................................................................... 145 How the Actors Feature Works .......................................................................................146 Actor Resource Framework ............................................................................................146 Actor Global Variables: Identifying Actors from Events ......................................................147 Using Standard Content to Track Actor Configuration Changes .....................................148 Actor Channels: Navigating Thousands of Actors ..............................................................148 Category Models: Analyzing Actor Relationships ...............................................................148
- 8. Contents 8 ESM 101 Confidential Actor Model Import Connector .......................................................................................148 Chapter 14: Managing Resources and Standard Content ................................................. 151 ESM Resources ............................................................................................................151 File Resource .........................................................................................................152 The ArcSight Archive Utility .....................................................................................153 Resource Graphs ....................................................................................................153 Uniform Resource Identifiers (URIs) and Resource Groups ...........................................154 Resource IDs .........................................................................................................156 Finding Resources ..................................................................................................158 Packages ....................................................................................................................158 Package States: Imported and Installed ....................................................................159 Package View ........................................................................................................159 Content Management ...................................................................................................160 Access Control Lists (ACLs) ............................................................................................161 User Access Controls ..............................................................................................161 Resource Access Controls ........................................................................................161 ACL Editor .............................................................................................................162 Standard Content .........................................................................................................162 Standard Content Foundations .................................................................................162 ArcSight System Content ........................................................................................163 Use Cases ...................................................................................................................164 Configuring Use Cases ............................................................................................165 Master Use Cases ............................................................................................165 Index ............................................................................................................................... 167
- 9. Confidential ESM 101 9 Chapter 1 About ArcSight ESM ArcSight Enterprise Security Management (ESM) is a comprehensive software solution that combines traditional security event monitoring with network intelligence, context correlation, anomaly detection, historical analysis tools, and automated remediation. ESM is a multi-level solution that provides tools for network security analysts, system administrators, and business users. ESM includes the Correlation Optimized Retention and Retrieval (CORR) Engine, a proprietary data storage and retrieval framework that receives and processes events at high rates, and performs high-speed searches. This book introduces the underlying concepts behind how ESM works, the unique features of the CORR-Engine, and provides a road map to the tools available in ESM depending on your role in security operations. After reading this book, you will have a clear understanding of: How ESM works in the context of your network ESM functions and features and how they are used at various points in the event life cycle Which users in your organization would use what ESM tools Key terms and concepts Contacting Customer Support If you require assistance while using ESM, go to HP Software Support Online at: http://softwaresupport.hp.com For contact information on various Technical Support locations, go to: http://www8.hp.com/us/en/software- solutions/software.html?compURI=1345981#.URitMaVwpWI You can also find answers to questions and connect with other ArcSight users on Protect 724, ArcSight’s user community at: https://protect724.hp.com “Contacting Customer Support” on page 9 “User Roles” on page 10
- 10. About ArcSight ESM 10 ESM 101 Confidential ArcSight Send Log Utility HP ArcSight Customer Support may request log files and other diagnostic information to troubleshoot problems. The Send Log utility automatically locates the log files, compresses them, and saves them. Using the Send Log utility, you can: Gather logs and diagnostic information for all components of the ESM system from the Console, Manager, or the embedded ArcSight Web. Gather diagnostic information such as thread dumps, and storage alert logs about your system. If you email the log to HP ArcSight Support at arst-support@hp.com, it can help them analyze performance issues on your components. Send Log can be run as a wizard, directly from the ArcSight Console interface, or from the command-line interface of each component. User Roles Implementing an ESM system within a security operations center takes planning. User roles help decision makers determine what skills and experience are needed to ensure a successful deployment. ESM provides User Groups and Access Control Lists (ACLs) to manage user access to certain functions and resources. Default User Groups and ACLs provide access control to certain resources upon installation (for more detail, see “Users and User Groups” on page 49). You can also create a custom user group to apply to a user role that you define, based on the needs of your security operations center. For more about access privileges, see “Access Control Lists (ACLs)” on page 161.
- 11. About ArcSight ESM Confidential ESM 101 11 The following pages provide a detailed description the general user roles and the default User Group they correspond to. User role Description User group Admin Administrators are responsible for overseeing the installation of the system and maintaining overall system health. Administrators install and configure the Manager, Console and SmartConnectors, and integrate ESM with devices from multiple vendors. Administrators also conduct basic functionality tests to verify that installation and configuration are complete. Administrators: • View ArcSight Status Monitors (ASMs) • Monitor Manager administration e-mails • Add and maintain ESM users and permissions • Maintain the health of the Manager and data store • Use the Packages and archive utilities to backup and support Manager deployments • Monitor the health of SmartConnectors and the devices that report to them • Design and maintain workflow infrastructure Admins should have an in-depth knowledge of: • Administration-related tools in the Console • Security policies and goals • Administrative maintenance of network devices • Data storage maintenance and archiving • Network resource management and performance Administrator
- 12. About ArcSight ESM 12 ESM 101 Confidential Author Authors (analyzer administrators) are responsible for developing use cases that address enterprise needs and goals. This role oversees the content that shapes the nature and direction of how investigation, historical analysis, and remediation are conducted in the security operations center. Authors: • Identify and design use cases that address specific enterprise needs • Evaluate existing standard content and use cases and adapt them to meet enterprise goals • Develop and test new correlation content and use cases using filters, rules, data monitors, active lists, and session lists • Develop and test new monitoring tools using active channels, dashboards, reports, and trends • Develop and post knowledge base articles; develop Pattern Discovery profiles Authors should have expert knowledge of: • Security policies and goals • Constructing effective content using ESM’s aggregation, Boolean logic and statistical analysis tools • Database query protocols • Network Infrastructure Analyzer Administrator Operator Security operations center operators are responsible for daily event monitoring and investigating incidents to a triage level. Operators observe real-time events and replay events using replay tools. They interpret events with the Event Inspector, and respond to events with preset, automated actions. They also run reports and refer to Knowledge Base articles. Operators: • Watch active channels and dashboards • Create annotations and create cases • Forward events and cases to analysts for further investigation If it is set up and configured, security center operators work with the linkage between ESM and external incident reporting systems, such as BMC Remedy. security center operators should have a working knowledge of: • Security policies and goals • ESM investigation tools: replay, event inspector, and views • Notification workflow procedures Operator User role Description User group
- 13. About ArcSight ESM Confidential ESM 101 13 Analyst Security analysts are responsible for specialized investigation and remediation when triggered into action by notifications from security center operators. Analysts may also be operators, or they can be specialists who respond to particular situations. Analysts: • Investigate incidents using channels, event graphs, annotations, cases, and reports • Recommend and implement responses Security analysts should have expert knowledge of: • Security policies and goals • Event traffic patterns and device log output • Investigation, remediation, and reporting procedures Operator/ analyst Business User The business user uses ESM to ascertain and communicate system conditions to other stakeholders using metrics. Business users are often also responsible for ensuring that regulatory compliance is met. Business users most often interact with reports, dashboards, notifications, and cases using the ArcSight Console or ArcSight Command Center. Operator or custom user group Super User A super user wears many hats within the security operations center. Although the duties of every user role may overlap with others, the super user has a high level of experience, and holds a senior security position that may encompass author, operator, and analysts roles. Super Users: • Are experts in the security field • Set security policies and goals • Construct effective content using aggregation, Boolean logic, and statistical analysis • Watch custom active channels and dashboards; investigate incidents • Recommend and implement responses Admin or custom user group User role Description User group
- 14. About ArcSight ESM 14 ESM 101 Confidential User Paths Through ESM The graphic below provides an overview of the general user paths through ESM depending on your role in the organization, and which documentation you can refer to for information about each. ESM 101 is a starting place for anyone interested in using ESM. Once the product is installed, all users have access to the online Help systems. The tasks associated with each major user group are addressed by the rest of the ESM documentation suite.
- 15. Confidential ESM 101 15 Chapter 2 ArcSight Enterprise Security Management ESM normalizes and aggregates data from disparate devices across your enterprise network, provides tools for advanced analysis and investigation, and offers options for automatic and workflow-managed remediation. ESM gives you a holistic view of the security status of all relevant IT systems, and integrates security into your existing management processes and workflows. ESM Enables Situational Awareness Like the security system at a major art museum, your network security operation must flawlessly protect objects of vital importance to your organization. At the art museum, security operations teams monitor, analyze, and investigate a continuous feed of data, including surveillance video, card reader logs, and tightly calibrated climate controls. One of the surveillance cameras detects a person testing a locked door. A card reader registers a log-in from a janitor who only works one day a week. The humidity control in the priceless painting collection wavered by a fraction of a percent. Are these isolated events, or part of a coordinated break-in attempt? Being able to correlate data from many different collection points and add logic, such as checking whether it’s the janitor’s day to work, or whether the person checking the locked “ESM Enables Situational Awareness” on page 15 “ESM Anatomy” on page 16 “SmartConnectors” on page 17 “ArcSight Manager” on page 20 “CORR-Engine Storage” on page 20 “User Interfaces” on page 21 “ArcSight Risk Insight” on page 21 “Pattern Discovery” on page 22 “ArcSight Express” on page 22 “Logger” on page 23 “ArcSight Solutions” on page 23 “ArcSight NCM/TRM” on page 23 “About Resources” on page 24
- 16. 2 ArcSight Enterprise Security Management 16 ESM 101 Confidential door has done it before to this or other doors in the building, is vital to knowing when and how to act. ESM collects, normalizes, aggregates, and filters millions of events from thousands of assets across your network into a manageable stream that is prioritized according to risk, vulnerabilities, and the criticality of the assets involved. These prioritized events can then be correlated, investigated, analyzed, and remediated using ESM tools, giving you situational awareness and real-time incident response time. Correlation—Many interesting activities are often represented by more than one event. Correlation is a process that discovers the relationships between events, infers the significance of those relationships, prioritizes them, then provides a framework for taking actions. Monitoring—Once events have been processed and correlated to pinpoint the most critical or potentially dangerous of them, ESM provides a variety of flexible monitoring tools that enable you to investigate and remediate potential threats before they can damage your network. Workflow—The workflow framework provides a customizable structure of escalation levels to ensure that events of interest are escalated to the right people in the right timeframe. This enables members of your team to do immediate investigations, make informed decisions, and take appropriate and timely action. Analysis—When events occur that require investigation, ESM provides an array of investigative tools that enable members of your team to drill down into an event to discover its details and connections, and to perform functions, such as NSlookup, Ping, PortInfo, Traceroute, WebSearch, and Whois. Reporting—Briefing others on the status of your network security is vital to all who have a stake in the health of your network, including IT and security managers, executive management, and regulatory auditors. ESM’s reporting and trending tools can be used to create versatile, multi-element reports that can focus on narrow topics or report general system status, either manually or automatically, on a regular schedule. HP offers on-demand, ready-made security solutions for ESM that you can implement as-is, or you can build your own solutions customized for your environment using ESM’s advanced correlation tools. ESM Anatomy ESM consists of several separately installable components that work together to process event data from your network. These components connect to your network via sensors
- 17. 2 ArcSight Enterprise Security Management Confidential ESM 101 17 that report to ArcSight SmartConnectors. SmartConnectors translate transaction data from devices into a normalized schema that becomes the starting point for correlation. The graphic below illustrates ESM’s basic components and additional ArcSight products that manage event flow, facilitate event analysis, and provide centralized network management and incident response. These components and products are described in the following pages.Individual SmartConnectors and/or a Connector Appliance gather and process event data from network devices and pass it to the Manager. The Manager processes and stores event data in the CORR-Engine. Users monitor events in ArcSight Web, and manage user groups and the CORR-Engine storage using the ArcSight Command Center, and develop content and perform advanced investigation on the ArcSight Console. A comprehensive series of optional products provide historical analysis-quality log management, network management and instant remediation, regulatory compliance, and advanced event analysis. SmartConnectors SmartConnectors, hosted individually, or as part of an ArcSight Connector Appliance, are the interface to the objects on your network that generate correlation-relevant data on your network. After collecting event data from network nodes, they normalize the data in two ways: normalizing values (such as severity, priority, and time zone) into a common format, and normalizing the data structure into a common schema. SmartConnectors can then filter and aggregate events to
- 18. 2 ArcSight Enterprise Security Management 18 ESM 101 Confidential reduce the volume of events sent to the Manager, which increases ESM’s efficiency and accuracy, and reduces event processing time. SmartConnectors also support commands that can execute commands on the local host, such as instructing a scanner to run a scan. SmartConnectors also add information to the data they gather, such as looking up IP and/or host names in order to resolve IP/host name lookup at the Manager. SmartConnectors perform the following functions: Collect all the data you need from a source device, so you do not have to go back to the device during an investigation or audit. Save network bandwidth and storage space by filtering out data you know will not be needed for analysis. Parse individual events and normalize them into a common schema (format) for use by ESM. Aggregate events to reduce the quantity of events sent to the Manager. Categorize events using a common, human-readable format. This saves you from having to be an expert in reading the output from a myriad of devices from multiple vendors, and makes it easier to use those event categories to build filters, rules, reports, and data monitors. Pass events to the Manager after they have been processed. Depending on the network node, some SmartConnectors can also instruct the device to issue commands to devices. These actions can be executed manually or through automated actions from rules and some data monitors. ArcSight releases new and updated SmartConnectors regularly. ArcSight Connector Appliance ArcSight Connector Appliance is a hardware solution that hosts the SmartConnectors you need in a single device with a web-based user interface for centralized management. ArcSight Connector Apliance offers unified control of SmartConnectors on the appliance itself, remote ArcSight Connector Appliances, and software-based SmartConnector installed on remote hosts. The ArcSight Connector Appliance: Supports bulk operations across all SmartConnector and is ideal in ArcSight deployments with a large number of SmartConnectors Provides a SmartConnector management facility in Logger-only environments Provides a single interface through which to configure, monitor, tune, and update SmartConnectors ArcSight Connector Appliance does not affect working SmartConnectors unless it is used to change their configuration. ArcSight Connector Appliance is an ideal solution when connectors target multiple heterogeneous destinations (for example, when Logger is deployed along with ESM), in an Logger-only environment, or when a large number of SmartConnectors are involved, such as in a MSSP deployment.
- 19. 2 ArcSight Enterprise Security Management Confidential ESM 101 19 Supported Data Sources ESM collects output from data sources with network nodes, such as intrusion detection and prevention systems, vulnerability assessment tools, firewalls, anti-virus and anti-spam tools, encryption tools, application audit logs, and physical security logs. The graphic below shows the Common network security data sources that ESM supports and ways you can analyze their output in ESM. For a complete list of products ESM supports, log in to the Protect 724 site: https://protect724.arcsight.com. Click the product documentation link, select ArcSight SmartConnector Documentation, and select Index to SmartConnector Configuration Guides. The guides on this index maps to the products supported by SmartConnectors. SmartConnectors can be installed directly on devices or separately on SmartConnector- dedicated servers, depending on the network node reporting to them. The SmartConnector can be co-hosted on the device if the device is a standard PC and its function is all software-based, such as ISS RealSecure, Snort, and so on. For embedded data sources,
- 20. 2 ArcSight Enterprise Security Management 20 ESM 101 Confidential such as most Cisco devices, and Nokia Checkpoint firewall appliances, co-hosting on the device is not an option. To learn more about deployment options, see the ArcSight ESM Installation and Configuration Guide. During configuration, a SmartConnector is registered to an ArcSight Manager, the central server component of the ESM solution, and configured with characteristics unique to the devices it reports on and the business needs of your network. By default, SmartConnectors maintain a heartbeat with the Manager every 10 seconds. The Manager sends back any commands or configuration updates it has for the SmartConnector. The SmartConnector sends new event data to the Manager in batches of 100 events, or once every second, whichever comes first. The time and event count intervals are all configurable. FlexConnector The FlexConnector framework is a software development kit (SDK) that enables you to create your own SmartConnector tailored to the nodes on your network and their specific event data. FlexConnector types include file reader, regular expression file reader, time-based database reader, syslog, and Simple Network Management Protocol (SNMP) readers. For more information about FlexConnectors and how to use them, contact your ArcSight customer service representative. Forwarding Connector The Forwarding Connectors forward events between multiple Managers in a hierarchical ESM deployment, and/or to one or more Logger deployments. For more about the Forwarding Connector, see the Connector Configuration Guide for ArcSight Forwarding Connector. ArcSight Manager The ArcSight Manager is the heart of the solution. It is a Java-based server that drives analysis, workflow, and services. It also correlates output from a wide variety of security systems. The Manager writes events to the CORR-Engine as they stream into the system. It simultaneously processes them through the correlation engine, which evaluates each event with network model and vulnerability information to develop real-time threat summaries. ESM comes with default configurations and standard foundation use cases consisting of filters, rules, reports, data monitors, dashboards, and network models that make ESM ready to use upon installation. You can also design the entire process that the Manager drives, from detection, to correlation, to escalation. The HP ArcSight Professional Services department is available to help with this design and set-up. CORR-Engine Storage The Correlation Optimized Retention and Retrieval (CORR) Engine is a proprietary data storage and retrieval framework that receives and processes events at high rates, and performs high-speed searches. For more about CORR-Engine, see “CORR-Engine” on page 103.
- 21. 2 ArcSight Enterprise Security Management Confidential ESM 101 21 User Interfaces ESM provides the following interfaces depending on your role and the tasks you need to perform. The ArcSight Command Center The ArcSight Command Center provides a streamlined interface for managing users, storage, and event data; monitoring events and running reports; and configuring storage, updating licenses, managing component authentication, and setting up storage notifications. With content management, you can establish peer relationships with other ESM installations, search, and synchronize ESM content across peers. Searches ranging from simple to complex are easy to configure and saved for regular use. For details about the ArcSight Command Center and how to use its features, see the ArcSight Command Center User’s Guide. The ArcSight Console The ArcSight Console is a workstation-based interface intended for use by your full-time security staff in a Security Operations Center or similar security-monitoring environment. It is the authoring tool for building filters, rules, reports, Pattern Discovery, dashboards and data monitors. It is also the interface for administering users and workflow. Depending on your role in the security operations center and the permissions you have, you can do anything in the ArcSight Console from routine monitoring to building complex correlation and long sequence rules, to performing routine administrative functions. The ArcSight Console version must match the Manager version to ensure that resources and schemas match. For details about the ArcSight Console and how to use its features, see the ArcSight Console User’s Guide. ArcSight Web ArcSight Web provides a secure web-based interface to the Manager. ArcSight Web provides event monitoring and drill-down capabilities in dashboards and active channels, reporting, case management, and notifications for Security Analysts. As a security feature, ArcSight Web does not allow authoring or administration functions. For details about ArcSight Web and how to use its features, see the ArcSight Web User’s Guide. The ArcSight Web version must match the Manager version so that the security certificate between the Manager and ArcSight Web match. ArcSight Risk Insight ArcSight Risk Insight is an add-on product that enables users to understand the business impact of real-time threats on assets. In ESM, users define asset business layers (including workstations, servers, laptops), use rules to calculate risks factors on these assets, and import the data into Risk InSight. Risk InSight aggregates the scores following the business model, and users assess the impact of a
- 22. 2 ArcSight Enterprise Security Management 22 ESM 101 Confidential specific threat that could present a risk factor on the business. Users build their own key performance indicators to monitor their organization’s business risks continuously. Once installed, access Risk InSight through the ArcSight Command Center. Refer to the ArcSight Risk Insight User’s Guide for details. Pattern Discovery Pattern Discovery can automatically detect subtle, specialized, or long-term patterns that might otherwise go undiscovered in the flow of events. You can use Pattern Discovery to: Discover day-zero attacks—Because Pattern Discovery does not rely on encoded domain knowledge (such as predefined rules or filters), it can discover patterns that otherwise go unseen, or are unique to your environment. Detect low-and-slow attacks—Pattern Discovery can process up to a million events in just a few seconds (excluding read-time from the disk). This makes Pattern Discovery effective to capture even low-and-slow attack patterns. Profile common patterns on your network—New patterns discovered from current network traffic are like signatures for a particular subset of network traffic. By matching against a repository of historical patterns, you can detect attacks in progress. The patterns discovered in an event flow that either originate from or target a particular asset can be used to categorize those assets. For example, a pattern originating from machines that have a back door (unauthorized program that initiates a connection to the attacker) installed can all be visualized as a cluster. If you see the same pattern originating from a new asset, it is a strong indication that the new asset also has a back door installed. Automatically create rules—The patterns discovered can be transformed into a complete rule set with a single mouse click. These rules are derived from data patterns unique to your environment, whereas predefined rules must be generic enough to work in many customer environments. Pattern Discovery is a vital tool for preventive maintenance and early detection in your ongoing security management operations. Using periodic, scheduled analysis, you can always be scanning for new patterns over varying time intervals to stay ahead of new exploitive behavior. ArcSight Express ArcSight Express is a separately licensed Security Information and Event Management (SIEM) appliance that provides the essentials for network perimeter and security monitoring by leveraging the superior correlation capabilities of ESM in combination with the Correlation Optimized Retention and Retrieval (CORR) Engine. ArcSight Express delivers an easy-to- deploy, enterprise-level security monitoring and response system through a series of coordinated resources, such as dashboards, rules, and reports included as part of ArcSight Express content. For more about ArcSight Express content, see the ArcSight Console Help topic ArcSight Express Content.
- 23. 2 ArcSight Enterprise Security Management Confidential ESM 101 23 Logger ArcSight Logger is an event data storage appliance that is optimized for extremely high event throughput. Logger stores security events onboard in compressed form, but can always retrieve unmodified events on demand for historical analysis-quality litigation data. Logger can be deployed stand-alone to receive events from syslog messages or log files, or to receive events in Common Event Format from SmartConnectors. Logger can forward selected events as syslog messages to ESM. Multiple Loggers work together to scale up to support high sustained input rates. Event queries are distributed across a peer network of Loggers. ArcSight Solutions PCI, HIPAA, Sarbanes-Oxley, fraud detection: many industries are increasingly subject to regulatory guidelines, or face common concerns. For these situations, ArcSight provides detailed, ready-made solutions for both ESM and Logger. ArcSight solutions collect relevant enterprise events across all locations and sources, and then correlate this data in real-time to detect compliance violations, data breaches or other fraudulent activity. ArcSight NCM/TRM ArcSight Network Configuration Manager and Threat Response Manager (NCM/TRM) is an appliance that builds and maintains a detailed understanding of your network’s topology, enabling you to centrally manage your network infrastructure and respond instantly, even automatically, to incidents as they occur. The NCM/TRM appliance enables you to: Instantly locate and quarantine any device connected to the network Apply protocol filters to curb an intrusion attempt Block specific IP ranges from communicating or block specific protocols Disable individual user accounts Centrally manage configuration changes on a single device or a group of devices Granularly audit the change control process Easily build wizards that enable you to delegate routine network administration tasks to lower-level administrators. The NCM/TRM solution consists of these two licensed software components, also known as managers: Network Configuration Manager (NCM) Threat Response Manager (TRM) Network Configuration Manager (NCM) Network Configuration Manager enables you to centrally manage all configuration-related tasks on a wide array of network devices. You can maintain several versions of configurations for each device, compare configurations before applying them to devices,
- 24. 2 ArcSight Enterprise Security Management 24 ESM 101 Confidential rollback to specific configurations, run commands on network devices, and enforce configuration standards, such as no public community strings allowed. Threat Response Manager (TRM) Threat Response Manager enables you to rapidly and safely respond to network security incidents. You can configure TRM to respond to these incidents automatically, or you can perform those actions manually. Some of the commonly performed actions are quarantine a node on the network, block traffic from a specific IP address range, or block a specific protocol from an IP range. About Resources ESM manages the logic used to process events as objects called resources. A resource defines the properties, values, and relationships used to configure the functions ESM performs. Resources can also be the output of such a configuration (such as archived reports, or Pattern Discovery snapshots and patterns). Resources are discussed in more detail in “ESM Resources” on page 151. ESM has more than 30 different types of resources and comes with hundreds of these resources already configured to give you functionality as soon as the product is installed. These resources are presented in the Navigator panel of the ArcSight Console. Functional Area Description Related Resources Modeling Resources “The Network Model” on page 119 enables you to build a business-oriented view of data derived from physical information systems. These distinctions help ESM to clearly identify events in your network, providing additional layers of detail for correlation. “The Actor Model” on page 145 creates a real-time user model that maps humans or agents to activity in applications and on the network. Once the actor model is in place, you can use category models to visualize relationships among actors, and correlation to determine if their activity is above board. • Assets • Asset Ranges • Asset Categories • Zones • Networks • Customers • Vulnerabilities • Locations • Actors • Category Models Correlation Resources Correlation is a process that discovers the relationships between events, infers the significance of those relationships, prioritizes them, then provides a framework for taking action. • Filters • Rules • Data Monitors • Active Lists • Session Lists • Integration Commands • Pattern Discovery
- 25. 2 ArcSight Enterprise Security Management Confidential ESM 101 25 Monitoring and Investigation Resources Active channels and dashboards are tools that monitor all the activity that ESM processes for your network. Each of these views enables you to drill down on a particular event or series of events in order to investigate their details. Saved searches are those you run on a regular basis. They include query statements, the associated field set, and a specified time range. Search filters contain only the query statements. You define and save searches and search filters in the ArcSight Command Center, and export these resources as packages in the ArcSight Console. • Active Channels • Field Sets • Saved Searches and Search Filters • Dashboards • Query Viewers Workflow and User Management Resources Workflow refers to the way in which people in your organization are informed about incidents, how incidents are escalated to other users, and how incident responses are tracked. • Annotations • Cases • Stages • Users and User Groups • Notifications • Knowledge Base • Reference Pages Reporting Resources Reporting resources work together to create batch- oriented functions used to analyze incidents, find new patterns, and report on system activity. • Reports • Queries • Trends • Templates • Focused Reports Administration Resources Administration resources are tools that manage ESM’s daily maintenance and long-term health. • Archive Utility • Packages • Files Standard Content Standard content is a series of coordinated resources that address common enterprise network security and ESM management tasks. Many of these resources are installed automatically with ESM to provide essential system health and status operations. Others are presented as install- time options organized by category. • Standard Content Foundations • Use Cases Functional Area Description Related Resources
- 26. 2 ArcSight Enterprise Security Management 26 ESM 101 Confidential
- 27. Confidential ESM 101 27 Chapter 3 Life Cycle of an Event Through ESM ESM processes events in phases to identify and act upon events of interest. The graphic below provides an overview of the major steps in the life cycle of an event. Data sources generate thousands of events. SmartConnectors, hosted individually or part of the ArcSight Connector Appliance, parse them into the ESM event schema. Each step narrows events down to those that are more likely to be of interest.
- 28. 3 Life Cycle of an Event Through ESM 28 ESM 101 Confidential Once the event stream is narrowed, ESM provides tools to monitor and investigate events of interest, track and escalate developing situations, and analyze and report on incidents. Event data is then stored and archived according to policies set during configuration. This process is detailed in the following topics: To learn more about the event schema, network model, actor model, and resource management, see the following topics: Chapter 4‚ Data Collection and Event Processing‚ on page 29 Chapter 5‚ Priority Evaluation and Network Model Lookup‚ on page 37 Chapter 6‚ Workflow‚ on page 45 Chapter 7‚ Correlation Evaluation‚ on page 53 Chapter 8‚ Monitoring and Investigation‚ on page 75 Chapter 9‚ Reporting and Incident Analysis‚ on page 93 Chapter 10‚ CORR-Engine‚ on page 103 Chapter 11‚ The Event Schema‚ on page 107 Chapter 12‚ The Network Model‚ on page 119 Chapter 13‚ The Actor Model‚ on page 145 Chapter 14‚ Managing Resources and Standard Content‚ on page 151
- 29. Confidential ESM 101 29 Chapter 4 Data Collection and Event Processing The first phase of the event life cycle is done by the SmartConnector. The SmartConnector is the conduit through which events arrive in ESM from devices. It identifies the endpoints represented in an event in the network model, and also performs the first layer of event tagging. SmartConnectors can also apply the first layer of filtering and event aggregation to reduce the volume of the event stream to make event processing faster and more efficient. A data source on a network node generates events, which are collected by an ArcSight SmartConnector. The connector normalizes the data into the ESM schema, then tags it with event categories and looks up zone and customer attributes from the ESM network model. You can also configure the SmartConnector to filter and aggregate events to reduce the volume of the event stream. “Collect Event Data” on page 30 “Normalize Event Data” on page 30 “Apply Event Categories” on page 32 “Look up Customer and Zone in Network Model” on page 34 “Filter and Aggregate Events” on page 35 “Managing SmartConnector Configurations” on page 36
- 30. 4 Data Collection and Event Processing 30 ESM 101 Confidential Collect Event Data Event collection is the process of gathering information from network nodes on your network. Network nodes may be primary (such as a firewall or an IDS) or a concentrator (such as a syslog service, Symantec SESA, or SiteProtector) that gathers data from multiple similar primary network nodes. Events are then collected from these sources by ArcSight SmartConnectors. The data collected is log data generated by the different types of sources on your network. Each item of the log is translated into one event. How the data reaches the connector depends on the source that generates the logs. For example, event data may be retrieved from databases, such as EPO or SiteProtector, or sent as an event stream via the network, such as syslog or SNMP. In some cases, the data is read from log files, and in other cases, it is pulled by the connector using proprietary protocols, such as OPSEC (Check Point) or RDEP (Cisco IDS). Normalize Event Data Normalize means to conform to an accepted standard or norm. Because networks are heterogeneous environments, each device has a different logging format and reporting mechanism. You may also have logs from remote sites where security policies and procedures may be different, with different types of network devices, security devices, operating systems and application logs. Because the formats are all different, it is difficult to extract information for querying without normalizing the events first. The following examples are logs from different sources that each report on the same packet traveling across the network. These logs represent a remote printer buffer overflow that connects to IIS servers over port 80. Check Point: "14" "21Nov2013" "12:10:29" "eth-s1p4c0" "ip.of.firewall" "log" "accept" "www-http" "65.65.65.65" "10.10.10.10" "tcp" "4" "1355" "" "" "" "" "" "" "" "" "" "firewall" "len 68" Cisco Router: Nov 21 13:10:27: %SEC-6-IPACCESSLOGP: list 102 permitted tcp 65.65.65.65(1355) -> 10.10.10.10(80), 1 packet Cisco PIX: Nov 21 2005 12:10:28: %PIX-6-302001: Built inbound TCP connection 125891 for faddr 65.65.65.65/1355 gaddr 10.10.10.10/80 laddr 10.0.111.22/80 Snort: [**] [1:971:1] WEB-IIS ISAPI .printer access [**] [Classification: Attempted Information Leak] [Priority: 3] 11/21-12:10:29.100000 65.65.65.65:1355 -> 10.10.10.10:80 TCP TTL:63 TOS:0x0 ID:5752 IpLen:20 DgmLen:1234 DF ***AP*** Seq: 0xB13810DC Ack: 0xC5D2E066 Win: 0x7D78 TcpLen: 32 TCP Options (3) => NOP NOP TS: 493412860 0 [Xref => http://cve.mitre.org/cgi-bin/cvename.cgi?name=CAN-2001- 0241] [Xref => http://www.whitehats.com/info/IDS533]
- 31. 4 Data Collection and Event Processing Confidential ESM 101 31 In order to productively store this diverse data in a common data store, SmartConnectors evaluate which fields are relevant and arrange them in a common schema. The choice of fields are content driven, not based on syntactic differences between what Checkpoint may call target address and what Cisco calls destination address. To normalize, SmartConnectors use a parser to pull out those values from the event and populate the corresponding fields in the schema. Here is a very simple example of these same alerts after they have been normalized. ArcSight refers to an event that has been processed by a SmartConnector or other ESM component that has gone through this schema normalization as a normalized event. Events that have been processed by the SmartConnector and are ready to be sent to the Manager are also referred to as base events. With the data organized, you can pull all records containing a value that is of interest or sort by any field. Another factor in normalization is converting timestamps to a common format. Since the devices may all use different time zones, ESM normalization converts the timestamps to UTC (GMT). ESM's normalization process captures and delivers to the correlation engine all the relevant security information collected by the sensors on your network that report to connectors. As source devices evolve, ArcSight releases regular updates to the connector parsers that perform normalization into the ESM schema. Event Severity During the normalization process, the SmartConnector collects data about the level of danger associated with a particular event as interpreted by the data source that reported the event to the connector. These data points, device severity and agent severity, become factors in calculating the event's overall priority described in “Evaluate the Priority Formula” on page 38. Device severity captures the language used by the data source to describe its interpretation of the danger posed by a particular event. For example, if a network IDS detects a DHCP packet that does not contain enough data to conform to the DHCP format, the device flags this as a high-priority exploit. Agent Severity is the translation of the device severity into ESM-normalized values. For example, Snort uses a device severity scale of 1-10, whereas Checkpoint uses a scale of high, medium and low. ESM normalizes these values into a single agent severity scale. The Date Time Event_N ame Src_IP Src_Port Tgt_IP Tgt_Po rt Device_T ype 21-Nov- 13 12:10:2 9 Accept 65.65.65. 65 1355 10.10.10 .10 80 CheckPoin t 21-Nov- 13 12:10:2 7 List 102 permitted tcp 65.65.65. 65 1355 10.10.10 .10 80 Cisco Router 21-Nov- 13 12:10:2 9 WEB-IIS ISAPI printer access 65.65.65. 65 1355 10.10.10 .10 80 Snort
- 32. 4 Data Collection and Event Processing 32 ESM 101 Confidential default ESM scale is Very Low, Low, Medium, High, and Very High. An event can also be classified as AgentSeverity Unknown if the data source did not provide a severity rating. For example, routine file access and successful authentications by authorized users would be translated into the ESM-normalized values as very low severity, whereas a short DHCP packet would be translated as very high severity. Apply Event Categories Like the logs themselves, different security devices also include a model for describing the characteristics of the events they process. But as described above, no two devices or vendors use the same event-characteristic model. To solve this problem, ArcSight has also developed a common model for describing events, which enables you to understand the real significance of a particular event as reported from different devices. This common model also enables you to write device-independent content that can correlate events with normalized characteristics. This model is expressed as event categories, and the SmartConnector assigns them using default criteria, which can be configured during connector set-up. Event categories are a series of six criteria that translate the core meaning of an event from the system that generated it into a common format. These six criteria, taken individually or together, are a central tool in ESM's analysis capability. Category Description Example values Object Object refers to the entity being targeted. • Application • Operating system • Resource • Router • User Behavior Behavior refers to what is being done to the object that is the target of the event. • Access • Authentication • Authorization • Execute • Modify Outcome Outcome describes whether the behavior attempted on the target object was successful. Outcome can be success, failure or an attempt. An attempt indicates that the action was neither successful nor failed, and the outcome is not clear, or that there is no clear statement that can be made about the outcome. • Attempt • Failure • Success
- 33. 4 Data Collection and Event Processing Confidential ESM 101 33 For a detailed look at all the default values for ESM's event categories, see the ArcSight Console Help topic Categories. Event Categorization Utility Events from unsupported or custom devices can generate events that the provided connectors do not know how to categorize. For example, if your organization has developed and deployed ArcSight FlexConnectors to collect and process events specific to customized network nodes, these "custom" events are not categorized by the usual method. From the ArcSight Console, you can manually apply categorization to one or more custom events from a FlexConnector (or other custom or unsupported device). Once you apply categorization to events from a particular device (and its associated connector), the categorization is automatically applied to other events of the same type. Technique Technique describes the nature of the behavior the event represents. If the event is considered an attack, this identifies the method of the attack. Viewed in conjunction with Outcome, Technique lends urgency to a serious attack that was also a success, or suggests that a serious attack that was an attempt should be investigated further. • Exploit • Brute force • Code execution • Scan • Denial of service Device Group Many security devices serve multiple purposes. For example, Intrusion Prevention Systems generate firewall events as well as intrusion detection events. The Device group category indicates whether an event is one type or another, which enables you to query for one type of event or another, such as all firewall events. A firewall event query on the IPS device would return all the firewall messages from the device and all the firewall messages in an operating system log (such as iptables). • Assessment tool • Security info manager • Firewall • IDS • Identity Management • Operating System • Network equipment • VPN Significance Significance indicates the relative security risk of an event based on many data points, including information from the device itself, information entered into the ESM data model about the assets involved, and values from the other event categories. The value assessed here can inform security operations center staff and analysts about the nature of an event so they can prioritize which events to investigate first. If an event is normal activity, it probably does not require further investigation. If an event is considered suspicious, hostile, or a compromise, it needs investigation. • Normal • Informational • Reconnaissance • Suspicious • Hostile • Compromise Category Description Example values
- 34. 4 Data Collection and Event Processing 34 ESM 101 Confidential The example below shows an event generated by the real-time flow monitoring device, Qosient Argus. By default, the Argus SmartConnector does not apply event categories to these events. You can set the event categories you want these events to represent, which then apply to all subsequent events of this type. The Categorize Event utility available in the ArcSight Console makes it possible to set event categories for events whose Connectors do not already provide event categories. For more about the event categorization utility, see the ArcSight Console Help topic Custom Event Categorization. Look up Customer and Zone in Network Model To help the Manager properly identify the endpoints involved in event traffic, the SmartConnector looks up two attributes of the network model: Customer and Zone. (The network model is described in more detail in Chapter 12‚ The Network Model‚ on page 119.) Customer is an optional designation that can be applied to a network asset, which associates events processed by that network asset with a specific customer or business unit. The customer tag comes into play in a managed security service provider (MSSP) environment, or anytime a network must have distinct cost centers. If you have customers defined in your network model, the connector is configured with these customer tagging attributes. Customers are discussed in more detail in “Customers” on page 128. A zone is a portion of a network that represents a contiguous range of IP addresses. Zones often also represent a functional group within the network or a subnet, such as a wireless LAN, the engineering network, the VPN or the DMZ. Zones are also how ESM resolves private networks whose IP ranges may overlap with other existing IP ranges.
- 35. 4 Data Collection and Event Processing Confidential ESM 101 35 Zones are set at the Manager and pushed to the SmartConnector by the Manager as part of its normal administrative handshake with the connector. Zones are discussed in more detail in “Zones” on page 125. Filter and Aggregate Events SmartConnectors can be configured with filter conditions and aggregation logic that focus and reduce the volume of events sent to the Manager. Configure SmartConnectors to Filter Out Events Filters for SmartConnectors are exclusive (filter out). Events that meet the connector filtering criteria are not forwarded to the Manager. During SmartConnector set up, you can configure the connector to use filter conditions that do not pass events to the Manager according to specific criteria. For example, you can use filters to exclude events with certain characteristics or events from specific network devices. For more about filters, see “Filters” on page 54. Configure SmartConnector to Aggregate Events You can configure the SmartConnector to aggregate (summarize and merge) events that have the same values in a specified set of fields, either a specified number of times, OR within a specified time limit. Connector aggregation merges events with matching values into a single aggregated event. The aggregated event contains only the values the events have in common plus the earliest start time and latest end time. This reduces the number of individual events the Manager has to evaluate. For example, suppose the connector is configured to aggregate events with a certain source IP and port, destination IP and port, and device action if they occur 10 times in 30 seconds. If the connector receives 10 events with these matching values within that time, they are grouped into a single aggregated event with an aggregated event count of 10. If the 30-second time frame expires and the connector has received only two matching events, the connector will create a single aggregated event with an aggregated event count of two. If 900 matching events come in during the 30 seconds, the connector would create 90 aggregated events, each with an aggregated event count of 10.
- 36. 4 Data Collection and Event Processing 36 ESM 101 Confidential ESM refers to this process as "grouping by" those fields. Group by appears again in other ESM features, such as rules, data monitors, and reports. Aggregation starts when an event arrives with values in the group by fields that match the specified conditions. Aggregation continues until either a set time limit is reached or a set event count is reached. Firewalls are a good candidate for aggregation because of the volume of events with similar data coming from multiple devices. Configure SmartConnector to Execute Commands SmartConnectors can be configured to issue basic event flow-control commands, such as stop, start, and pause; get the operational status of a SmartConnector; or in some cases, to issue control commands to the underlying operating system of the machine upon which the SmartConnector is installed. Connectors that support commands to the host device include: Cisco IDS RDEP, Cisco IDS SDEE (support “Get Device Status” command, which gets the status of sensors) ArcSight Threat Response Manager Check Point Firewall-1 SAM Solsoft Policy Server The commands to be issued can be set automatically in rule actions, which get triggered by specific event conditions. For more about rule actions, see “Rule Actions and Thresholds” on page 59. For more about how to configure SmartConnectors to execute commands, see the SmartConnector User Guide. Managing SmartConnector Configurations All the configurable attributes of SmartConnectors are set when the connector is installed. These attributes can be edited after installation by the Administrator using the Connector resource. The Connector resource enables the Administrator to configure SmartConnector attributes and behavior, such as: SmartConnector name, ID, location, owner, creation, and update information The ESM network with which the connector is associated The default behavior of the connector, such as batching, time correction, cache size, Manager connection attributes, aggregation parameters, or filters The alternate behavior of the connector, which can be initiated in an alternate environment, such as a test environment For complete instructions about what connector attributes to configure and how, see the SmartConnector User Guide.
- 37. Confidential ESM 101 37 Chapter 5 Priority Evaluation and Network Model Lookup The SmartConnector sends normalized base events to the Manager, where they receive more classifications and are logged in CORR-Engine storage and processed through the correlation engine. The following figure depicts the flow for identifying events and determining their priority. The SmartConnector sends the aggregated and filtered events to the Manager, where they are evaluated and tagged with network and actor modeling information, and priority levels, then stored in CORR-Engine storage. Look Up the Network Model ESM uses a data model to describe the characteristics of your network and the business application of its assets. Collectively, these characteristics are called the Network Model. The Manager looks up the network model classifications set for your environment, which enables the Manager to properly identify the endpoints involved in an event. “Look Up the Network Model” on page 37 “Look Up the Actor Model” on page 38 “Evaluate the Priority Formula” on page 38 “Write Event to CORR-Engine Storage” on page 43
- 38. 5 Priority Evaluation and Network Model Lookup 38 ESM 101 Confidential To learn more about the network model, see “Network Model” on page 119. Look Up the Actor Model ESM also uses a data model to normalize user information stored in different formats in different authentication data stores to create a profile that identifies users on your network. Leveraging the Actor Resource Framework, the Manager identifies actors using whatever user identity attributes are available in events arriving from different sources from across the network. The actors feature real-time user model maps humans or agents to activity in applications and on the network. Once the actor model is in place, you can use category models (see Category Models: Analyzing Actor Relationships) to visualize relationships among actors, and correlation to determine if their activity is above board. Actors require a separate license. To learn more about this feature, see “The Actor Model” on page 145. Evaluate the Priority Formula The priority formula (sometimes referred to as the threat level formula) is a series of five criteria that each event is evaluated against to determine its relative importance, or priority, to your network. Priority evaluation is an automatic feature that is always "on," and is applied to all the events received by the Manager. The point of calculating an event's priority is to signal to security operations personnel whether this is an event that warrants further notice. The priority formula consists of four factors that combine to generate an overall priority rating. Each of the criteria described in the table below contributes a numeric value to the priority formula, which calculates the overall importance, or urgency, of an individual event. All values are between 0 and 10, where 0 is low and 10 is high. A high priority factor indicates an event with a higher risk factor. Not every high priority event is necessarily a threat, however. For example, if a critical e-mail server fails, the priority of the events reporting it may be very high, although it does not represent an attack on your network. The table below describes the factors considered in the ESM priority evaluation. These values are configurable with HP assistance. The maximum score for each factor is 10: if the value of conditions for that factor is more than 10, the amount over 10 is not considered. Priority factor Description Model Confidence Model confidence refers to whether the target asset has been modeled in ESM and to what degree. Maximum score = 10. +4 Target asset is modeled in ESM and its asset ID is present. If these are the only data points present for the asset, this is likely an asset range or a system that was modeled manually. +4 Target asset has been scanned for open ports. +4 Target asset has been scanned for vulnerabilities.
- 39. 5 Priority Evaluation and Network Model Lookup Confidential ESM 101 39 Relevance Relevance refers to whether or not an event is relevant to an asset based on whether the event contains ports and/or known vulnerabilities, and if so, whether those vulnerabilities and/or ports are exposed on the asset. If an asset does not expose the vulnerabilities or ports contained in the event, the event is not relevant to the asset. Maximum score = 10. +5 +5 Severity Severity is a history function. Has the system been attacked, has it been compromised, or has the attacker scanned or attacked the network in the past? Scores are assigned based on the attacker and target's presence in one of ESM's threat tracking active lists (/All Active Lists/ArcSight System/Threat Tracking), whose contents are updated automatically by ESM rules. Maximum score = 10. +6 The asset appears as an attacker in the active list /ArcSight System/Threat Tracking/Infiltrators List. +5 The asset appears as an attacker in the active list /ArcSight System/Threat Tracking/Hostile List. +3 The asset appears as a target in the active list /ArcSight System/Threat Tracking/Compromised List. +3 The asset appears as an attacker in the active list /ArcSight System/Threat Tracking/Suspicious List. +1 Asset appears as an attacker in the active list /ArcSight System/Threat Tracking/Reconnaissance List. Priority factor Description
- 40. 5 Priority Evaluation and Network Model Lookup 40 ESM 101 Confidential Priority Rating The priority of an event is a calculated overall rating based on agentSeverity (see “Event Severity” on page 31) adjusted by Model Confidence, Relevance, Severity, and Criticality using a detailed formula. The four priority formula factors and agentSeverity are all fields in the ESM event schema (see “Event Data Fields” on page 107), and can thus be used in correlation. The priority rating is color coded and displayed in the active channel, as shown below (active channels are part of monitoring events, and are described in “Active Channels” on page 75). You can sort events in the grid view according to priority. Priority is a good basis for deciding what to look at first in your monitoring workflow. You can also use priority as a criterion when building filters, rules, reports, and data monitors. Asset Criticality Asset criticality measures how important the target asset is in the context of your enterprise as set by you in the network modeling process by using the standard asset categories /System Asset Categories/Criticality/Very High, High, Medium, Low, and Very Low. For example, customer-facing systems or devices with access to confidential information would be classified as criticality level of High, whereas a staging or test system may have a criticality level of Low. Maximum score = 10. +10 The asset is found by the filter /System Asset Categories/Criticality/Very High +8 The asset is found by the filter /System Asset Categories/Criticality/High +6 The asset is found by the filter /System Asset Categories/Criticality/Medium +4 The asset is found by the filter /System Asset Categories/Criticality/Low +2 The asset is found by the filter /System Asset Categories/Criticality/Very Low +0 The asset is not categorized with any of the above categories. Priority factor Description
- 41. 5 Priority Evaluation and Network Model Lookup Confidential ESM 101 41 The Priority column in the default live channel view shows the overall priority rating for each event based on calculations from the other five priority criteria. The score and color scale used in the priority display are as follows: For more about calculating event priority using vulnerability and open port information, see “Calculating Event Priority” on page 139. Priority Evaluation Infrastructure The priority formula is supported by network model classifications, active lists, filters, and rules that track an event's classification based on conditions included in the threat tracking and priority evaluation resources included in the core content. Priority Color Description 0-2 Green Very low. This event is a routine function, such as file access or a authentication by an authorized user. An event that may have started out with a higher priority can become very low priority when it is proved to have failed. 3-4 Blue Low. This event is likely to be a common function, such as a setting change or a scheduled system scan. 5-6 Yellow Medium. This event is a potential concern, such as pre- attack scan activity, policy violations, and identified vulnerabilities. Medium priority events are often hostile attempts whose success or failure is not confirmed. 7-8 Orange High. This event is a concern, such as attack formations, potential breaches, or misuse, including traffic to a dark address space, incorrect registry values, or a SYNFlood. 9-10 Red Very high. This event is a grave concern, such as verified breaches or a DHCP packet without enough data. Investigate items with a very high priority immediately.
- 42. 5 Priority Evaluation and Network Model Lookup 42 ESM 101 Confidential The diagram below shows the layers of ArcSight resources that influence priority evaluation. For a full list and description of the Priority Formula resources, see the Standard Content Guide - ArcSight System and ArcSight Administration.
- 43. 5 Priority Evaluation and Network Model Lookup Confidential ESM 101 43 Threat tracking and evaluation is based on the priority formula and managed through a multi-tiered infrastructure of resources that tracks events and their priority based on aggregated conditions. Write Event to CORR-Engine Storage At this point in the process, the event is written to the Correlation Optimized Retention and Retrieval (CORR) Engine with the addition of its priority level and complete network model data. If there is a problem with the CORR-Engine, the event flow will stop here. Possible problems could be that storage could be full, or the network connection between the Console and the Manager is down. If there is such a problem with the CORR-Engine, SmartConnector data stops flowing into the Manager and correlation activity stops. However, all event data is saved on the Manager until the CORR-Engine is back up, so no event data is lost. As a configuration safeguard, the cache on the Manager should be set with ample space to store event traffic should the CORR-Engine develop a problem. Customizing the Priority Formula The Priority Formula is designed to give out-of-the-box prioritization to the great majority of security related situations. It is possible, however, you can tune the Priority Formula to evaluate special situations, such as fraud scenarios. For example, the FraudView solution package available for ESM uses a customized Priority Formula that assigns different weights to certain scenarios. ESM systems with a modified Priority Formula must operate independenty from other ESM installations. To find out whether this type of tuning is appropriate for your situation, contact HP ArcSight Technical Support (http://softwaresupport.hp.com.)
- 44. 5 Priority Evaluation and Network Model Lookup 44 ESM 101 Confidential
- 45. Confidential ESM 101 45 Chapter 6 Workflow Workflow is concerned with how people in your organization are informed about incidents and tracking their responses to them. Workflow also involves escalating an incident to other users. You can escalate incidents manually or automatically using ESM workflow tools. ESM provides several ways for users to collaborate and track incidents using ESM's workflow tools. The ESM workflow system consists of the following resources: The graphic below shows one way in which ESM's workflow tools can be used to escalate events through your security operations center. You can use one, all, or none of these elements in various combinations to suit your needs. This view shows the default settings for annotation stages and case stages. The designations for both workflows can be customized “Annotations” on page 46 “Cases” on page 47 “Stages” on page 48 “Users and User Groups” on page 49 “Notifications” on page 49 “Knowledge Base” on page 51 “Reference Pages” on page 52
- 46. 6 Workflow 46 ESM 101 Confidential The following diagram shows how ESM’s workflow tools work together. Annotations can be used to track individual events. Cases can be used to track individual or multiple related events, and to export event data to third-party products. Stages and Notifications are a repository for the structure of your workflow and the people you need to notify. Once created, Cases may be exported to a third-party tool at any point in the workflow. Annotations Annotations are a light-weight workflow tool you can use to track and escalate events through your workflow. Annotations is a field in the ESM event schema that enables you to flag an individual event or groups of related events for follow-up. You can assign that event to a particular user or user group to escalate it through your workflow structure, or you can
- 47. 6 Workflow Confidential ESM 101 47 use annotations to find events with similar attributes within a specified time frame. This enables you to find new events coming into the system with attributes similar to the annotated event. Annotations are not displayed as an ESM resource, but are provided as a user-editable extension of the ESM event schema. (See “Event Data Fields” on page 107). They can be created through a user's notifications in-box and the Event Annotations column in the active channel, or as an automated action as the result of a rule trigger. Once created, they can be used as a factor anywhere event fields can be cited, such as rules, data monitors, reports, filters, and so on. Annotations are a flexible tool and can be used in different ways depending on how your workflow environment is set up. You can use annotations to track every event that makes it through the ESM correlation engine; you can use it as a triage tool before escalating an event to a case; or you can choose not to use it at all and simply use ESM's case management system. Whenever an annotation is created or updated, the action triggers the active channel to be refreshed to reflect the annotation changes. You can also build a channel that shows all events that have been annotated and assigned to you for follow up. Cases Cases are ESM's built-in trouble-ticket system, designed to track individual or multiple related events and export event data to third-party products. Cases are designed to stand alone within ESM or integrate with a third-party case management system. A case is a container for information about a specific incident, usually with one or more events attached, that is used to track, investigate, and resolve events of interest. When events of concern occur, you can create cases and assign them to analysts, who can then investigate and resolve them based on severity and enterprise policies and practices. You can also use rules to automatically open a case when certain conditions are met. With the ESM case management system, you can create new cases and assign them to specific groups of users who receive a notification with access to the case and its associated data. Those users can take action on the assigned case and specify other actions to be taken, assign it to another user, or resolve the case. If you already have an existing case management system, you can configure ESM to integrate with it. For the Remedy Action Request System, use an application called ArcRemedyClient. You can use Remedy to provide supplemental or alternative ticketing, tracking and workflow support for ArcSight security event data. ArcRemedyClient can send events to its case manager without using the ArcSight Case Management System, or can be configured to supplement ArcSight Case Management. ArcRemedyClient runs in the background as a service, transferring data from ArcSight to Remedy. ArcRemedyClient can also be configured to update the CORR-Engine with Remedy status. For more about ArcRemedyClient, ask your HP Customer Service representative.
- 48. 6 Workflow 48 ESM 101 Confidential Stages Stages are the various steps that make up a collaborative workflow for event annotations. Once this structure is defined, individual events can be assigned to the various stages by security operations personnel who are investigating events. Stages are assigned to individual events using event annotations. You can assign stages to an event from an active channel view by right-clicking an event, or opening it in the event Inspector. Scroll down to Event Annotation and look for the Stage series of actions. ESM comes with the following default stages. You can use these stages or modify the structure to match your own workflow. The work can flow between different users with different roles. The operator performs the first review. Unresolved threats are assigned to analysts. If the operator spots a trend or group of events that represent a unified threat, they may create a case to contain them. Analysts may create additional cases in order to track interesting incidents or to expose the incident to an external database. Once the case or event has been closed, a supervisor Stage Description User Group Queued The event has not yet been inspected. Operator Initial The event has been inspected. Operator Follow-up The event is under investigation. Operator, Analyst Flagged as Similar The event is similar to one already under investigation. Analyst Monitoring The event is being watched to see if it recurs in a pattern. Operator, Analyst Rule Created The event has been used to create a rule to facilitate finding recurrences and generating notifications. Operator, Analyst Final The investigation has concluded. Operator, Analyst Closed The investigation is closed. Operator, Analyst
- 49. 6 Workflow Confidential ESM 101 49 may review that decision and either finalize the closure, or re-open the case or annotated event. Users and User Groups The Users resource is where the ESM administrator registers new users. Individuals can use the Users resource to manage their profiles, including contact information. Users gain access to resources according to the user groups they belong to, and it is also at the Users resource where the administrator creates and manages user groups. Permissions to view and edit resources is granted to user groups. Users can also view the attributes of the user groups to which they belong to find out what permissions they have to read from and write to certain resource groups. These settings are accessed in the ACL editor, which is described in more detail in “Access Control Lists (ACLs)” on page 161. ESM comes with the following standard user groups. You can use these groups, or create your own custom user groups. For more about users and user groups, see User Groups in the Console Help. Notifications The notifications destination resource is the mechanism by which you can designate individual users or user groups in your organization to receive notifications about certain conditions. Notification messages themselves are delivered by e-mail, pager, text message, or the ArcSight Console. A notification can be initiated as an automatic action in a rule that has been triggered by matching conditions. Notifications can also be initiated as a result of system alerts generated when an ESM component needs administrative attention. You can also set a notification to be sent when a case is opened or modified. User group User group description Admin The admin registers new users and manages ESM system health. Author Authors, also called Analyzer Administrators, evaluate ESM standard content and adapt it and create new content to meet your company's security and network analysis requirements. Operator Operators monitor active channels and dashboards, and perform triage-level investigation. Analyst Analysts, also called Operator/Analysts, investigate events that have been forwarded to them by security operations center staff and other users.
- 50. 6 Workflow 50 ESM 101 Confidential How Notifications Work When a rule that contains a notification action is triggered, the ESM notification engine notifies all active destinations in the first escalation level within the notification group. The notification engine then waits for a certain time period for a user to acknowledge having received the notification. If no acknowledgment is received within the specified time interval, the same notification is escalated to the next level within the group. This process repeats until there are no more escalation levels or the notification is acknowledged by the appropriate recipients. The notification structure contains notification groups, escalation levels, and destinations. Notification groups contain escalation levels, which define a notification hierarchy. Notification destinations specify the user groups to be notified when certain conditions are met. Notification Groups Notification Groups are the interface between the rules engine and the notification engine that sends out the notification. Notification groups are a container for escalation levels and notification destinations. The example above shows the standard notification groups included with ESM. You can add escalation levels and notification destinations to these, and/or create your own notification groups. Escalation Levels Escalation levels define a hierarchy structure for whom to notify in what order. There can be any number of escalation levels within a notification group. Each escalation level can contain multiple notification destinations.
- 51. 6 Workflow Confidential ESM 101 51 The example above shows the standard escalation levels defined for the notification group security center Operators in ESM's standard content. Level 1 contains one notification destination, the standard user group admin. Notification Destinations A notification destination is the entity to be notified of a specific condition. The notification destinations are what you can select from when adding a notification to a rule action. A notification destination can be a user or a network entity, such as a scanner or firewall. If the notification destination is a user, any contact information entered for the user, such as e-mail address, phone, and pager number, is automatically populated from the user's profile. In the notification destination editor, you can also change the user's contact information without changing the user's profile. If the notification destination is a network entity, the notification can be to execute an automated script or command. Each destination can have an associated start and end time, which is the time period during the day when the destination is expected to be active. For example, one notification destination can be for the day shift with a start time of 9:00 a.m. and an end time of 5:00 p.m., and another can be an after-hours shift. Notification Acknowledgements When a notification is sent to a user who is logged into an ArcSight Console or ArcSight Command Center, the user is notified through the notification status button on their display. The notification may just be informational and require no response, or it may require that a user respond within a certain timeframe before escalating the notification to another user or user group. Knowledge Base Your organization may require that certain procedures should be followed for particular incidents, for example, incidents that require Sarbanes-Oxley disclosure. The ESM Knowledge Base is a resource that enables you to post data, such as protocols to be followed, to an internally available web site. An operator or analyst can then associate cases, reports, filters, or individual events with a knowledge base article that informs other users about a standard response, a procedure, or company policy. The ESM Knowledge base is a way to ensure your users have access to the additional information they need in the context they need it. This can also be a regulatory compliance feature. Knowledge base articles are built by importing text or HTML files. For details about how to set up and manage knowledge base articles, see Knowledge Base Authoring in the ArcSight Console Help.
- 52. 6 Workflow 52 ESM 101 Confidential Reference Pages Reference pages are a pointer to an internal or external web page where a user can find more information about the following objects: Resource groups Individual events Vulnerabilities Reference pages are available in the right-click context menu for these objects. If you click the Reference page link and a reference page is not specified for the object, an error message appears. Reference page content can be launched within the Viewer panel using the ArcSight Console's internal web server, or can be launched in an external web browser. References Pages for Resource Groups Resource groups in the Navigator panel can have a reference page URL attached to point users to an internal or external URL. You can add your own reference pages, as needed, to annotate the resource groups in your Navigator panel tree. Reference Pages for Events Many devices generate a device event class ID and template to determine what the event means from the device that produced it, such as Windows NT common event log, or Oracle database. These configurations, if present for the devices installed in your environment, are stored on the Manager, and are accessed by the ArcSight Console when you can right-click an event and launch the browser to look up a vendor's description of that event on the vendor's web page or associated device Help page. Reference Pages for Vulnerabilities The Vulnerability groups that come with ESM standard content provide links to the vendor web sites that publish associated vulnerability data. This helps ensure that users have access to the latest vulnerability data associated with a particular product.
- 53. Confidential ESM 101 53 Chapter 7 Correlation Evaluation Once events have been normalized, prioritized, and their endpoints identified within the network model, they are processed by the correlation engine, where the magic happens. Events that have been tagged with event categories, priority evaluations, and network model information are then processed by the correlation engine, where filters, rules, and data monitors connect the dots, find the events of interest, and can initiate immediate response. Correlation Overview Most activities of interest are often represented by more than one event. Correlation is a process that discovers the relationships between events, infers the significance of those relationships, prioritizes them, then provides a framework for taking actions. The context for correlation is provided by the network model, which is discussed in detail in “Network Model” on page 119. The discovery phase is carried out by rules, correlation data “Correlation Overview” on page 53 “Filters” on page 54 “Rules” on page 56 “Data Monitors” on page 65 “How Correlation Uses Local and Global Variables” on page 68 “Velocity Templates” on page 69 “Event Types” on page 71
- 54. 7 Correlation Evaluation 54 ESM 101 Confidential monitors, and Pattern Discovery. Inference and action are carried out by rules. Priority is determined by the ESM priority formula. Correlation is a four-dimensional process that draws upon the network model, the priority formula, and optionally, Pattern Discovery to discover, infer meaning, prioritize, and act upon events that meet specific conditions. For example, various systems on a network may report the following events: UNIX operating system: multiple failed log-ins IDS: Attempted brute force attack Windows operating systems: multiple failed log-ins A correlation rule puts these data points together and detects five or more failed log-ins in a one-minute period targeting the same source. Based on these facts, this combination of events is considered an attempted brute force attack. The Windows operating system next reports a successful log-in from the same source. The attempted brute force attack followed by a successful login from the same source elevates the risk that the attack may have been successful. To verify whether an attack was successful, you can analyze the volume of traffic going to the Windows target. In this case, a sudden spike in traffic to this target can verify that a brute force attack was successful. ESM's correlation tools use statistical analysis, Boolean logic, and aggregation to find events with particular characteristics you specify. Rules can then take automated action to protect your network. Filters Filters are a set of conditions that focus on particular event attributes. This focus also reduces the number of events that are processed by the system. Filters are applied in many places in the event life cycle by SmartConnectors, the Manager, and the correlation engine. Filters are also used for monitoring, analysis, and reporting.
- 55. 7 Correlation Evaluation Confidential ESM 101 55 Filters applied at the SmartConnector select only events that match the conditions, and it is these events that are forwarded to the Manager for processing. Non-matching events are not forwarded to the Manager. Filters applied at the Manager select which events it will process based on the conditions specified. Events that don't meet the conditions are not evaluated further, but they are preserved in the data store. Construct filter condition statements using ESM's Common Conditions Editor (CCE). If the criteria are met, the evaluation returns true or false. All conditions constructed by the CCE are expressions that consist of a value or variable, an operator (such as not, and, or), and a second value or variable by which the first value is evaluated. ESM filters come in two major forms: Named conditions (Filters resource) Unnamed conditions Named Conditions (Filters Resource) A filter resource is a named object that other resources and SmartConnectors can reference. Filter resources are reusable, and you can transport them among Managers using Packages or the Archive utility. If you need to use the same condition in multiple places, create a filter resource, which you can then refer to in rules, reports, data monitors, and active channels. ESM comes with pre-built filters that support the standard ESM foundations and core content. Unnamed Conditions Unnamed conditions reside within another resource, and are used to specify conditions that are applied locally by that resource only. You can specify unnamed conditions as part of an active channel, rule, or report. These conditions are saved as part of the resource in which they were created, and are not reusable by other resources. Much of ESM's standard content also contains unnamed conditions designed to work in conjunction with ESM's other standard resources. Filters in Active Channels The active channel has several ways that filters and unnamed conditions can be applied: Filter Type Description Filters resource In a number of places, such as the active channel header, you can select a filter resource from a list of existing named filters. The conditions expressed in that filter resource are applied to all events coming into this active channel. Unnamed local filter condition In the Active Channel Editor, you can specify an unnamed condition that is applied only to the current active channel. All events coming into the active channel are evaluated against these conditions, but the conditions are not reusable by any other resource.
- 56. 7 Correlation Evaluation 56 ESM 101 Confidential Filter Debugging The ESM filter debugger validates whether a certain type of event matches a selected filter and, if there are mismatches, identifies which filter conditions are not matched by the event details. The filter debugger is activated as a right-click option on an event in an active channel. For more about filters, look in the ArcSight Console Help under Filtering. Rules A rule is a programmed procedure that evaluates incoming events for specific conditions and patterns, and when a match is found, can initiate actions in response. Rules are the centerpiece of the ESM Correlation Engine, and are what reveals specific meaning out of the steady event stream. Rules are similar to intrusion detection system (IDS) rules, except they operate on an event stream instead of a bit stream. They are constructed with aggregation and Boolean pattern matching to evaluate objects, such as event fields, network models, and active lists. How Rules Work Rules express conditions against which the event stream is evaluated. These conditions can cross-reference: The network model (see “Network Model” on page 119) The asset model (see “Asset Model” on page 136) The Priority Formula (see “Evaluate the Priority Formula” on page 38) Active lists (see “How Rules Use Active Lists” on page 60) Session lists (“How Rules Use Session Lists” on page 63) Rules can be constructed modularly to make use of blocks of other conditions expressed in: Filters Inline filters You can also apply a limited set of conditions to an individual column of an active channel grid. Inline filters are flexible way to filter the current contents of the active channel according to one event attribute column. Inline filters are added to a local filter condition using an AND operator, and are a convenient way to further refine the conditions already set for the channel. Event-based filters in Investigate command When you right-click an event attribute in an active channel view, you can choose Investigate, which leads you to filtering options that vary based on the data involved. Like inline filters, Investigate filters apply only to the current view and are temporary unless saved in a separate view. Rules channel filters Rules channels, used for verifying rule conditions, use filters that automatically filter out any correlation events that are not needed for verification purposes. For more about verifying rules and correlation events, see “Testing Standard Rules in a Rules Channel” on page 63 and “Rules Channels” on page 78. Filter Type Description
- 57. 7 Correlation Evaluation Confidential ESM 101 57 Other rules Correlation data monitors Rules must be activated in order to run on live data. When a rule is under development, you can test it on historical data on a local system before activating it on a live event stream. When activated, rules evaluate each event for the conditions specified. Rules whose conditions have been met generate an ESM event called a correlation event, which is fed back into the event life cycle at the Manager, and is itself evaluated by the Manager and correlation processes. There are three types of rules available in ESM: standard, lightweight, and pre-persistence. Standard Rules Standard rules are triggered when events match one or more set of conditions, for example, events that target a critical asset and are categorized as hostile. If the rule is configured to aggregate (consolidate) multiple events with matching attributes, then the rule is triggered by more than one matching event. For example, if the rule is configured to aggregate three matching events, the rule is triggered when those three matching events occur in the time limit specified. Joins Standard rules can have joins. A join means to connect events from different network nodes in order to understand attributes they may have in common. Join rules recognize patterns that involve more than one type of event. Join rules are triggered by events that match two or more sets of conditions. For example, a join rule can be triggered if there is an event from your intrusion detection system and a corresponding permit event from the firewall, and both target the same asset on the same port from the same attacker. If the join rule is configured for aggregation, the rule is triggered if the specified number of matching events occur within the specified time frame. Because join rules count and track potential matches in working memory, they can also be memory-intensive. Lightweight and Pre-persistence Rules Lightweight and pre-persistence rules were designed for simplicity and performance. Each type has only one event condition (no joins), is triggered on every matching event, has no aggregation, and doesn’t generate correlation events although rule failures are logged. Lightweight rules can only act on active and session lists and are processed earlier in the flow than standard rules. Event-enriching pre-persistence rules are best used for threat level formula analysis. These rules set values for incoming base events before the events themselves are persisted in the database. Pre-persistence rules are processed early in the workflow, however, the values they set are available to standard and lightweight rules, which run during the post- persistence event flow. Pre-persistence rules cannot be scheduled or replayed, since events occurring in the past have already been persisted and can no longer be modified.
- 58. 7 Correlation Evaluation 58 ESM 101 Confidential Rule Aggregation Standard rules can aggregate, or summarize and consolidate, events with matching (or not matching) values over a specified time frame. Aggregation can be performed on the initial event stream at the SmartConnector, as described in “Filter and Aggregate Events” on page 35, and again at the Manager by rules. Aggregation applied at the SmartConnector consolidates numerous repeat events (events with the same essential data, such as firewall events) to reduce the volume of events sent to the Manager without losing crucial event data. The SmartConnector generates a single event whose event type is aggregated event. Aggregation applied by rules also groups together events with similar characteristics, but with the added benefit of being able to send a correlation event when matches occur, and trigger actions, such as sending a notification if the number of matches meets a certain threshold. For example, a user may only want to be notified if there are more than five login failures in one minute. Aggregation matches are counted and tracked in working memory, so rules with aggregation conditions can be memory-intensive, depending on what they evaluate. How Rules are Evaluated The ESM rules engine evaluates events and keeps track of matches and thresholds in a series of phases that optimize accuracy and system performance. The rules engine first looks for matches to specified event conditions. For lightweight and pre-persistence rules, a match on every event immediately triggers the action which the rule is designed to execute. For standard rules, matches are held in working memory. The working memory passes these matches on to the tracker, where they are evaluated against other incoming events for aggregation and join conditions, if present. If the standard rule’s conditions, join conditions, and aggregation conditions are all met within the specified time thresholds, the rules engine will trigger a correlation event. Partial matches in expired thresholds are sent to the garbage collector.
- 59. 7 Correlation Evaluation Confidential ESM 101 59 The rules engine evaluates the event stream, holds matches in working memory, and processes join and aggregation conditions in the tracker. If all conditions are met within the time thresholds, a correlation event is triggered. Rule Actions and Thresholds Rule thresholds tell the rule how many matching occurrences it should consider over what time frame before taking action. Depending on the event type, the situation, and the action you wish the rule to take, your rule can set the action into motion at one of the following thresholds: On the first event On subsequent events On every event (This is the only threshold available for lightweight and pre-persistence rules) On first threshold On subsequent thresholds On every threshold On time unit On time window expiration When the threshold is met, a rule can take action, such as notify other users, execute a script, add an event to an active list, or export the event to a third-party system. For lightweight rules, the action is limited to creating or updating an active or session list. For pre-persistence rules, the action lis limited to setting an event field. When a standard rule’s action is triggered by a threshold, the system generates an action event, which is a type of audit event that is used by ESM to keep track of system status and event processing statistics. All audit events, including action events, are sent back through the correlation engine, where they can be evaluated by other filters, rules, data monitors, and active lists that are looking for specific types of audit events. Audit events can be tracked in active channels, and can be useful to those who need to monitor, administrate, and report on ESM system health and behavior. ESM automatically disables rules that are triggered excessively, or that are triggered by their own correlation events, such as join rules that create a greater number of correlation events than the input events that trigger them. For more about integration commands, see “Integration Commands” on page 87. Correlation Events Triggered by Rules Only Standard Rules generate correlation events. When all rule conditions and thresholds are met, ESM generates an event called a correlation event. A correlation event represents the events that contributed to the rule being triggered and the relevant data contained in them. Correlation events are signified in the active channel with a flash icon ( ). These correlation events are among the items that security operations center staff and analysts want to watch, because they represent rules that have already evaluated the event stream and made the correlations and inferences that operators and analysts would be interested in investigating.
- 60. 7 Correlation Evaluation 60 ESM 101 Confidential Correlation data monitors, discussed in “Correlation Data Monitors” on page 66, also trigger correlation events. When a correlation event is generated, it goes through the event life cycle starting at the Manager (summarized in “Life Cycle of an Event Through ESM” on page 27), as if it were a normalized event received from a SmartConnector. When the correlation event passes through the correlation engine again, it is evaluated by other rules and data monitors that are looking for correlation events with matching attributes. This multi-layered correlation enables you to track complex and varied scenarios, and facilitates accurate and detailed reporting. When a series of events occur that match the conditions set in a rule, the events that contribute to the conditions being met are called correlated events. A series of correlated events contribute to rule conditions being met, then the rule triggers a correlation event. How Rules Use Active Lists Standard and lightweight rules can create and update active lists. Active lists are configurable tables that collect specified fields of event data to enable cross-referencing during correlation. Active lists serve as a community bulletin board for tracking specific event data over long periods (days or weeks) so it can be available on demand for correlation. Active lists populated by rules retain specific information from events so they can be cross- referenced dynamically by other rules and data monitors. Active lists can also be populated manually with static field data, such as a list of user names and badge numbers, or IP addresses and physical building locations (the field data can also be in the form of a comma-separated value list exported from another application). Active lists are a key action tool that rules can write to and read from. Because they can efficiently collect focused event data over longer time periods, such as more than five log- in failures per day from the same source, active lists are much more economical on system resources than a rule trying to accomplish the same goal. The illustration below shows how one rule can find an asset that shows hostile activity and write that asset's address and zone to an active list. Another rule can then read from the active list and take additional action, such as aggregate further activity from that asset over 10 minutes. One rule can find an asset that shows hostile activity and write that asset's ID and activity information to an active list. Another rule can then read from the active list and take additional action, such as aggregate additional activity from that asset. For example, the standard rule Hostile - Attempt (Rules: /ArcSight System/Threat Tracking/Hostile) places assets that show hostile activity on one of the Threat Tracking active list (Active Lists: /ArcSight System/Attackers, Targets, or
- 61. 7 Correlation Evaluation Confidential ESM 101 61 Threat Tracking). The standard rule Attack from Suspicious Source (Rules: /ArcSight Foundation/Intrusion Monitoring/Attack Monitoring/Attackers) then polls the Hostile active list for all the hostile activity from that network node and aggregates other matching occurrences over 10 minutes. How Active Lists Work Active lists can store data over a longer period of time than rules or data monitors. For example, rules can only hold a state that describes the very recent past, normally five minutes to an hour. Data monitors may contain up to a day's worth of data, but without sufficient detail to be of much use to correlation. Active lists, however, can be used to answer questions such as: “has the source IP of the current event attacked one of my systems in the last 30 days?” If it has, you can use the data in that event as conditions in a new rule. Items that get placed on an active list are the result of inference. During correlation, meaning is inferred about an event or group of events based on their context. Active lists should be reserved for non-temporal activity, that is, activity from systems whose state is consistent and not session-based, and not something that may be resolved immediately by an automated process. For example, if a system is compromised, you can add it to a compromise list if its compromised state must be resolved by a person rather than by an automated lock-down script. You can use the active list to collect all the events that occur on the asset while it is compromised, which you can use for tracking and further investigation. The data stored in an active list usually takes the form of data pairs, such as the zone and address of a suspicious source. This data can then be used for correlation, analysis, and reporting. There are two types of active lists: Event based -- Event--based active lists retain specific data from live events, and are populated automatically as the result of a rule action triggered by qualifying events. Event-based lists have an explicit event field tied to every field in the active list. For example, You can configure a rule to look for three failed login attempts in one minute. When the rule is triggered, it generates a correlation event and an takes the action of populating an active list with the event data for the login attempts. Fields based -- Fields-based active lists contain data that is not part of the event data, and are thus populated by the user manually, or by importing a comma- separated value list exported from another application. It is used as a reference table lookup by rules. For example, you could manually populate an active list with the user login names of all the employees in the IT department. Then you can write a rule that looks for special admin logins on critical assets to which only members of the IT department are authorized access. Check for login attempts by employees who are not on the this fields-based active list. An active list can also be both event-based and fields-based. That is, you can populate an active list with field data, then also have a rule write additional entries to the list when certain event conditions are met. Active lists can be read by all resources that express conditions except those used by active channels. This includes the priority formula, filters, rules, data monitors, reports, and Pattern Discovery.
- 62. 7 Correlation Evaluation 62 ESM 101 Confidential Active lists support the following actions from rules and Pattern Discovery: Once an asset has been cleared of the conditions that qualified it for the list, you can remove it from the list manually using the Active List Editor. You can also set a rule or Pattern Discovery action to remove an item from an active list under certain conditions. When an active list is updated, the system generates two audit events: one that records that the active list entry was updated, and another to describe the success of the AddToList operation (success, failure). These internal events can themselves be tracked, so you can report statistics about ongoing attacks, investigate, and monitor ESM system health. Rules and Pattern Discovery can write to active lists; rules, data monitors, reports, and threat evaluation can read from active lists. The example active list below shows several entries recorded in the active list ArcSight System/Threat Tracking/Hostile List. Entries written to an active list can be read by other rules, data monitors, reports, and threat evaluation processes. Every group you add to an active list uses up memory. If you find that you use active lists heavily and the memory you have allocated for a particular active list is insufficient, you can adjust its size limit using the Active List Editor. Heavy active list usage can affect overall system performance. In the course of daily operations, rules and Pattern Discovery may be adding and removing items to and from active lists throughout the day. Each time an item is added or removed, ESM logs these changes in the data store. Function Description Add to active list Adds the event data to the active list. How the information is used by other resources depends on the purpose of the list. Remove from active list Removes the event data from the active list.
- 63. 7 Correlation Evaluation Confidential ESM 101 63 How Rules Use Session Lists Standard and lightweight rules can create and update session lists. Similar to how active lists associate events happening in one area of the network with events happening in another area, session lists associate users with the event traffic they are involved with on the network. Session lists capture and record session-related data in a list, where it can be used by the Correlation Engine to: Resolve event endpoints against DHCP sessions to identify which device was located at the reported IP address at the time of the event Utilize existing maps that link MAC addresses and/or host names to users, if available Attribute actions originating from a specific device to its owner Extract and resolve user information from VPN log-ins, including the VPN user name and session characteristics Track who accesses a given network node at a given time to trace events that originate from this device to users that were logged in at the time Session correlation is a three-step process that involves three or more ESM resources. For more about session lists and how to use them, see the ArcSight Console Help topic Session Correlation. Testing Standard Rules in a Rules Channel Channels for standard rules provide a way to test rules on a fixed time window of historical events outside the real-time flow of events. Initiate Rules channels from the Rules view in the Navigator panel. You can test a single rule or a group of rules; test the rules on the last two hours of events from an existing active channel, or define a new channel using historical events in a specified time window. For more about rules channels, see “Rules Channels” on page 78. Deploying Standard Rules in Real-Time Rules Because standard rules can be costly on memory and system performance, rules you create yourself are not automatically activated on real-time events. Once you are satisfied with the conditions and triggers set in your rule and are ready to deploy it on real events, link the rule to the Real-Time Rules folder. The Real-Time Rules folder applies any rule linked to it to the live event stream. The standard content rules active on installation are already linked to the Real-Time Rules folder.
- 64. 7 Correlation Evaluation 64 ESM 101 Confidential Most of the standard content rules installed with ESM are already deployed in the Real- Time Rules folder. Some standard content rules that are optional or known to be costly on system performance are not deployed by default. For details about these, see the ESM Standard Content Guide. Standard rules, but not lightweight and pre-persistence rules, can be linked, copied, or moved to the Real-Time Rules folder. As soon as you link a rule to the Real-Time Rules folder, it is applied to the live event stream. The rule conditions evaluate the events as they stream in, and when events meet rule conditions and thresholds, the rule triggers a correlation event and any associated actions. Once a standard rule is deployed in the Real-Time Rules folder, you can still edit it. Changes you make are applied immediately to live events when you click Apply or save the rule. State Description Link Link a rule to the real-time rules folder to maintain its “home” location in a group hierarchy that’s part of a larger use case. One copy of the rule is maintained, although the rule can be edited from either location. Changes applied to the rule when linked to the real- time rules folder are immediately in effect on live events. Copy Copy a rule to the real-time rules folder to keep two separate copies of the rule: one for editing and development in the “home” location, and one for application on real-time events. Changes made to the original at the home location are not applied to live events until the changed rule is re-copied or linked to the real-time rules folder. Move Move a rule to the real-time rules folder if you do not wish to maintain a copy of the rule in a “home” location. Once moved to real-time rules, that rule is the only copy, and changes applied to it are immediately in effect on live events.
- 65. 7 Correlation Evaluation Confidential ESM 101 65 Data Monitors Data monitors are how the logic is defined for the graphical summaries that are displayed in dashboards. The data monitors resource is located in the Dashboards area of the navigation tree (dashboards are part of the monitoring phase of the event life cycle, and are discussed in “Dashboards” on page 79). Some data monitors, however, also perform special analysis. Data monitors are similar to rules, in that they evaluate the event stream and system health statistics, and consolidate (aggregate) events with common elements. Rules focus on inferring meaning from certain event conditions in order to specify actions, whereas data monitors focus primarily on summarizing event data graphically, and in the case of correlation data monitors, on providing a different type of analysis, such as calculating statistics and moving averages, and reconciling event streams. Most data monitors are part of the discovery phase of the discover-infer-prioritize-act correlation process. Correlation data monitors can also infer, or draw conclusions, based on the corollary factors present in events with common elements. Unlike rules, however, data monitors cannot specify actions. For this reason, correlation data monitors are used in conjunction with rules. There are three types of data monitors: Event-based data monitors: used to create graphical or tabular summaries of event data for display in dashboards. Correlation data monitors: used to evaluate the event stream and discover anomalies by calculating statistics, reconciling event streams, and calculating moving averages. Like rules, correlation data monitors generate correlation events when their conditions are met. Correlation data monitors are used in conjunction with rules, which can trigger actions when the correlation data monitor conditions are met. Non-event based data monitors: used to monitor and display ESM system status in a graphical or tabular summary. ESM provides a series of standard data monitors designed to work in conjunction with filters, dashboards, and rules to address specific use cases. Event-Based Data Monitors Event-based data monitors evaluate the event stream, apply filters, and render summaries in a graphical format, which can then be displayed in a dashboard. When presented in dashboards, event-based data monitors are used primarily as a monitoring and investigation tool in the discovery phase of the correlation process. If you are previewing the output of a data monitor that has not yet been placed in a dashboard, the system will create a temporary dashboard in which to display the results. You can create permanent dashboards that display the results of one or more data monitors. The same data monitor can be displayed in more than one dashboard, or displayed multiple times in the same dashboard using different display options. When added to a dashboard, the results of the evaluation are then rendered graphically in a format of your choosing: bar chart, 3-D bar chart, bar chart table, pie chart, table, statistics graph, and so on. Data monitors can become costly in terms of memory if the data monitor defines groups of data with many members, which must be updated and evaluated as new events come into
- 66. 7 Correlation Evaluation 66 ESM 101 Confidential the event life cycle. Data monitors can also be CPU-intensive when they make use of many filters or filters that are complex. Correlation Data Monitors Correlation data monitors are also event-based and evaluate the event stream, however, they have the capability to perform special analytic functions that rules cannot. Their purpose is to work analytically in conjunction with rules. Their results can also be displayed graphically in a dashboard. Correlation-based data monitors evaluate the event stream, apply filters or other conditions, and some compare features of two data streams using filters and elements of aggregation. For example, the event and session reconciliation data monitors use two filters that split the data stream so it can be compared and reconciled. Event-based Data Monitor Description Asset Category Count This data monitor enumerates the number of events that occur per asset category, by priority, within a time interval. Event Graph This data monitor draws real-time diagrams of selected event activity. Event graph data monitors can consume a lot of memory and CPU time, because every time fresh event data comes into the channel, the system first calculates, then re-renders the graphic. To ease the burden on memory resources, you can lower the data refresh rate. Geographic Event Graph This data monitor draws a real-time geographic map of selected events. Hierarchy Map The Hierarchy Map Data Monitor draws an image made up of proportionally-sized panels where each panel represents a group of events selected by group fields selected in the source node identifier. A source-node criteria could be a combination of fields. This data monitor includes several enhancements including a more refined view of grouped fields, more drill-downs, and enhanced visualization tools for controlling the map displays. For details about the Hierarchy Map data monitor, see the ArcSight Console User’s Guide. Hourly Counts The Hourly Counts Data Monitor displays the total count of events on an hourly basis along with their priority. Last N Events The Last N Events data monitor displays the latest number of events in a table ordered by whatever parameter you are interested in seeing, such as priority, event name, protocol, and category. Last State This data monitor shows graphics that translate complex values into simple, rapidly observable results such as green / yellow / red “signal lights” or check mark / asterisk / exclamation point symbols. Top Value Counts (Bucketized) Displays top events by selected data field, the total number of events, and the event Severity within the total number of events with the Table and BarChartTable viewer configurations.
- 67. 7 Correlation Evaluation Confidential ESM 101 67 When the correlation data monitor finds events that match the specified conditions, it can trigger a correlation event, as discussed in “Correlation Events Triggered by Rules” on page 59. Non-Event Based Data Monitors Non-event based data monitors evaluate internal statistics associated with ESM resources and their usage. These data monitors are mainly useful to administrators to view the Correlation Data Monitor Description Event Correlation This data monitor provides flow-volume correlation between two different event streams. This helps corroborate attacks reported by different systems. For example, this can be applied to event streams generated by a firewall and an IDS to correlate and verify their output. Event Reconciliation The Event Reconciliation data monitor correlates events arriving from one sensor with events arriving from another sensor. Reconciliation matches every event from stream 1 with one event from stream 2. For example, if you have an IDS in front of a firewall, reconciliation will compare all the allowed traffic from the firewall and compare it with attack events from the IDS. An IDS attack that does not have a matching firewall “allow” event did not get through the firewall. A firewall “allow” event matched with an IDS attack is considered a successful attack. A firewall “allow” event with no matching IDS attack is considered a normal connect. Moving Average The Moving Average data monitor displays the moving average of events by a selected data field. A moving average allows for short term fluctuations to be removed and more correctly shows long term trends. The moving average data monitor can also plot values using various numeric fields in the event. Session Reconciliation The Session Reconciliation data monitor correlates events on the basis of their occurrence within a relevant time period, such as an IP address assigned for a VPN login. The session start and end parameters are values set when the data monitor is created. The session list feature provides a more scalable, flexible, and powerful way to collect session data. For details, see “How Rules Use Session Lists” on page 63. Statistics The Statistics data monitor is similar to the Moving Average data monitor, except that it enables you to select other statistical methods in addition to Moving Average. Statistical methods include average, standard deviation, skew and kurtosis, as well as moving average.
- 68. 7 Correlation Evaluation 68 ESM 101 Confidential instrumentation monitoring ESM. For example, the rules partial match data monitor can help you understand how costly rules and other data monitors are to CPU and memory. How Correlation Uses Local and Global Variables Variable event fields are user-named extensions to ESM's event schema (for more about the event schema, see Chapter 11‚ The Event Schema‚ on page 107). Variables are virtual event fields whose values are the result of a special function performed on another field. ESM enables you to create local variables that apply to the rule, filter, data monitor, query, active channel, or field set you are editing, and global variables that can be referenced by multiple resources. Variables boil down the complexity of the data in a way that enables calculations or functions to be performed. Local and global variables support the following types of functions: Alias Functions Arithmetic Functions Category Model Functions Condition Functions Group Functions IP Address Functions List Functions String Functions Timestamps Type Conversion Functions Value List Functions Non-event based Data Monitor Description System Monitor The System data monitor provides measurements based on Manager internal system Java classes and attributes. ESM's standard system monitors capture several common system monitoring scenarios. Examples include system information, rules engine, and data store transaction volume. The focus is on a particular Mbean Java class. System Monitor Attribute The System Monitor Attributes data monitor is similar to System Monitor, except that, instead of providing measurements for all attributes of a specified Java class, it focuses on a specific attribute of a given ESM Java class. Examples include Free Space Summary, Report Logger, Current Running Reports, Connector State Tracker, and Manager Throughputs. The focus in this data monitor is on a particular attribute of an Mbean Java class. Rules Partial Match Displays rules that have partial matches and the total number of partial match events within a specified time frame. This is useful to see how much memory and CPU is being used by the working memory for evaluating join and aggregation partial matches.
- 69. 7 Correlation Evaluation Confidential ESM 101 69 For example, you can write a rule that is triggered when an after-hours login occurs. To calculate the “after hours” time range, you can define a timestamp variable that extracts the hour of day out of a time stamp, then set the rule trigger on events that occur between x and y time. The time stamp value is made up of multiple data points: dd mmm yyyy hh:mm:ms UTC, as shown below: 21 Jun 2014 17:28:02 PDT You can also use a string function variable to re-arrange the information in a compound data field, such as a uniform resource locator (URI), in a format that is easier to read in reports and other monitoring displays. For example, a location URI may be constructed as USA/CA/Cupertino. Variables enable you to reconstruct the order of these elements, and specify punctuation or spacing in between, so you can display Cupertino CA, USA in your output display. Once created, variables can be selected in the Common Conditions Editor (CCE) as additional fields on the Filters or Conditions tabs, as Group By arguments for data monitors and queries, and in rule conditions and actions. You can add variables to field sets in the Field Set Editor to extend the event and resource schema with values derived from other data fields. For more about variables, see the ArcSight Console Help topics “Variables” and “Global Variables.” Velocity Templates Velocity is a Java-based template engine developed by the Apache Velocity Project (http://velocity.apache.org/). It enables you to use the Velocity Template Language (VTL) scripts to insert a variable in a condition instead of a literal value to populate a string field. Stated briefly, Velocity templates can be applied in most places where a literal string might be enhanced by a conditional or variable string. Common examples are formatting time expressions or condensing fine units into more meaningful groupings. Velocity Application Points ESM provides several places where you can use Velocity template variables as input instead of literal values to make an action more universally applicable to changing conditions. The designated Velocity access points into ESM are described below. Application Point Description Rules Action Parameters You can use Velocity templates in Add Action dialog boxes to create or edit fired-rule behavior. You get to these from the Actions tab or the Rules Editor. The Command and Parameters fields for Execute Command actions are Velocity candidates, as is the message-subject text in the Message field of Send Notification actions. Custom Columns Velocity templates are also applicable in the Cell Format and ToolTip Format panels of the Custom Columns Editor, which are described in the Monitoring Events chapter in the ArcSight Console User’s Guide. SmartConnector Configuration The URI strings in the Default Content tab of the Connector Editor can accept Velocity templates.
- 70. 7 Correlation Evaluation 70 ESM 101 Confidential Examples of Velocity Expressions to Retrieve Values Velocity expressions usually begin with the $ sign followed by the field name in camel case: $<fieldNameInCamelCase> Event field values To get the value from the event field such as Attacker Address, the expression would be $attackerAddress Global variable values The following examples show ways to use a velocity expression on variables, depending on the variable name. If it contains a dot, remove the dot and use camel case. If it contains a space, use an underscore: $<VariableName> $<variable_Name> For example: Rule actions The following rule action example uses velocity expressions to retrieve values from an event field, Attacker Address, and a variable, dhcp.Hostname, and then send out a notification with the specified text in the subject: “Brute force login attempt from IP Address: $attackerAddress Hostname: $dhcpHostname” Case Audit Events ArcSight audit events concerning cases can also be customized with Velocity templates, through properties files. In the case.default.properties or case.properties files (which overrides the former file), found at $ARCSIGHT_HOME/config/audit, you can replace the expression in a key-value pair with a template variable or specify an additional field. Notification Messages In addition to using the Message field of Send Notification actions in the Add Action dialog box, you can also add Velocity templates to the destination-oriented notification configuration files located with the ArcSight Manager at $ARCSIGHT_HOME/config/notification. This text controls message content (in contrast to the subject line). Reports Text Fields You can use a specific set of Velocity references for Report parameters when creating, editing, scheduling or running Reports and Focused Reports. Velocity references for Reports are covered in detail in the ArcSight Console User’s Guide. Variable display name Velocity notation Credit Card Number $Credit_Card_Number dhcp.Hostname $dhcpHostname Login User.Account Number $Login_UserAccount_Number Application Point Description
- 71. 7 Correlation Evaluation Confidential ESM 101 71 For more information and examples on Velocity expressions, see the discussion on Velocity Templates in the Reference section of the ArcSight Console User’s Guide. Event Types Events can be described in different ways depending on when they are generated and how they are processed. The Event Type data field uses specific terms relevant to functions ESM performs. Other terms are useful to know to explain events at different stages. Raw events are events in their native format before being normalized by SmartConnectors. All other event phases occur after nromalization. Internal events are those generated at various stages by the ArcSight Manager. Raw Events Raw events are events in their native format generated directly by network devices and reported to SmartConnectors before normalization occurs. See “Normalize Event Data” on page 30.
- 72. 7 Correlation Evaluation 72 ESM 101 Confidential Event Types in the Event Type Data Field All event types presented in the Event Type data field are normalized events: events that have been processed by a SmartConnector. The Event Type field presents the following four event types: Base: Base events are raw events that arrived in the SmartConnector and were normalized. Normalizing raw events means arranging the data fields in a standardized (normal) order and removing minor differences in formatting so that a given field can be successfully compared to rules regardless of the native formatting at the source. Aggregated: Connector aggregation generates an aggregated event for events with matching values. The aggregated event contains the matching values plus the earliest start time and latest end time and an Aggregation field specifying the number of events aggregated. Aggregation reduces the number of events the Manager has to evaluate. Correlation: The Correlation Engine correlates normalized base events based on conditions expressed in rules and data monitors that match specific attributes. When one or more Base events match a rule, ESM generates a correlation event. The base events that were correlated remain as base events with their original Device Event Class ID. Action: An action event is a type of audit event (defined below) generated when a rule whose conditions have been met triggers an action to be taken, and the action is completed. Other Types of Normalized Events In addition to the event types presented in te Event Type data field, there are also a number of other terms used to identify normalized events at different stages. Normalized Events: Events that have been processed by a SmartConnector to evaluate which fields are relevant and arrange them in a common schema. Correlated Events: Correlated events are a series of normalized events that, together, cause the conditions of a rule or correlation data monitor to be met. Correlated events fulfill the conditions that trigger a rule to generate a correlation event (defined above). Audit Events: The term “audit event” is a common industry term to indicate a record of some action, event, or state that a system generates to monitor itself. Audit events record actions and conditions generated by the ArcSight Manager and the components that communicate with it, such as when an action is triggered by a rule or data monitor, when any resource is created/modified/deleted, or when a SmartConnector is registered with the Manager. When the Manager generates an audit event, it assigns the event an audit event ID in the Device Event Class ID field. Audit events are thensent back through the event lifecycle so they can be evaluated by the correlation engine. For a list of ArcSight Audit Event Device Event Class IDs and what triggers them, see The ArcSight Console User’s Guide topic “Reference Guide,” and look at the “Audit Events” section. ArcSight Status Monitor (ASM) Events: ASM events are events generated by the Manager to monitor system statistics for internal reporting and system troubleshooting.
- 73. 7 Correlation Evaluation Confidential ESM 101 73 Filtering Events To identify the origins and nature of an event, for example when you create event filters, some key data fields to look at are the Vendor, the Product, and the Device Event Class ID fields. The ID field contains an ID code supplied by the device or product vendor that identifies what the event was. For events that ArcSight generates, the Vendor is ArcSight, the Product is ArcSight, and the Device Event Class ID is one of our Audit Event codes. Knowing the vendor and product enables you to sort out events when the vendors use the same codes for different events. For a list of all the data fields, see the ArcSight Console User’s Guide chapter entitled “Reference Guide,” and look at the “Data Fields” section. When viewing a channel you can sort any of the fields with a double-arrow icon . Monitoring ESM’s Audit Events To create an active Channel that monitors ESM's audit events, create a new active channel that only shows events whose Vendor is ArcSight and have it display the Device Event Class ID field. Refer to the ArcSight Console User's Guide for information on how to create an active channel. It is in the chapter entitled “Monitoring Events,” in the section “Monitoring Active Channels,” “Viewing and Using and Using Channels,” “Creating an Active Channel.” Below are some significant event fields that will help in analyzing an audit event to find subject identity, location, date, and time. Type — Shows the event type for this audit event (Base, Correlation, aggregated, Action). Device Event Class ID — Shows the audit event id, such as authentication:100. You cannot sort on this field in an active channel, but you can sort on it in Query Viewers and reports. Category Outcome — Shows the status of an action. For example: Adding to an Active List shows /Successful or /Failure, depending on the result. Target User Name — The Target User Name is the identity of the user. This field is populated only for user-specific actions such as authentication related actions, resource add/update/delete related actions, or scheduled tasks related actions. For example, upon console login, for the authentication:100 audit event, the Target User Name contains the name of the user logging in through the Console. However, when an audit event is generated for a rule action, this field is not populated as it is not directly driven by a User. Attacker Address — This field might contain the IP address of the source, depending on the event. For audit events this is always an ArcSight component, but when it is the Manager these fields are blank. For example: Upon console login, for the authentication:100 audit event, the Attacker Address is the IP address of the Console system from which the user is logging in. When data monitors do a data refresh, the Attacker Address field in the resulting audit event is not populated. Device Event Category, File Name, File Type, File Path — These fields are helpful as they usually contain the information about the resource about which the audit event is generated. Note that the “file” fields can contain resource name, type, and URI, and not just information for files.
- 74. 7 Correlation Evaluation 74 ESM 101 Confidential End-time, Manager Receipt Time — These show the date and time the audit event was generated. Device Vendor, Device Product — Both of these have the value ArcSight, which means they are internally generated.
- 75. Confidential ESM 101 75 Chapter 8 Monitoring and Investigation ESM’s normalization and correlation processes enable Security Operations Centers to have real-time situational awareness as events occur. ESM’s monitoring and investigation tools make it possible to track situations as they develop, and drill down to view the origin of an event, see other systems involved, and understand the effect on other network nodes. You can monitor and investigate events using active channels, dashboards, and query viewers. Active Channels Like a channel tuned to a certain frequency on a television set, an active channel displays a stream of information defined by parameters set in the active channel editor. A channel can be further fine-tuned using in-line filters (described in “Filters in Active Channels” on page 55). “Active Channels” on page 75 “Dashboards” on page 79 “Custom View Dashboards” on page 83 “Query Viewers” on page 84 “Saved Searches and Search Filters” on page 86 “Distributed Searches Among Peers” on page 87 “Integration Commands” on page 87
- 76. 8 Monitoring and Investigation 76 ESM 101 Confidential There are three types of active channels that display different types of data: Live Channels display continuously refreshed live event data Rules Channels display replay events for testing rules Resource Channels display the status of certain resources, such as the assets in your network model and open cases The default view of any active channel is a table grid, but active channels can also be viewed as a chart in a number of formats, as a geographic map, or an event graph. You can elect to view all three on separate monitors in your security operations center. Each line item in the active channel view represents an event. The flash icon ( ) in the first column indicates a correlation event generated by a rule being triggered. Right-click any line item for an array of investigative tools. Double-click any item to view its details in the Inspect/Edit panel. Active Channel Header. The active channel header appears at the top of every active channel view and provides a statistical overview of the channel and the events passing through it. Radar. The radar is a bar chart overview of events in the active channel. By default, they are separated into segments sorted by event end time: each segment of the radar represents groups of events with the same end time. If the grid were sorted by The event count function on Active Channels only reports live events, not replay events. For a count of all events coming through in a particular timeframe, a query viewer or report will provide accurate information. If users want a count of only replay events, the event count in a replay channel will provide an accurate count of all replay events within a specific time window.
- 77. 8 Monitoring and Investigation Confidential ESM 101 77 Target ID, the segments of the radar would represent groups of events with the same target ID. You can also create your own radar, assign a filter, and any match is added to the radar. This feature can be CPU- and memory-intensive, because it creates a channel for every view you create. Each bar in the radar is a channel. For example, if you create 10 views, each one is a channel, and viewing the radar opens 10 channels, each of which are refreshed and re-rendered with every data update. Grid View. The grid view displays each event with a certain set of data fields in a table format. By default, the Viewer panel loads the grid view established for the user group of which you are a member. The view you last set will be the one that loads the next time you log on. Chart View. Chart view displays a summary of events. You can view live events in the following ways: Line graph Scatter plot Area graph Bar chart Stacking bar chart Pie chart Stacking area graph Image Viewer Map. The image viewer plots events geographically on a global or political map of the world. You can also import your own graphic, such as an organization chart. ESM provides a series of standard active channels, which provide out-of-the-box monitoring functionality for common security and network scenarios. For example, by default, the Live active channel displays all events processed in the last two hours in a grid view. Live Channels Live channels display real-time events, which are continuously refreshed whenever events are written to the data store. This means that active channels reflect any changes at its next refresh cycle, such as when new base events arrive from SmartConnectors, or when a user annotates an existing event with investigation or follow-up information. You can define a live channel to display events that match an existing filter over a particular fixed or rolling time frame. You can also define which fields (data columns) of event data you wish to display. You can manually define the fields you wish to view, select a standard field set (specific columns of event data), or define your own field set (see “Field Sets” on page 79). As an Administrator, you can also apply filters for particular user groups, in effect limiting what events other users see. Filters set for the group by the Administrator are implied, and do not appear in the user's view as part of the filter settings in the active channel header. Each event makes up a line item in an active channel grid. You can investigate any line item to view all of its characteristics using tools in the right-click menu.
- 78. 8 Monitoring and Investigation 78 ESM 101 Confidential Rules Channels Rules channels provide a way to test rules on a fixed time window of historical events outside the real-time flow of events. Rules channels are initiated from the Rules view in the Navigator panel. You can test a single rule or a whole group of rules; you can test the rules on the last two hours of events from an existing active channel, or you can define a new channel that uses historical events in a time window you specify. Rules channels do not operate in real-time. It doesn’t matter whether the rules tested on a rules channel are linked to the real-time rules folder, because any triggering events that occur on a rules channel do not register in the real-time event flow. Rules channels are only for testing whether your rule conditions get triggered as expected. If you are satisfied with the conditions and triggers set in your rule and are ready to deploy it on real events, link it to the Real-Time Rules folder (see “Deploying Standard Rules in Real-Time Rules” on page 63). Resource Channels The ArcSight Console also provides the power of channels (such as using inline filters, field sets, sorting, and a dynamic display that is continually refreshed) as a flexible way to view ArcSight resources, such as assets related to managing the network model and case data. Resource Description Asset Channels enable you to view assets interactively so you can monitor updates made to assets as new data is available. For more about working with asset channels, see “Managing Assets in Asset Channels” on page 124, and the online Help topic Managing Assets. For more about assets, see “Assets” on page 121. Vulnerability Channels enable you to view vulnerabilities exposed by assets as those vulnerability profiles change. This makes it possible to sort views different ways, such as by vulnerability type and priority. For more about vulnerabilities, see “Vulnerabilities” on page 137. Asset Category Channels enable you to interactively view all assets designated in the same asset category. For example, you can see and drill down on activity for all assets with a criticality of High. For more about asset categories, see “Asset Categories” on page 140. Scanner Report Channels enable you to view the results of scanner reports in an active channels so you can monitor updates made to the network model as new data is available. Case Channels enable you to interact with data related to cases, such as viewing new cases opened, assigned, updated, and closed. This gives you a flexible way to keep track of the active case load, and easily view recent case activity. For more about cases, see “Cases” on page 47.
- 79. 8 Monitoring and Investigation Confidential ESM 101 79 Field Sets Field sets are a way to limit the columns that are displayed in the active channel grid anywhere event fields can be selected, such as the CCE and variables editors. They are an index of certain field names that you can create and save so that you don't have to sift through more than 400 event fields to get to the ones you are interested in when monitoring and investigating, or building content for a specific use case. You can also create field sets for other places where event fields appear, such as in the resource editors displayed in the Inspect/Edit panel for filters, rules, data monitors, and Pattern Discovery. ESM comes with field sets already defined in the All Field Sets/ArcSight System folder, which you can use as is, or create your own. Sortable Field Sets Sortable field sets are like other field sets, except that they are composed only of fields for which sort indexing has been enabled, such as End Time, Name, Target Address, and Source Address. In active channel grid views, the names of sortable fields in column headers are underlined and the Sort Column right-click command is enabled. Unsortable field headers are not underlined, and the Sort Column feature is disabled. Fields & Global Variables Fields & Global Variables is a tab within the Field Sets Navigator panel that provides access to global variables (see “How Correlation Uses Local and Global Variables” on page 68). Dashboards Like the instrument panel of a car, dashboards display indicators that communicate the state of your enterprise as reported by SmartConnectors from data sources on your network. Dashboards are made up of individual data monitors and/or query viewers in a variety of graphical and tabular formats that summarize the event flow and communicate the effect of event traffic on specific systems on the network, or display the status of ESM components. ESM provides many standard dashboards. You can also create your own. The data monitors and query viewers that make up dashboards are discussed in “Data Monitors” on page 65 and “Query Viewers” on page 84. Dashboards are an ideal way to see event data on your network in a variety of statistical views. They provide many different ways to visualize as well as analyze the event flow. The example below shows the standard Security Activity Statistics dashboard, which displays data from sample network activity. It shows multiple data monitors that, together,
- 80. 8 Monitoring and Investigation 80 ESM 101 Confidential provide a comprehensive status of security activities on a sample network. You can also drill down on elements displayed in a dashboard to investigate their details. The Security Activity Statistics dashboard is just one of the standard dashboards that displays a variety of system status data monitors, which communicate the overall state of your network security. Dashboards can also display query viewers. Event Graph Data Monitors Event graph data monitors summarize multi-node enterprise security data in a graphical format, which makes it easier to visualize attack patterns among nodes on your network. Like the old adage "a picture is worth a thousand words," in enterprise security management, "a picture is worth a thousand log lines." An event graph transforms a multitude of log lines into a meaningful graphic that enables you to quickly visualize what is happening on your network. Using graphs, you can immediately identify patterns that belong and those that do not, and easily pinpoint those you are unsure about. Event graphs render sources, targets, and events using geometric shapes. The shapes and their colors can be configured. You can use event graphs for real-time monitoring, or for historical analysis and investigation.
- 81. 8 Monitoring and Investigation Confidential ESM 101 81 Below are the default event graph components. By default, event graphs render sources in red, targets in white, and events in aqua. Nodes that are both source and target are rendered in dark blue. Blue squares often indicate the progress of a worm, where a target is compromised and then used as an attacker to propagate itself further in your network. Event Graphs as a Monitoring Tool To use an event graph as a real-time monitoring tool, build an event graph data monitor and place it in a dashboard. Use that dashboard as part of your default monitoring view. ESM comes with several real-time event graphs displayed in several standard dashboards. This example shows a close-up of real-time activity on the Live event graph. The Live event graph, such as the one below, shows activity on the entire monitored network. To use event graphs for monitoring, create an event graph data monitor for every business case you wish to track and build them into a dashboard. You will soon learn to read what patterns are normal traffic on your network and which ones you may wish to investigate.
- 82. 8 Monitoring and Investigation 82 ESM 101 Confidential Event Graphs as an Investigation and Analysis Tool You can also use event graphs from an active channel as a tool for investigation and analysis. The four events highlighted in blue in the example grid below are rendered as an event graph that shows a successful backdoor asylum attack on an ISS web server. This graph shows the events that indicate a successful backdoor asylum attack on an ISS web server. In the ArcSight Console, you can double-click any node to investigate its origin. To use event graphs as an investigation and analysis tool, select a series of events from an active channel grid, right-click and select Event Graph. The new event graph will be rendered in a new tab in the Viewer panel. You can create a snapshot of the event graph, which summarizes all the nodes in the graphic in a hierarchical list sorted by type. You can use this hierarchical list to more easily
- 83. 8 Monitoring and Investigation Confidential ESM 101 83 investigate the details of the items displayed in the event graph. To create a snapshot of the event graph, right-click any node and select Event Graph | Snapshot. To generate a Snapshot view from within an event graph, right-click a node and select Event Graph > Snapshot. The snapshot panel on the left displays the details of the event graph items to facilitate investigation. To learn more about event graphs, see the topic “Graphing Attacks” in the ArcSight Console User’s Guide. Custom View Dashboards In ESM you can create custom layouts of dashboard data using a browser-based runtime environment embedded in the Console. Also known as image dashboards, custom view dashboards enable you to create custom views of dashboard data, and can display data monitors and query viewers over an imported image, such as a geographical map. Custom view dashboards cannot display data from the following types of data monitors: Event Graphs Geographic Event Graphs Hierarchy Maps To view dashboards with these types of data monitors, use the regular dashboard view. Custom view dashboards do not support drill-down on events.
- 84. 8 Monitoring and Investigation 84 ESM 101 Confidential Custom view dashboards provide two modes: View mode for monitoring and investigating events, and Arrange mode, for customizing the layout and background elements. Custom view dashboards refresh event data at the same rate as regular dashboards. For more about Custom View dashboards and the system requirements needed to support them, see the ArcSight Console Help topic “Using Custom View Dashboards.” Query Viewers Query viewers enable operators and analysts to get quick, high-level summaries of security-related activity, and to drill down and investigate anomalies or other interesting events without having to create resource-intensive active channels. Query viewers combine the SQL-query capability of trends and reports with the viewing and drill-down capabilities of active channels and data monitors to create flexible, performance-friendly interactive charts and tables. Query viewers also provide customizability and baselining capabilities to give you a long-range overview with access to drill-down details, which enables you to focus on real-time event tracking without risking performance degradation by creating low-level active channels. Data gathered by a query viewer can be added to dashboards, published as reports, and made accessible for viewing in the ArcSight Web client. Query viewers use the same queries as reports, which use events and other resources, such as trends, active lists, session lists, assets, cases, and notifications, as data sources. The diagram below shows a query viewer overview. Query viewers combine the SQL querying ability of trends and reports with the drill-down capabilities of active channels in a single resource. The flexibility of SQL queries with
- 85. 8 Monitoring and Investigation Confidential ESM 101 85 access to drill-down details enables you to track how a situation is developing in real time. Querying the focused data set of a trend table is more performance friendly than creating low-level active channels. Query Viewers as an Investigation and Analysis Tool Use Query Viewers to investigate situations as they are developing. This section uses query viewers when an analyst notices there are a high number of failed user logins. In this example, we created a dashboard with an embedded query viewer. The query viewer shows the top 10 users with failed logins in a bar chart. The bar chart enables you to drill down to data gathered in a second query viewer that shows failed logins for a particular user with the time, attacker, and target information in a table. This example is made up of the following resources: Base query: Top 10 Users with Failed Logins Main query viewer: Top 10 Users with Failed Logins Drilldown query: Failed User Logins Drilldown Drilldown query viewer: Failed User Logins Drilldown Dashboard: Top 10 Users with Failed Logins
- 86. 8 Monitoring and Investigation 86 ESM 101 Confidential The screeh shot below shows the details of a drilldown. For more about query viewers, see the following Console Help topics: Query Viewers Running Queries and Viewing Results Adding Query Viewers to Dashboards Making Query Viewer Results Available to the ArcSight Command Center Adding Query Viewers as Startup Views Generating Reports from Query Viewers Defining and Using Baselines Saved Searches and Search Filters Through the use of a flow-based search language, the search feature enables you to specify multiple search commands in a pipeline format. Use a simple keyword search or use complex queries that include Boolean expressions, keywords, fields, and regular expressions. As you create your query expression, a Search Builder tool provides suggestions through visual representations of conditions you are including in your query. You can view search results in a table or histogram format or view them in various chart formats. Search results are saved as reports in PDF. If you think you will use the same query in the future, save it as a search filter or as a saved search. A search filter has the same query expression but not the same time range specified in the original query. A saved search saves the query and time range you originally specified. Furthermore, you can schedule a saved search to be run on a regular basis. For more details about searches and filters, refer to the ArcSight Command Center User’s Guide’s chapter on “Searching and Analyzing Events.” Once the searches and filters are created on the Command Center, these are made available as resources on the ArcSight Console. In the Console, you can organize them into resource groups and create resource packages. Refer to the ArcSight Console’s User’s Guide’s chapter on “Managing Resources” for more information.
- 87. 8 Monitoring and Investigation Confidential ESM 101 87 Distributed Searches Among Peers Configured peers consist of ArcSight Managers and Loggers. One Manager initiates the peer relationship by generating credentials and sending these to the target peer. The IP address is used as a basis for generating a unique ID and code used exclusively for peer authentication. This method is more secure than a username-password type of authentication. Running search queries are limited to the local system by default. However, with an existing peer configuration, you can extend the search to remote peers. Refer to the Administration section of the ArcSight Command Center User’s Guide for information on how to configure peers and the Searching for Events section on how to run distributed searches. Integration Commands Integration commands are a set of tools that make it possible to invoke scripts and utilities from several places in the ArcSight Console, and to provide snap-in views of other applications, such as ArcSight NSP and third-party applications, within the ArcSight Console. This enables you to use the ArcSight Console as a central command hub for all security-related operations. Once integrated, the commands, tools, and applications can be launched on demand from within the Console, such as from a right-click context menu within an events grid. Integration commands enable you to: Build “ESM context-sensitive” commands that can run locally or on multiple, remote target servers, and can be mixed, matched, and re-used with configurations. Associate parameters with commands to leverage data gathered by ESM in the context in which the commands are called. Command parameters make use of Velocity expressions to pick up values from a wide range of ESM fields and resources. Define configurations (“families of commands”) for various external applications to specify relevant ESM contexts, commands, and, if applicable, remote targets. Here are some example scenarios of how integration commands can be used to integrate other commands and applications to expand ESM’s monitoring and investigation capabilities. TRM Scenarios ArcSight’s Threat Response Manager (TRM) provides a host of investigative and remediation actions in response to compromised conditions on the network. These actions, when combined with ESM’s correlation capabilities, make it possible to safeguard your network in real time with minimal damage if a compromise occurs. Here are a few examples of how ESM paired with TRM can help safeguard the network: Select an IP address in ESM and investigate the associated node using TRM Select an IP address in ESM and quarantine the associated node using TRM Automatically quarantine a node using TRM as the result of an ESM rule action through the use of the ArcSight TRM CounterAct Connector
- 88. 8 Monitoring and Investigation 88 ESM 101 Confidential Third-Party Integration Scenarios Typical activities for which you might want to build and run commands in the ArcSight Console that connect to other applications and tools include: Launch third-party Web interfaces Launch scripts Run external searches View submitted tickets Get Asset/Vulnerability information Get Payload Information Authorization to send commands to the external application is configured through integration parameters added to the user resource. For more about setting permissions for integrated commands, see the Console Help topics “Contexts and Parameters” and “Setting User Login Parameters”. How Integration Commands Work Creating a basic integration requires a command and a configuration, with additional steps required depending on the command you are adding. You can also create multiple configurations to use a command with different parameters in different contexts. The diagram below shows the basic steps for building anintegration command. A basic integration requires a command and a configuration. You can create families of related commands that use different parameters for different contexts by creating additional configurations. A target is required if the service is a web service (web URL), and if the command does not use a TRM connector, or already include the server information.
- 89. 8 Monitoring and Investigation Confidential ESM 101 89 Here is what the resources do: Supported Command Types You can build these types of commands into the ArcSight Console: Resource Description Integration Command The integration command resource is where you specify the syntax of the command itself, and the type of command it is, such as Web URL, executable script, CounterACT for TRM. Integration Target If the command you are integrating is accessed by URL, the integration configuration needs to know the destination of the command (where the command is run). In the case of a publicly hosted web service, such as a Google search, you do not need to set up a separate Target resource, because the URL of the service is all the configuration needs to access the service. A Target resource is only required if there is more than one possible destination for the web service, or values required to access the web service, such as host name or IP address, or login credentials. If you are integrating Logger commands into your setup, you would set up a Target for each Logger instance you are integrating. Also, if your command is available through a TRM (CounterACT) connector, such as TRM commands, the Connector itself is considered a Target. Once the TRM Connector is added to ESM as a Connector, it is made available in the Targets list, and you don’t need to create a separate Target for it. Integration Configuration The configuration resource binds a command with how it will be made available in the ArcSight Console, and any applicable external targets. In the configuration resource, you specify: • The attributes: This specifies general information about the command, including the renderer, which describes how the command results will be displayed depending on the type of command. For example, you can specify whether a URL command invokes a browser internal or external to ESM, or for Connector commands that return XML data, and the XML data can be rendered in plain text or formatted as XML. • The context: The context specifies where in the Console UI the command is made available, for example, in a viewer (for monitoring and investigation), an asset or asset range resource (for running a command, such as a TRM quarantine action, using that asset’s IP address), or an editor (for correlation authoring). • The command: Select among existing commands, or create a new one. • The target: If the service is remotely hosted, select among existing integration targets, or create a new one. Command Type Output Results URL commands provide links to Web page URLs or URIs Browser window
- 90. 8 Monitoring and Investigation 90 ESM 101 Confidential For more information about working with commands, see the topic “Adding and Editing Commands” in the ArcSight Console Help. How to Use Available Commands Commands can be made available in some or all of the following locations in the ArcSight Console. Depending on how a command was added to the ArcSight Console, it can be made available in some or all of the resources and tools shown here. Using Integration Commands During Monitoring and Investigation If the integrated command is so configured, you can invoke an integration command from the right-click menu when investigating an incident from active channels, dashboards, event graphs, query viewer results, active lists, session lists, and trends. Using Integration Commands for Correlation You can add a CounterACT Connector command as a rule action, such as a TRM quarantine node command. This enables ESM to automatically take action when rule conditions are met. Script commands define an executable script Script/executable output result (action the command takes) CounterACT Connector commands are derived from the CounterACT configuration XML CounterACT structured result Command Type Output Results
- 91. 8 Monitoring and Investigation Confidential ESM 101 91 Using Integration Commands that leverage the Network Model Integration commands can leverage data from the ESM Network Model. For example, you can send a TRM command using that asset's IP address. For details about how to run integration commands from any of these contexts, see the “Integration Commands” chapter in the ArcSight Console User’s Guide.
- 92. 8 Monitoring and Investigation 92 ESM 101 Confidential
- 93. Confidential ESM 101 93 Chapter 9 Reporting and Incident Analysis Once events have been processed by the Manager and stored in the CORR-Engine you can perform a number of batch-oriented functions that leverage the ESM event model to analyze incidents, find new patterns, and report on system activity. ESM batch tools work on processed events to produce reports, discover new patterns, and analyze output data using interactive graphics. All these resources are highly configurable and can be run manually, or set to output data at regular intervals, which can be reviewed and analyzed by your security operations staff. Reports Reports are captured views or summaries of data that can be printed or viewed in the ArcSight Console or ArcSight Command Center viewer in a variety of formats. ESM’s modular approach to creating, running, and maintaining reports makes it easier to construct more complex multi-element reports and trends. A report binds one or more queries with a report template. As shown in the diagram on the next page, a query can collect data from trends, session lists, and active lists. In addition to reporting on event data, reports can also summarize data from Cases, Notifications, and Assets. “Reports” on page 93 “ArcSight Pattern Discovery” on page 100
- 94. 9 Reporting and Incident Analysis 94 ESM 101 Confidential Reports can optionally be focused on subdivisions of data (focused reports). Reports and focused reports can be scheduled, and their output saved as archived reports. A report is one or more trends and/or queries bound to a report template. Queries can collect data from trends, active lists and session lists, and summarize data from events, cases, notifications, and assets. Reports can be focused on a subset of query data; reports, focused reports, and delta reports can be scheduled to run automatically. Queries A query is a resource that defines the parameters of data you want to gather from a data source reporting events to ESM. The results of the query then become the basis for one or more report or trend. As a data source, queries can use the ESM CORR-Engine event storage, data stored in an active list, session list, or gathered from a trend. Queries can also summarize internal ESM data from assets, cases, and notifications. In a query, you select the data fields you want to report on, specify any additional functions you want run on them (such as sum, average, and so on), and any sort or group-by conditions you want to add, such as grouping results by source address, zone, or priority. For example, you can group by source country and show event counts per country: 445 from China, 2203 from Spain, and so on. Groups can be sorted and presented hierarchically, so that you can see the event count and the criticality of those events. Then you can configure the report to place a page break between countries.
- 95. 9 Reporting and Incident Analysis Confidential ESM 101 95 One query can be referenced by many reports and trends. This streamlines building use cases around a common scenario. The standard reports that ESM comes with all reference queries. You can leverage any of these standard queries, or build your own. Trends A trend is an ESM resource that defines how and over what time period data will be aggregated and evaluated for prevailing tendencies or currents. A trend executes a specified query on a defined schedule and time duration. A trend is one or more queries run on a schedule. A trend can be used as the primary data source for a report. Or a trend (based on one query) can be used as the data source for another query that further refines the result of the initial query. A collection of trend queries (queries that use trends as their data source) can provide focused views of a data set, which can then be fed into a single report or multiple reports. Trends gather event data over time, which helps identify, for example, the frequency of worm outbreaks, incident time-to-close, or number of cases closed. They can also be used to gather status and operational data about network objects, such as operating systems, asset activity by business role, or regulatory compliance status. ESM provides a set of standard trend reports that show trends on current data, such as trends by operating system, by role, by compliance requirement, time-to-close on cases, and number of cases closed. Depending on the data gathered by the base query, the trend will either be a snapshot trend or an interval trend. Snapshot Trend A snapshot trend uses a query that operates on a fixed moment in time, for example, to gather information about assets on your network. Snapshot trends are built from queries based on assets, cases, or notifications. Snapshot trends answer questions about the status of objects on the network in fixed moments of time. You would use Snapshot trends to determine metrics such as current number of assets, number of systems with a particular operating system, or number of systems with particular vulnerabilities. For example, you would use a snapshot trend to evaluate statistics on vulnerabilities and incident metrics over time to determine whether your vulnerability posture or incident closing rate is getting better or worse. A snapshot trend operates on data in the current moment in time, and only collects data going forward. Thus, a snapshot trend cannot be used to determine how many assets were in a zone 6 weeks ago. You can use snapshot trends to collect data from this point forward,
- 96. 9 Reporting and Incident Analysis 96 ESM 101 Confidential however, and in six weeks from now, you will have six week's worth of data that will tell you how many assets were in this zone at regular intervals over the last six weeks. Interval Trend An interval trend uses a query that operates on events that happen over a specified time window, for example, to gather information about how many events of a particular description occurred daily over a 6-week period. The query upon which an interval trend is based can use other trends, queries, and lists as data sources. Interval trends answer questions about event characteristics over a specific time period. Because the Manager supports the late arrival of events, interval trends can be refreshed manually at any time. How Trends Work A trend references a query, specifies a schedule on which the query automatically runs, and provides mechanisms for efficiently storing, viewing, and leveraging the trend results for reporting. The trend results are stored in a trend table in the CORR-Engine, and are themselves queryable. Creating a trend and using the data in a report is a three-step process: To develop a trend, first create a query that defines the data you are interested in. Next, define the trend time period and other parameters. Finally, you can use the resulting trend data in a report. You can build a report directly from a single trend, or to get more flexible results out of the trend, you can create additional queries that refine the results of the first trend.
- 97. 9 Reporting and Incident Analysis Confidential ESM 101 97 For example, say you wanted to report on daily VPN login statistics. You can create a base query that returns all VPN login attempts, then create a trend that runs this query once per day. To further refine the results between attempts, successes, and failures, you can build additional queries that use the output of your VPN login trend as its data source to differentiate between these three types of log-ins. This scenario is illustrated below. For more about trends and trend-query relationships, see the ArcSight Console Help topic Building Trends. Templates Templates are resources that define the structure in which the data results from your report are presented. The template consists of report design elements, such as headers, footers, title bars, charts, and tables, arranged on a page according to a layout specification. Previous versions of ESM supported only single-element reports that were capable of displaying only one table or one chart. ESM comes with a series of standard report templates that support 1-, 2-, 3-, and 4-element reports, which enable you to display multiple tables and charts from multiple queries, or using the same query displayed different ways.
- 98. 9 Reporting and Incident Analysis 98 ESM 101 Confidential You can also use the template designer interface to develop your own report templates, which you can then bind to queries for professional multi-element reports. The report template designer enables you to create your own custom report templates in addition to the standard 1-, 2-, 3-, and 4-element report templates Reports A report is an ESM resource that binds one or more data sources to a report template and sets output attributes, such as file format, paper size, row limits, and time zone constraints. The reports tab is also where you can apply filters, and set the schedule on which you want the report to run. ESM comes with many reports already developed that address the standard security and administrative use cases included in the standard content (see “Standard Content” on page 162 or the ESM Standard Content Guide for details). Once a report is created, you can run it manually, schedule it to run automatically at regular intervals, or run a delta report to compare the results of one report with another. All report results are displayed in the ArcSight Console report viewer in the Viewer panel. You can also run, archive, and delete reports using the ArcSight Command Center or the ArcSight Web client. Archived Reports After running a report, you can elect to save (archive) the report results. This enables you to retrieve the results of a particular report for immediate viewing without having to
- 99. 9 Reporting and Incident Analysis Confidential ESM 101 99 regenerate the report. Reports that are run on a schedule are saved in the Archives tab so they can be reviewed later, or forwarded to an e-mail list. Archived reports can also be sent to a notification group after the scheduled report is run. Delta Reports A delta report compares the result sets from two different queries run from the same report definition using different parameters, such as today's date and yesterday's date. This is useful to compare results from one time period with another, or one business division with another. The differences may be presented in a file or as a series of events. Each row represents one event that differed between the two queries. Delta reports have limited presentation features. For details about the features available for delta reports, see the ArcSight Console Help topic Running a Delta Report. Focused Reports Focused reports are a type of report that consist of a master report definition and parameters that focus on a subset of the data captured by the master report. This enables you to generate a separate report for each subdivision of data, such as individual zones, based on a single overall query without having to copy and modify the master report every time. For example, if you need to report total event count for systems with different business roles, you can create a master report definition called Total Event Count per Business Role and add a parameter that points to the Business Role asset category group and an inGroup condition that points to it. Adding the parameter and the inGroup condition make the report "focusable." If you ran the focused report without narrowing the parameters further, it would return the total event count for all the systems categorized in any Business Role asset category. If you create a focused report that further specifies systems categorized in a particular Business Role asset category, such as Operations, the result would be the total event count for all Operations systems. You can create another focused report for another business role, such as Revenue Generating systems. You can save each variation as its own Focused Report, which can be run automatically on a regular schedule like any report. Any updates made to the master report are automatically reflected in the focused report. Job Scheduler The job scheduler is a utility that manages the timetables upon which items that can be scheduled are run. The job scheduler setup menu is available from the editors of the following resources: Reports Trends Focused reports Rules Pattern Discovery snapshots
- 100. 9 Reporting and Incident Analysis 100 ESM 101 Confidential You can schedule a report to be run automatically on a yearly, monthly, weekly, daily, or hourly basis. The results of reports run on a schedule are stored in the Archives tab under the name of the user who scheduled the report. The report scheduler is located in the Jobs tab of the Reports resource editor. Scheduled Jobs Manager The Scheduled Jobs Manager is a utility that makes it possible to coordinate all jobs on a staggered schedule. For example, if all reports are scheduled to run at 1:00 a.m., system resources may become overburdened at that time. The Scheduled Jobs Manager is available from the System menu and the Scheduled Jobs Manager button ( ) in the System toolbar at the top of the ArcSight Console. The Scheduled Jobs Manager shows all the jobs currently scheduled to be run and their status for ESM resources and system events. Jobs generated by an ESM resource can be edited by selecting Edit Job from the right-click context menu. Jobs generated by ESM system events cannot be edited. The Scheduled Jobs manager enables all the scheduled processes to be managed from a single view to avoid potential system performance problems by too many scheduled events running at once. ArcSight Pattern Discovery ArcSight Pattern Discovery is a separately licensed module you can activate in ESM that applies data-mining techniques to event flows in order to detect patterns of behavior that may indicate previously unknown threats. Rules and data monitors enable you to detect patterns or specific threats you know could happen. Pattern Discovery automatically identifies patterns that occur in the event flow that you don't know about or suspect.
- 101. 9 Reporting and Incident Analysis Confidential ESM 101 101 This makes Pattern Discovery a vital tool for preventive maintenance and early detection in your ongoing security management operations. This also makes Pattern Discovery a valuable tool for identifying normal patterns of activity on your network. Using periodic, scheduled analysis, you can always be scanning for new patterns over varying time intervals to stay ahead of new exploit behavior. Once the system discovers a pattern, you can take action on it, such as adding a system to an active list, opening a case, or notifying another user. Or you can discard the pattern if you determine that no threat is evident. As part of set up and tuning, you can use Pattern Discovery to profile patterns of normal activity on established networks or newly protected networks, such as new customer groups, or new divisions for large corporations. Once these normal patterns are identified, you can mask them out, so the system can then concentrate on finding patterns that are not normal. Pattern Discovery operates on the same events that the correlation tools do. But while correlation runs continuously, Pattern Discovery analyzes blocks of time (hour, day, week, month, and so on) when searching for patterns, so it is run on demand or on a regular schedule. Depending on the volume of events going through your system, Pattern Discovery can be run once a day or every few hours to provide complete coverage of all system traffic. Pattern Discovery Output: Snapshots and Patterns The output of a Pattern Discovery "run" is a set of patterns. A pattern is a collection of events (messages from firewalls, IDSes, hosts, and so on) that establish relationships between sources and targets of activities. For example, the system may find multiple instances of unique hosts performing the same three attacks against unique targets, or repeated failed attempts followed by a successful one.
- 102. 9 Reporting and Incident Analysis 102 ESM 101 Confidential As shown below, Pattern Discovery shows commonalities among events according to the number of common elements and the frequency with which they occur together. Many different types of security threats generate unique "fingerprints" that Pattern Discovery will capture. Patterns that represent normal network behavior may reveal characteristics you were unaware of, which can inform your business practices and policies. For more about Pattern Discovery, see the “Pattern Discovery” topic in in the ArcSight Console User’s Guide or Help.
- 103. Confidential ESM 101 103 Chapter 10 CORR-Engine ESM organizes events by date and stores them in the CORR-Engine (Correlation Optimized Retention and Retrieval Engine) for rapid evaluation by the ESM correlation engine and for archiving. Events are stored in the CORR-Engine’s event retention period, where correlation operations take place, then copied daily into archives for long-term storage. The CORR-Engine consists of event storage and archiving, and system storage. “CORR-Engine Event Storage” on page 104 “System Storage” on page 105 “CORR-Engine Management” on page 105
- 104. 10 CORR-Engine 104 ESM 101 Confidential CORR-Engine Event Storage The events portion of the CORR-Engine storage management system consists of two major parts: the active retention period and the archives. The Correlation Optimization Retention and Retrieval (CORR) Engine organizes events by date. Events flow into the active retention period, and once a day, events are copied into the archives. The CORR-Engine operates on events available in the active retention period (active “jobs”), and any offline archives that have been activated. Active Retention Period The retention period is the policy you set for how long to retain events in active memory for correlation, for example, 30, 60, or 90 days. The CORR-Engine (filters, rules, queries, query viewers, active channels, and data monitors) evaluates the event data stored in this area (Active “Jobs”). As events flow into ESM, they receive a time stamp at Manager Receipt Time (MRT). All events time stamped for a particular day (12:00:00 a.m. to 11:59:59 p.m.) are grouped together. Either manually or at a set time (12:00:00 by default), the previous days’ events can be copied into an archive (see “Archives” on page 105).
- 105. 10 CORR-Engine Confidential ESM 101 105 When a days’ worth of events reaches the end of the retention period, they drop off of the retention period’s memory, although their corresponding archive copy is retained indefinitely in the archives. Copying a group of events into the active “jobs” archive is a configurable option. If you opt not to save a group of events in the active “jobs” archive, those events are deleted from the system entirely when they time out of the retention period. Archives The archives are a block of storage within the CORR-Engine for saving copies of events. As long as a days’ worth of events are active in the retention period, their corresponding archive copy is in an active state, which just means that the original events are still in the retention period’s memory. Correlation happens on the original events in the retention period, not the active archive copy. When the original events time out of the active retention period and drop out of active memory, the corresponding archive copy goes into an archived state, which just means that the original events are no longer in the active memory portion of the CORR-Engine. At any time, you can reactivate the events in an offline archive, which will make the events available to the Correlation Engine for evaluation. Events in an activated archive remain stored in the archive portion of the CORR-Engine, and do not transfer back to the active retention period. Note that only actual events are stored in the archives. For example, if a single event is aggregated multiple times during correlation, the event count as seen in an active channel, query viewer, or report will match the number of aggregated events. In storage, that single event will be stored only once and therefore counted only once. Time- and Space-Based Storage Retention The CORR-Engine’s event storage operates on two types of retention: time based and space based. Time based retention: a job runs daily to remove aging events (older than retention period) Space based retention: when the main storage is about to run out of space, space based retention will be triggered. It removes the first day (or first few days) of events to free up enough space to meet the space requirement. System Storage The CORR-Engine also has a system storage area, which stores all of ESM’s resources, both ArcSight standard content, and customer-created content. CORR-Engine Management All the CORR-Engine storage areas are managed by the ArcSight Command Center, ESM’s browser-based interface. The system tracks storage usage on the appliance, and can be configured to provide notifications to specified users at certain disk space usage thresholds for both event storage and system storage. For more about the ArcSight Command Center and how to use it to manage the CORR- Engine, see the ArcSight Command Center User’s Guide.
- 106. 10 CORR-Engine 106 ESM 101 Confidential ArcSight Administration content package includes the CORR-Engine system monitoring resources. For information about standard System or Administration content, refer to the Standard Content Guide — ArcSight System and ArcSight Administration. For information about an optional ArcSight Foundation, refer to the Standard Content Guide for that Foundation. ESM documentation is available on Protect 724 at (https://protect724.arcsight.com).
- 107. Confidential ESM 101 107 Chapter 11 The Event Schema The ESM event schema is the culmination of the normalization process, and the backbone of the data structure that drives ESM correlation. The data collected from devices in your network is parsed into ESM's normalized schema. The 400+ data fields in the schema are divided into groups. This chapter introduces the groups the event schema is divided into, and defines how the ESM event schema uses certain terms to describe the assets on your network. The data fields of the ESM event schema are divided into 17 groups that describe a set of data collected and normalized from the devices on your network. Event Data Fields When ESM normalizes and processes an event, its values and attributes are parsed and stored into the corresponding data fields in the ESM event schema. The ESM event schema is a collection of more than 400 data fields that contain the normalized form of the data originally recorded by the device (sensor) that reports events to the ArcSight SmartConnector. These 400+ fields are divided into 17 groups that describe the data fields in subsets. “Event Data Fields” on page 107 “Devices and Assets in the Event Schema” on page 111 “Devices and Connectors in a Network” on page 113
- 108. 11 The Event Schema 108 ESM 101 Confidential Event Field Groups The table below describes the type of data contained in each group. These groups also appear in many ArcSight Console right-click menus and resource editors. For a complete list of every data field and the type of data each field uses, go to the Reference Guide in the ArcSight Console Help and click Data Fields. Event Schema Group Icon Description Event (root) The fields in the Event group contain general information about the event that ESM uses to identify and track it. The event ID is an internal routing identifier that can be used to trace an event through a multi-tiered environment. The Manager Receipt Time logs when the Manager received the event. Category Category is a general description of the event as defined by the ESM event categories applied to it by the SmartConnector that received it. Categories are Object, Behavior, Outcome, Technique, Device Group, and Significance, as described in “Apply Event Categories” on page 32. Threat Threat describes ESM's assessment of how important it is that you respond to this event. This assessment is described in the values assigned to the event using the priority formula. The priority formula is described “Evaluate the Priority Formula” on page 38. Agent Agent describes the SmartConnector that reported this event to the Manager. In a multi-Manager architecture, Agent is the SmartConnector that sends the event to the Manager. In this case, the agent may be the last in a long line of SmartConnectors that have forwarded the event up in a multi-Manager hierarchy. The other fields involved in a device chain are Device, Final device, Agent, and Original agent. Device Device describes characteristics of the real-world sensor that reports the event to a SmartConnector. For example, if one network asset hosts a Syslog, a HIDS, and a card-reader system, the fields in this group describe which sensor on that host generated the event. These fields also include values ascribed to that event by the original sensor, such as device severity (see “Event Severity” on page 31), which indicates the sensor's assessment of the event's threat level. In an environment that uses concentrators or analysis engines, these fields describe the first device in the device chain to process the event. The last device in the chain is called the Final device. Source Source describes the asset that was the origin of the network traffic represented by the event. In an event that represents an interaction between two network assets, Source is paired with Destination, and together, these fields describe the sender and receiver of the network traffic. In the case of an event that involves only one asset (such as a periodic system health check), the Source fields will be empty.
- 109. 11 The Event Schema Confidential ESM 101 109 Destination Destination describes the asset that was the receiver of the network traffic. In an event that represents an interaction between two network assets, Destination is paired with Source, and together, these fields describe the sender and receiver of the network traffic. In the case of an event that involves only one asset (such as a periodic system health check), the Destination fields describe that asset. Attacker Attacker describes the asset that initiated the action represented by the event. In the case of an event that represents an interaction between two assets, the Attacker is paired with a Target, which is the intended focal point of the network traffic. In most cases, Attacker is associated with the Source. However, in the case of an attack by something like a Trojan where the system is caused to divulge information that it shouldn't to an outside source, a sensor, such as an IDS, might intercept a response which indicates that the Destination has attacked the Source. In the case of an event that involves only one asset (such as a periodic system health check), the Attacker fields will be empty. Target Target describes the asset that is the intended focal point of the action represented by the event. In the case of an event that represents an interaction between two assets, the Target is paired with an Attacker, which is the network entity that initiated the attack or suspicious behavior. In the case of an event that involves only one asset (such as a periodic system health check), the Target fields describe the network node where the action took place. File File refers to the current state of an operating system file or an ESM resource that has been modified. This field can be monitored by anyone looking for changes to an ESM resource file, and can be populated if you have configuration monitoring software, such as Tripwire. Old File Old File refers to the previous state of an operating system file or ESM resource that has been modified. This field can be monitored by anyone looking for changes to an ESM resource file, and can be populated if you have configuration monitoring software, such as Tripwire. Request Request describes the attributes of a request for some action to take place (such as an HTTP GET or a database query). Original agent In a multiple-Manager environment, Original Agent describes the SmartConnector that originally received the event from an asset in its local region. This is the first SmartConnector to process the event in a line of SmartConnectors that forward the event up a multi- Manager hierarchy. Event Schema Group Icon Description
- 110. 11 The Event Schema 110 ESM 101 Confidential Final device Final device describes the last device to process this event before it is transmitted to a SmartConnector. Final device comes into play only in an environment where a device chain is created by a concentrator or analysis engine. Event data may be moved through several concentrators or analysis engines before it reaches the "final" device described by these fields. In this case, the Device group describes the first sensor to process the event, the Final Device group describes the last sensor to process it before transmitting it to the SmartConnector, and the concentrators and/or analysis engines in between are not described in the Event Schema. If the event originated in the Final Device, then the groups Device and Final Device contain the same information. Event annotation Event Annotation contains any user workflow assignments that ESM users have added to an event after it was received and stored at the Manager. An event can be marked as similar, so that the system identifies events with similar characteristics when they come into the system, but the data that makes them similar is not stored in this field in the event schema. The event annotation data fields are the only place in the event schema that you can edit directly. Changes you make to these fields are persisted to the data store. Note: If the Manager has to annotate events at a very high events- per-second (EPS) rate, it may not be able to perform all annotations. In this case, the server.log file would contain messages about annotations that were missed. If you run into this issue, review the sources of excessive annotions. Consider looking at rules that fire with too many correlated events. You may also have a forwarding connector that is marking too many events as forwarded. Annotations are asynchronously added in a batched manner, therefore the persistence of annotation is delayed but would occur eventually. Device Custom All the other schema fields represent attributes that are common across different types of devices. The Device Custom fields are reserved for attributes specific to the device that generated the event that the rest of the event schema does not already capture. These fields are defined by ArcSight or by a SmartConnector author who develops custom SmartConnectors to customer specifications. End-users should not modify these fields. Each Device Custom field contains a label-and-value pair. If you use any Device Custom attributes in correlation filters, rules, or data monitors, always specify both the label and value. Flex In the event that the ESM schema does not capture all the data you wish to monitor from your network device and you do not have a customized SmartConnector, you can configure the Flex fields in the SmartConnector schema to report these extra data points. For example, you may want to extend a FlexConnector to capture more information, or populate these fields in correlation events when rules are triggered. These fields are configurable by you during SmartConnector setup. If Flex data is specified, each field contains a label-and-value pair. If you use any Flex attributes in correlation filters, rules, or data monitors, always specify both the label and value. Event Schema Group Icon Description
- 111. 11 The Event Schema Confidential ESM 101 111 Devices and Assets in the Event Schema This section describes the terms ESM uses to identify the items on your network that become endpoints in events. This section uses the following definitions to describe endpoints on your network: Network Node. A network node is a physical processing location with a unique network address and the capability to recognize and process, or forward, transmissions to other nodes. A network node has a unique identifier, such as an IP address, MAC address, host name, fully qualified domain name, or external ID. The node may have several of these identifiers, but at least one is constant, and is a value by which the node can be consistently identified. Endpoint. An endpoint is a reference to, or description of, a network node. That reference is composed of an IP address, a fully qualified host name, and a MAC address, all of which describe a particular network node. Sensor. A sensor is the component of a device that actually detects the activity represented by an event. A sensor is either software or hardware that produces a stream of event data or, in the case of a scanner, a stream of network node descriptions. One network node may contain many sensors. Devices in the Event Schema As defined by the ESM event schema, a device is a network node with a sensor that reports directly to an ArcSight SmartConnector. A device can be an individual sensor or software that collects, then reports events from other devices. For a complete list of products ESM supports, log in to the Protect 724 site: https://protect724.arcsight.com. Click the product documentation link, select ArcSight SmartConnector Documentation, and select Index to SmartConnector Configuration Guides. The guides on this index maps to the products supported by SmartConnectors. A sensor can have peripheral components, such as a badge card reader that detects events and forwards them to a concentrator on the network. To the event schema, this is a device chain, where the sensor at the door is the device and the device that reports to
- 112. 11 The Event Schema 112 ESM 101 Confidential the SmartConnector is the final device (see “Device Chain: Final Device and Original Agent” on page 117. A sensor is the component of a device that actually detects the activity. Devices can report to a SmartConnector through a chain of multiple devices. Assets in the Event Schema In ESM, an asset is a description of a network node. The network model will contain many assets that describe valuable nodes within the protected network and important nodes outside the protected network. These descriptions are used during event processing to bring business-relevant data about the asset into the correlation process. For more about the ESM network model, see “Network Model” on page 119. The following example shows three applications hosted on a single piece of hardware. Each of these applications may be used as a device (a source of event data that reports directly to an ArcSight SmartConnector). The network node used by devices that provide event data to a SmartConnector may also be described using an asset in the network model. A reference to the asset appears in t Device fields of all events reported by that device. Asset is the term ESM uses to describe a network node with a unique identifier (IP or MAC address, host name, zone, or external ID) in the ESM network model. This example shows one asset that hosts two devices and a series of applications. Details about the asset will
- 113. 11 The Event Schema Confidential ESM 101 113 appear in the Device fields of the events reported by the BEA application server and the Cisco HIDS. Alternate Interface in the Event Schema An asset describes a network node, but a single physical enclosure (such as a server) may represent multiple assets if that enclosure has multiple network interface cards (NICs). For example, a single server with multiple network interfaces, such as a web server with an outside connection IP and internal connection IP, would be represented by two assets. Each asset would refer to the other as an alternate interface. This enables ESM to model the differences between the two network nodes, such as different open ports. Devices and Connectors in a Network In a typical network environment, several types of devices, such as firewalls, intrusion detection systems, databases, and Syslogs, report directly to an ArcSight SmartConnector, or in the case of a concentrator, to another device. In the example below, the database, Syslog, a host-based intrusion detection system, firewall, and network-based intrusion detection system all report directly to SmartConnectors. The example below represents the relationship of devices and SmartConnectors, and is not intended as a deployment suggestion. In a deployment scenario, SmartConnectors would likely reside on a central SmartConnector server, or may be deployed locally on the system that hosts the device, depending on the device.
- 114. 11 The Event Schema 114 ESM 101 Confidential Devices are the actual sensors that detect the event. Devices report directly to SmartConnectors. Source/Destination, Attacker/Target: An External Attack Every event that describes a network transaction will have a source and destination. The values in the source and destination fields characterize the flow of traffic on your network. That source and destination may become an attacker and target if a network analyzer, such as a HIDS or NIDS, evaluates the traffic as hostile. In most cases, network traffic originates from a source/attacker and the destination/target is one of your network assets. In the
- 115. 11 The Event Schema Confidential ESM 101 115 example below, the external attack is targeting the web server, and the event is reported by the host-based IDS. The source of an event that involves two network assets can also be an attacker if a network analyzer interprets the event as hostile. In a typical external attack, the destination (or target, if applicable) is one of the assets on your network. The attack represented here was detected and reported to ESM by a host-based IDS system. Source/Destination, Attacker/Target: A Trojan Attack When an attack is launched from inside, such as when spyware or Trojans attempt to send unauthorized information to a server outside your network, the source of the attack is inside your own network and the destination is outside. The attacker, however, is considered to be the outside entity to which the source is transmitting its data, and the
- 116. 11 The Event Schema 116 ESM 101 Confidential target is inside your network. The example below shows a Trojan initiating contact to an outside server, which is detected by the network IDS. In a Trojan attack, the source is one of your own network assets, but the attacker is considered to be the outside entity that installed the Trojan software. Destination/Target Only: A SysLog Reboot Report There are some events that only involve a single endpoint, such as a system reboot reported by a syslog. This type of event is called a point event. In this case, there is no source or attacker, only a destination and target. Routine network activity involving only one network asset, such as a SysLog reporting a system reboot, have only a destination and target and no source and attacker. Usually when a SysLog reports a system reboot, it is a routine operation that does not warrant a second glance. However, if a system with certain attributes is rebooted, for example outside of an admin-authorized time window on a Windows asset, it may indicate
- 117. 11 The Event Schema Confidential ESM 101 117 an unauthorized software install or other unauthorized activity, which may need investigation. Device Chain: Final Device and Original Agent An event may pass through several devices before arriving at a SmartConnector. Once processed by a SmartConnector, the event may pass through several other connectors before coming to rest on the Manager where you view the event. For example, in an environment where you have a concentrator that gathers events from multiple devices before reporting them to a SmartConnector, the concentrator becomes the final device to handle the event before it is sent to the SmartConnector. In an environment that uses multiple Managers, the SmartConnector that reports to the regional Manager is the original agent, and the forwarding SmartConnector is the agent. A final device is the last device to handle an event before it is sent to a SmartConnector. An original agent reports an event to a regional Manager before it is forwarded by a forwarding SmartConnector to a global Manager.
- 118. 11 The Event Schema 118 ESM 101 Confidential
- 119. Confidential ESM 101 119 Chapter 12 The Network Model ESM operates on a data model that enables you to build business-oriented views of data derived from physical information systems. Network modeling is done to keep track of the devices on your network involved in the traffic you’re monitoring. These distinctions help ESM clearly identify the events in your network, and provide more layers of detail to ESM's correlation capabilities. Modeling the network is part of ESM set up and ongoing maintenance. The ESM network model consists of the asset model and the network model, which, combined, facilitate building detailed correlation criteria. All of the Network Modeling resources, except Customers, are available as part of the Assets resource. Network Model The network model is a representation of the nodes on your network and certain characteristics of the network itself. Before you can make an informed decision about what to do about an event, it helps to know the event's source and destination. Is the source a previous attacker, does it come from a hostile region of the world, or is it a trusted server that has suddenly become the source of a hostile attack? Does the destination expose relevant vulnerabilities, does it host critical applications, or is it a known server of forbidden services? “Network Model” on page 119 “Asset Model” on page 136
- 120. 12 The Network Model 120 ESM 101 Confidential ESM captures this information by modeling the assets on your network and particular attributes of the network itself that are pertinent to evaluating events. The network model represents information for individual assets and whole zones. For critical assets on the protected network, network modeling captures important facts that will help inform your decisions, such as: All open ports The operating system running on that host Known vulnerabilities that might be exposed Applications present The missions these applications support and their criticality to your operation For less critical assets, such as a particular block of addresses on the Internet, it may be sufficient to just know general information about them, such as the country in which those assets reside. The ESM Network Model consists of the following resources. “Assets” on page 121 represent individual nodes on the network, such as servers, routers, and laptops. “Asset Ranges” on page 124 represent a set of network nodes addressable as a contiguous block of IP addresses. “Zones” on page 125 represent portions of the network itself that are characterized by a contiguous block of addresses. “Networks” on page 127 are a way to differentiate two private address spaces. “Customers” on page 128 describe the internal or external cost centers or separate business units associated with networks, if applicable to your business environment. These objects are described in detail in the following pages using the simplified network pictured below as an illustration. This sample has four major locations: New York, San Francisco, Hong Kong, and Headquarters. Each location has a web server, an e-mail server,
- 121. 12 The Network Model Confidential ESM 101 121 and a range of desktop PCs. The following illustration shows the detail of the New York region network. The portion of the example enterprise shown above contains web servers in a DMZ, e-mail and file-and-print servers, and a range of desktop PCs that sit behind a firewall. All traffic is directed by a Cisco router. Assets The asset resource identifies any network endpoint with an IP address, MAC address, host name, or external ID (for more about how assets are used in the event schema, see “Assets in the Event Schema” on page 112). For network modeling purposes, an asset is any endpoint you consider significant enough to characterize with details that will make correlation and reporting more meaningful. The Asset resource is where you specify the network identity of the asset itself: Asset name (a name used to refer to the asset within ESM) Network IP address MAC address Fully qualified host name External ID (optional). The external ID may be used to synchronize the asset within ESM with any external model that is already in use, such as an incident or asset- tracking system. If you do not need to synchronize with an external system, you can disregard this attribute. If you are populating the network model from a vulnerability scan or other third-party data file, these fields will be populated automatically based on the imported data. For more about how ESM populates the network model from vulnerability scans, see “How Vulnerability Scans Populate and Update the Network Model” on page 137.
- 122. 12 The Network Model 122 ESM 101 Confidential Every network-visible interface is considered a separate asset, unless it is part of a specified asset range (see “Asset Ranges” on page 124). Examples of network-visible interfaces include bridges, routers, web servers, or anything with an IP or MAC address. You may choose to only model assets that have relevance to correlation and reporting, not all the network interfaces on your network. The diagram below shows assets and asset ranges in the example network. The asset resource identifies the attributes of the systems on your network. Every network interface is considered a separate asset, even if they reside on the same physical hardware, unless you specify it as part of an asset range. One piece of hardware, such as a router or a web server, with an internal interface and an external one can have multiple active network interfaces. Multiple IP addresses on a single piece of hardware are modeled in the Assets tab as alternate interfaces. Alternate interfaces are described in “Alternate Interface in the Event Schema” on page 113. You can organize Assets in Asset Groups, a logical grouping of one or more Asset resources. Asset Groups are hierarchical, which means that properties assigned to an Asset Group apply to all the assets associated with that group. Auto-Created Assets ESM automatically creates assets for ESM components and, if applicable, for assets arriving from scan reports sent by vulnerability scanners via scanner SmartConnectors. You can also configure ESM to create assets for devices reporting through SmartConnectors. For more about ESM asset auto-creation This section provides a highlight of the ESM asset auto-creation feature. For details about how the ESM auto-creation feature works and how to configure it, see the topic “Auto-Created Assets” in the ArcSight Console User’s Guide.
- 123. 12 The Network Model Confidential ESM 101 123 Auto-Created Assets for ESM Components ESM automatically creates assets to model the network nodes that host ESM components. These assets do not contain vulnerability information, and are used for system administration. Devices Discovered by a Vulnerability Scanner ESM also imports asset and vulnerability information from vulnerability scanner reports generated by products such as Nessus, FoundStone, and ISS Internet Scanner. Asset information is passed to the Manager via the scanner SmartConnector appropriate for your vulnerability scanner product based on IP address, MAC address, and host name. Updated vulnerability information is added to existing assets with matching identifiers. If a matching asset does not already exist, ESM creates one. ESM creates assets from vulnerability scan reports differently for dynamic and static zones. For more about dynamic and static zones, see “Dynamic and Static Zones” on page 126. Devices Reporting Through SmartConnectors The ESM Administrator can configure the system to also create an asset for each device that reports to that SmartConnector based on IP address, MAC address, and host name when the Manager receives events from SmartConnectors. This feature makes it possible to add assets to the network model that may not be part of a regular asset scanning report without having to create them individually. Assets created using this method do not contain vulnerability information, although once they are added to the network model, they can be supplemented with matching data that arrives from a scanner report or that you add individually using the ArcSight Console. Component Manager An asset for the Manager is added (if needed) every time the Manager service starts. CORR-Engine An asset for the CORR-Engine is added every time the Manager starts. ArcSight Consoles An asset is added for each ArcSight Console the first time it connects with the Manager. SmartConnectors An asset is created for SmartConnectors only when the SmartConnector begins reporting base events from the device it represents. A Connector can be successfully added to the Manager, but until it starts reporting events from the device it represents, an asset will not be created for it in the Asset Model. ESM creates assets differently for SmartConnectors in static zones and those in dynamic zones. For more about static and dynamic zones, see “Dynamic and Static Zones” on page 126. For details about how ESM creates assets for SmartConnectors, see the topic “Creating Assets for SmartConnectors” in the ArcSight Console User’s Guide.
- 124. 12 The Network Model 124 ESM 101 Confidential This option is available in the Manager Configuration Wizard. For more about running the Manager Configuration Wizard, see the topic “Reconfiguring ArcSight Manager” in the Administrator’s Guide. ESM creates assets differently for devices in static zones and those in dynamic zones. For more about static and dynamic zones, see “Dynamic and Static Zones” on page 126. Managing Assets in Asset Channels Asset channels are an organized way to sort through thousands of assets. Asset channels make all the event sorting capabilities of active channels (see “Active Channels” on page 75) available for sorting through thousands of assets. Once assets are created, you can view a group of assets in an assets channel (right click the asset group and select Show Assets). Asset channels make it possible to sort through thousands of assets using the same sorting tools used to sort through events in active channels. For more about asset channels, see the ArcSight Console Help topic “Managing Assets.” Asset Ranges An asset range is a group of assets attached to a network that use a contiguous block of IP addresses. An asset range is useful if you have many network nodes that would be impractical to track individually, or that may come and go from the network, such as desktop PCs and laptops.
- 125. 12 The Network Model Confidential ESM 101 125 When an event is processed by the SmartConnector, the Manager, or the correlation engine, its endpoints are either identified as a single asset or as an asset belonging to a particular asset range. A reference to the asset or asset range identifier is populated in the event schema. Zones A zone represents part of the network, and is identified by a contiguous block of IP addresses. Zones usually represent a functional group within the network or a subnet, such as a wireless LAN, the engineering network, the VPN or the DMZ. Zones are also how ESM resolves private networks whose IP ranges may overlap with other existing IP ranges. Every asset or address range must have a zone associated with it. ESM comes configured with the standard global IP address ranges already grouped into zones, so if your network uses only these public IP addresses, ESM can resolve them without setting up any additional zones. However, if your network uses subnets or contains one or more private networks, you must set up zones so that ESM can resolve the IP addresses of the assets on your network. SmartConnectors tag incoming events with zones. Each zone is associated with a network; each network contains a list of zones, and each zone is associated with a specific range of IP addresses. The address ranges in zones in the same network cannot overlap. Any given IP address will be contained within the address range of at most one zone in that network. When the SmartConnector processes an event, it evaluates each of the IP addresses involved in that event and tries to locate the zone associated with that IP address among an ordered list of networks. If a matching zone is found, the search is over. If not, it moves on to the next network in the order specified during SmartConnector configuration. Finally, it always finishes with the Global network, which, by default, will always come back with a match.
- 126. 12 The Network Model 126 ESM 101 Confidential The example below shows three zones: DMZ, CORP, and DHCP. These reflect the subnets in the New York region. The router and firewall use the default global zone 58.0.0.0 - 72.255.255.255. Each endpoint represented in a given event, for example the source, destination, SmartConnector, device, and so on, has a zone, or network subnet, associated with it. Zones for endpoints on the Internet are determined by global zones as defined in the Assets > Zones tab (Assets | Zones | All Zones/ArcSight System/Public Address Space Zones). Dynamic and Static Zones Zones are created to model functional portions of the network that share a contiguous block of IP addresses. The asset auto-creation feature (see “Auto-Created Assets” on page 122) relies on zones that are already in place before device discovery occurs, either customer-created zones, or the default zones that come with ESM. When you add a SmartConnector, you assign one or more existing Networks to that Connector. All assets reported by that Connector are then associated with that Network and the zones the Network represents. ESM differentiates between dynamic zones and static zones to classify the types of assets they represent. Static Zones Devices in a static zone use static (constant) IP addresses. This represents devices that stay on the network and use the same IP address for all traffic. In order for ESM to identify assets classified in static zones, the assets must have either a unique IP address, a unique host name, or both.
- 127. 12 The Network Model Confidential ESM 101 127 Dynamic Zones Devices in a dynamic zone use dynamic addressing (such as DHCP). Dynamic zones represent assets that come and go from the network, such as laptops. ESM requires either a MAC address or a host name to identify assets in dynamic zones. ESM first looks for a MAC address; if one is not present, it uses the host name. Static Assets in Dynamic Zones If an asset is classified as static, but belongs to a dynamic zone, ESM treats the asset as if it was in a static zone. See the description and links above for how ESM asset auto-creation feature works for static zones. Networks Networks are ArcSight resources that are used to differentiate between zones whose IP ranges overlap, such as when branch locations assign the same private address spaces to resources used in other corporate locations. ESM comes configured with two standard networks: Local and Global. The Local network is where you add your custom zones. Zone mappings in the Local network override the default zone mappings provided by the Global network. The Global network provides default zone mapping if no local networks are defined, and automatically provides the correct addressing information to ArcSight SmartConnectors when they are installed. The example below shows all the networks for our sample company. Several of the IP address ranges in the various regions are the same as those in other regions. By assigning the correct networks to the respective SmartConnectors, the SmartConnectors will tag all endpoints in the events with the correct zone, so that the Manager can find the correct assets for them in the network model. For example, the IIS web server in the New York region has the same IP address as the IIS web server in the Hong Kong region. To resolve this problem, each region is placed in its Classifying Zones as Static and Dynamic It is important that zones are classified properly as dynamic or static. If a zone is classified as static, but hosts assets that come and go from the network, ESM may not be able to update the network model properly. For example: • The updated network might have duplicate and disabled assets. • Other information, such as vulnerability information and open ports, may not get updated properly.
- 128. 12 The Network Model 128 ESM 101 Confidential own network, as shown below, so ESM will actually identify the New York IIS web server as New York/10.0.21.21. Network designations enable the SmartConnector to tag events with the correct zone so that the Manager can find the correct model for the assets involved in the event. Once you have created separate networks, each zone (and the assets contained in them) is then associated with that network. To prevent ambiguity, an individual asset can only belong to one zone, and one zone can only belong to one network. Customers Customer tagging is a feature developed mainly to support Managed Security Services Provider (MSSP) environments, although it can also be used by private organizations to denote cost centers, internal groups, or subdivisions. The Customer designation keeps event traffic from multiple cost centers and/or business units clearly identified and separate. A customer can be thought of as the "owner" of an event, rather than the source or target of an event. In the network model, if you have separate cost centers you need to differentiate, you can assign a Customer designation to the ESM Network those assets reside within. Only then can two Networks that have zones with overlapping IP address ranges be assigned to the same SmartConnector, because the Customer designation is used to differentiate between the overlapping address spaces, so the SmartConnector can look up the correct zone for each endpoint involved in an event.
- 129. 12 The Network Model Confidential ESM 101 129 The Customer designation is usually used in an Managed Security Services Provider situation to track assets that belong to a cost center. If you do not have outside customers or an internal system of cost centers to track, you do not need to create Customers. The Customer attribute is only needed to clarify the zone look-up if the SmartConnector reports over the same address range but for different networks. The SmartConnector then uses the Customer designation to find which network contains the correct zone. The Manager evaluates Customer tagging in the following order: 1 The SmartConnector determines the Customer for an event using either a Velocity template or a fixed mapping. Velocity templates are described in “Velocity Templates” on page 69. 2 If there is a Customer attribute, it is used to find the lookup table to find the correct zone. If there is no Customer field value, the system uses the default look-up table. 3 The look-up table indicates to the SmartConnector which zone to associate with each IP address being processed by the SmartConnector. The Customer variable can either be a fixed string (such as "ABC Corporation") or a Velocity template variable (such as "$company_name") based on one or more fields of the event being tagged. The resulting string used to tag the event maps directly to an existing
- 130. 12 The Network Model 130 ESM 101 Confidential Customer resource. For more about how ESM uses Velocity templates,“Velocity Templates” on page 69, or the topic Velocity Templates in the ArcSight Console Help. Network Modeling Resources Summary The figure below represents how ESM uses the network model to look up zone designations and locate individual assets involved in an event. The customer designation is optional depending on whether you want to specify a cost center to differentiate traffic from one network to the next, such as in an Managed Security Services Provider situation or as an internal cost center. The diagram below shows how the network model elements interact. When an event comes into the system, the Manager uses the network model to identify the assets involved in the event. In this example, the endpoints involved in the event are circled in red.
- 131. 12 The Network Model Confidential ESM 101 131 In the simplified example above, each network has one router and one firewall. The firewall is defined in the network model as an alternate interface for each of the assets it serves. Alternate interfaces, as shown above, can cross zones. The example shows that the device that reported the event is the firewall located in the Hong Kong network; the event's source is the New York IIS web server, and the destination is the Hong Kong Apache web server. Ways to Populate the Network Model There are several ways to populate the network model with the assets that represent your monitored network. Most enterprises use a combination of these methods: ArcSight Console-Based Methods The ArcSight Console provides two ways to populate the network model: individual network modeling resources, and a Network Modeling wizard. All the individual tools for modeling the network are available in the Console. The Network Modeling Wizard provides a quick way to add basic assets to your Network Model at ESM setup time. ArcSight Console-Based Methods: • “Individually Using Network Modeling Resources” on page 132 • “In a Batch Using the Network Modeling Wizard” on page 132 SmartConnector-Based Methods: • “In a Batch Using the Asset Import FlexConnector” on page 134 • “Automatically From a Vulnerability Scanner Report” on page 134 ArcSight-Assisted Method: • “As an Archive File From an Existing Configuration Database” on page 135
- 132. 12 The Network Model 132 ESM 101 Confidential Individually Using Network Modeling Resources Set every parameter for every asset individually using ESM's network modeling resources (Assets, Asset Ranges, Zones, Networks, and Customers) and asset modeling resources (Asset Categories, Vulnerabilities, and Locations). You can also use these tools in conjunction with the other batch-loading methods that only offer limited distinctions. As long as primary identifiers, such as IP address, host name, and MAC address, remain the same, the automatic update methods only update fields with new information, so the Network Model remains stable. For more about ESM’s network and asset modeling tools, see the topic “Modeling the Network and Managing Assets” in the ArcSight Console User’s Guide and Console Help. In a Batch Using the Network Modeling Wizard The ArcSight Console provides a Network Modeling wizard as a set-up and configuration tool (menu option Tools > Network Model). The Network Model wizard is designed as a tool for first-time setup on new ESM installations, not as a method for maintaining the network model. The following data can be imported from CSV files into an ESM Manager as ESM resources: Zones define functional parts of a network, such as a wireless LAN, an engineering network, a VPN or a DMZ. Assets represent individual nodes on the network, such as servers and routers. Asset ranges represent sets of network nodes addressable as a contiguous block of IP addresses. Asset ranges are useful when you have many network nodes that would be impractical to track individually, or that may come and go from the network, such as laptops. Asset ranges should be a subset of the IP address ranges defined for zones. The Network Model Wizard not only imports the asset data itself, but also enables you to assign asset categories to those assets and zones. Asset categories are a key tool for identifying the function and criticality of assets, and are leveraged by the correlation engine to identify situations that may require investigation or immediate action. The Network Model Wizard makes it easy to create and categorize many assets and zones in a single operation. If you also add a vulnerability scanner as described in “SmartConnector-Based Methods” on page 134, the existing assets in the model are updated with the vulnerability scan report data. Each resource type requires its own CSV file. You can import more than one type of CSV file in a single operation, but you can only import one file of each type during that operation. Batch Importing Asset Data Before ESM 6.8c Before ESM 6.8c, the Asset Import Connector was the only means by which to batch load asset, zone, and asset category information into ESM in a single process. The Network Model Wizard brings that utility into the ArcSight Console, and enables you to easily fine tune the data type for each column during the import process. The Asset Import Connector is still available, and works in parallel with the Network Model Wizard.
- 133. 12 The Network Model Confidential ESM 101 133 For example, if you only have assets to import, you can import only an assets CSV file. If you have a zones CSV file, an assets CSV file, and an asset ranges CSV file to import, you can import all three at once in a single operation using the Network Model wizard. How the Network Model Wizard Works The Network Model Wizard can populate the ESM network model with assets, asset ranges, and zones from three separate CSV files using a single operation. Create a CSV file for each type of asset resource you want to create, then run the Network Model wizard to import it into the Manager. In a production setting, you would likely run a report from a network scanner and edit the output to match the format required by the Network Model Wizard. For more about the Network Model wizard, see the following topics in the ArcSight Console Help. Managing Resources (for Administrators) Modeling Your Network and Managing Assets Populating the Network Model Using the Wizard Including Asset Categories Although including one or more asset categories is not required for the wizard to work, adding categories to your assets makes them accessible to the custom and standard content that uses asset categories as a business differentiator during run-time evaluation.
- 134. 12 The Network Model 134 ESM 101 Confidential SmartConnector-Based Methods Both of these methods enable batch loading and automatic ongoing maintenance. Both methods offer limited distinctions. Both of these methods are described in more detail below. In a Batch Using the Asset Import FlexConnector ESM offers an Asset Import file FlexConnector that enables you to save Asset, Location, and Asset Category information in a CSV file, which is then automatically pulled into the Manager as part of the SmartConnector heartbeat. Existing assets in the model are updated with any new details discovered by the Asset Import FlexConnector, so the Network Model remains stable. This method does not create asset ranges, and assumes that Zones and Networks are already created. You can add Customer and Location distinctions to the assets individually. This method also takes output from any device type in CSV format. The CSV file for this method can be extended to include as many new or pre-existing asset categories as are relevant to the device(s) without having to add asset category information one by one later using the Asset Category resource in the Console. This method is appropriate for updating and maintaining your network model. Updated CSV files are automatically uploaded to ESM. New data is added to existing assets with matching identifiers. If an existing asset is not present, ESM will create one. For more about the Asset Import File Connector, see the ArcSight Asset Import SmartConnector Configuration Guide. Automatically From a Vulnerability Scanner Report Set up a scanner SmartConnector (such as FoundStone, ISS Internet Scanner, or Nessus) to use the output of a vulnerability scan to convert device information into ESM Assets along with Vulnerability information, and basic Asset Categories, such as operating system and open ports. The scanner connector that corresponds with your vulnerability scanning product sets up a directory that ESM regularly scans for updated reports. It then converts the scanner report output into internal ESM scanner meta-events, which the Manager converts into Assets, open port and OS Asset Categories, and Vulnerabilities.
- 135. 12 The Network Model Confidential ESM 101 135 You can also set the scanner SmartConnector to save network model data as a CSV file, which you can then upload into the Manager using the Files resource during your initial network model setup. For details about how to import an existing network model as a File resource, see the topic “Uploading Files and Creating a File Resource” in the ArcSight Console User’s Guide. Data derived from vulnerability scanner reports does not create asset ranges, and assumes that Zones and Networks are already created. Once scanner data is imported, you can add Customer and Location distinctions to the assets individually. For details about how ESM adds updated vulnerability information arriving from a new scanner report, see the topic “Auto-Created Assets” in the ArcSight Console User’s Guide. This method is appropriate for updating and maintaining your network model. Subsequent scans will update the basic Asset, Asset Category, and Vulnerability information without overwriting the other network modeling settings you add individually. For more information about the scanner SmartConnector for your vulnerability scanning product, see the SmartConnector Configuration Guide that corresponds with your vulnerability scanning equipment. ArcSight-Assisted Methods ArcSight Professional Services can help you populate the Network Model from an existing configuration database. As an Archive File From an Existing Configuration Database Many enterprise networks have third-party systems that already model the properties of the assets on your network. With the help of ArcSight Professional Services, you can export these network models, translate the format into the ESM schema using an ArcSight resource-generating utility, and import it to the Manager as a resource archive with the help of ArcSight Professional Services. The tools ArcSight Professional Services use can generate any type of resource, so using this method, you can have a fully populated network model without having to do any individual configuration.
- 136. 12 The Network Model 136 ESM 101 Confidential Using Resource Graphs to Verify the Network Model As you model your network, ESM provides a way to look at each level graphically. You can access this graphic view, or resource graph, by right-clicking an asset, zone, or network in the Navigator panel and selecting Graphic View. This shows you a hierarchical view of what assets belong to what zones, and what zones belong to which networks. The example below shows the resource graph for the New York Network. This gives you a graphical breakdown of what networks are associated with what zones and assets to verify that your network model is structured the way you want it. Asset Model The resources that make up the asset model are part of the overall network modeling process. The asset model resources describe attributes of the assets themselves for different purposes. Vulnerabilities describe any attributes of an asset that leave it open to exploits. Locations are a way to override the default geographic location of assets, asset ranges, asset groups, or zones. Asset Categories describe properties of an asset, asset range, or asset group to establish identity, ownership, and criticality of the assets you have installed on your network.
- 137. 12 The Network Model Confidential ESM 101 137 Vulnerabilities A vulnerability is any hardware, firmware, or software state that leaves an asset open for potential exploitation. The Vulnerability resource is a series of directories that correspond to several popular authorities that publish vulnerability descriptions, such as XS-Force, CVE, and Bugtraq. A vulnerability description usually consists of a set of software and/or hardware that, if present in the targeted system, could be exploited by an outside force. If a system meets all of the requirements described in the vulnerability description, then it is said to expose that vulnerability. In most network environments, vulnerabilities are detected and managed using a vulnerability scanner. Vulnerability scans can also be used to populate the baseline network model, which you can then enhance manually with ESM's network modeling tools. How Vulnerability Scans Populate and Update the Network Model In most network environments, vulnerability scanners are programmed to run on a regular schedule, such as every 24 hours. The scanner produces a report and writes it to a directory or database on the network. The ArcSight scanner SmartConnector is configured to monitor this network location for updated files. When it detects an updated scanner report, it collects the report data and normalizes it into the ESM schema. To communicate the data contained in the report with the Manager, the SmartConnector parses the data into individual events that contain data
- 138. 12 The Network Model 138 ESM 101 Confidential for every network asset, asset category (described in “Asset Categories” on page 140), and vulnerability represented in the report. The illustration below describes this process. Vulnerability scans report network model and vulnerability data, which is read by a scanner SmartConnector and communicated to the Manager in a series of events. Vulnerability scans can be used to populate and update the baseline network model. When the Manager receives an update from a vulnerability scanner, it first attempts to locate the assets it reports with a matching IP address already modeled in the system. If it does not find an existing asset that matches, it creates one. When you are setting up an environment, this is how a vulnerability scan can be used to populate the baseline of your network model. Once the model is established, daily vulnerability scans update this baseline with new data. Scan data from multiple vulnerability scanners, such as Retina and Nessus, are aggregated into the asset's overall exposed vulnerabilities, so scan data from one vendor does not overwrite the scan data from another.
- 139. 12 The Network Model Confidential ESM 101 139 Reference Pages for Vulnerabilities The Vulnerability groups that come with the ESM standard content contain links to the vendor web sites that publish associated vulnerability data. This helps ensure that users have access to the latest vulnerability data associated with a particular product. For more about reference pages, see “Reference Pages” on page 52. You can also use reference pages to direct users to more information about equipment leases or asset details using an External ID that refers to an internally maintained database. Reference pages can also be used to provide additional descriptions of asset categories you create. Refer to External Databases Using External IDs If your company maintains a database that describes your network assets with details, such as ownership and lease information, you can use ESM's External ID option to refer to those databases. When modeling your assets, include the external ID for that asset in the External ID description line of the Asset editor. Calculating Event Priority ESM determines the priority of an event using the four factors described in “Evaluate the Priority Formula” on page 38: Model confidence: Model confidence refers to whether or not the target asset has been modeled in ESM and to what degree. An asset that has been modeled in ESM using output from a vulnerability scanner will report more information, such as vulnerabilities exposed and open ports, and thus have a higher model confidence rating than an asset that was modeled manually and does not contain vulnerability or open port information. Relevance: Relevance refers to whether or not an event is relevant to an asset based on whether the event targets ports and/or known vulnerabilities, and if so, whether those vulnerabilities and/or ports are exposed on the asset. Severity: Severity scores are assigned based on the attacker and target's presence in one of ESM's threat tracking active lists. Asset Criticality: Asset criticality is set by you in the network modeling process by categorizing your assets in ESM’s criticality asset categories (/System Asset Categories/Criticality/Very High, High, Medium, Low, and Very Low). The model confidence is higher if an asset is scanned for vulnerabilities and open ports. The relevance is higher if the attacked port is actually open on the asset, and if the attack is specifically trying to exploit that vulnerability on that asset. ESM calculates the priority of an event in part by evaluating whether the targeted port is open, and whether the target asset exposes the vulnerabilities exploited by a particular attack. The overall event priority is calculated based on agentSeverity (see “Event Severity” on page 31) adjusted by Model Confidence, Relevance, Severity, and Criticality using a detailed formula. The Vulnerability event field is populated when the target of the event is an asset that exposes a vulnerability signature that matches the deviceEventClassID field of the event. This is described in the Relevance portion of the priority formula in “Evaluate the Priority Formula” on page 38.
- 140. 12 The Network Model 140 ESM 101 Confidential Likewise, a vulnerability scan finds open ports and assigns that information to the asset as an asset category. For example, if an asset has port 80 open, that asset would be assigned the following asset category: /All Asset Categories/Site Asset Categories/Open Port/TCP/Port 80 For example, a given attack might be known to exploit Bugtraq 2010, CVE-1999-0153, or X-Force 173. If the targeted system exposes either of those vulnerabilities and the attacked port is open on the asset, then a system can assume that the attack is likely to succeed (priority factor 5-yellow or 10-red). Otherwise, the attack will likely fail. Locations ESM provides a location data store that maps an IP address to the owning body for the block of IP addresses to which it belongs. Your organization may have finer-grained detail, such as the physical location of all of your networks or networks outside your control, or adjustments to the data store that ESM supplies. The Location resource is the way you can override the ESM default location mappings with location information relevant to your network. Location is an attribute you can set if the asset you are modeling resides in a geographic location that differs from the location set by the mapping data store that associates IP addresses with location information. Asset Categories Asset categories are ESM resources that describe properties of an asset, such as the operating system running on it, key applications it hosts, its role within the enterprise, and any other properties you want to consider when evaluating threats or behaviors associated with this asset. Asset categories model your assets in terms of how they are used. The objective of asset categories is to establish identity, ownership, and criticality of the assets you have installed on your network. Asset categories can be applied to assets, asset ranges, and asset groups, or to whole network zones. Modeling asset categories is a multi-step process that requires you to consider what types of information you wish to track from various assets in your network, and how those assets interrelate. The distinctions you draw in this process become factors for the filters, rules,
- 141. 12 The Network Model Confidential ESM 101 141 data monitors, and reports you will use or build to correlate events in your network. In this way, asset categories add business relevance. During correlation, events generated by an asset that is categorized as a compliance asset trigger compliance-related asset categories. You may already have asset category data modeled in a third-party asset inventory tool, such as Microsoft Software Inventory Analyzer or Alchemy Labs Asset Tracker for Networks. You can export data from these third-party sources as an XML file, then import it into ESM using the Archive Command tool. For instructions about how to do this, see the Administrator's Guide topic "The Archive Command Tool." Most of the methods for populating the network model described in “Ways to Populate the Network Model” on page 131 include a way to add asset categories to your assets, asset ranges, asset groups, and zones. The following sections describe how asset categories behave when assigned to individual assets, asset ranges, asset groups, and zones. Asset Categories Assigned to Assets, Asset Ranges, and Asset Groups Categories assigned to individual assets and asset ranges apply only to those individual assets. This is the most granular level to which you can apply asset categories. If an individual asset falls into an asset range, the asset also inherits the asset categories assigned to the asset range.
- 142. 12 The Network Model 142 ESM 101 Confidential Asset groups are folders in which one or more asset resources are stored. Asset groups are hierarchical, which means that properties assigned to an asset group apply to all the assets contained within that group. Categories assigned to asset groups apply to all assets and asset ranges contained within that group. Individual assets and asset categories within a group inherit the categories assigned to the group, if any, in addition to the asset categories assigned to them individually. In the example below, the asset W2KNY101 has its own asset categories and inherits those assigned to the asset group New York Office. The asset and asset range contained in the asset group New York Office inherit the categories set for the asset group as well as their own individual asset categories. Categories are a hierarchy, and while the level below inherits the properties of the level above, all points in the hierarchy are considered unique categories. For example, you might have an asset that runs Windows NT SP3. You could categorize the asset as Windows, Windows NT, or Windows NT SP3, depending on how much detail you want to correlate or report on. Asset Categories Assigned to Zones Categories assigned to zones describe characteristics of the network itself rather than the assets the zone represents. This is a way you can categorize traffic on a network where the assets themselves are not constant, such as a wireless or VPN network. For example, the categories might describe whether or not the network is wireless, encrypted, or a VPN network. You may be characterizing the network itself or the traffic on the network (wireless describes the network; encrypted describes the traffic) rather than the particular assets involved.
- 143. 12 The Network Model Confidential ESM 101 143 Asset categories assigned to zones do not get passed on to any assets associated with that zone. Zone groups are folders in which one or more zone resource is stored. Although the assets contained in a zone do not inherit the properties of a zone, the zone groups are hierarchical, which means that properties assigned to a zone group apply to all the zones contained within that group. For situations where assets are not fixed, such as a wireless or VPN network, you can assign categories to a zone. For example, if a zone is categorized as confidential, you can write a rule that detects any unencrypted traffic crossing that zone, which can trigger the firewall to drop the connection or to notify an investigator. Create Your Own Asset Categories ESM provides default asset categories, which are utilized by ESM standard content. You can use these categories in content you build, or you can create your own to meet your specific needs. When deciding how to categorize your assets, keep the following in mind: What business areas do you need to differentiate? How do your business partners access your network? Do you need subgroups for a specific business need, such as regulatory compliance? When you have one or more assets categorized in a particular group, you can then write filters, rules, reports, and data monitors that apply only to those assets using the inGroup operator. This operator enables you to have content that refers to generic entities rather than specific ones. To learn more about how to use the inGroup operator, look in the ArcSight Console Help under Common Conditions Editor.
- 144. 12 The Network Model 144 ESM 101 Confidential
- 145. Confidential ESM 101 145 Chapter 13 The Actor Model The actors feature enables you to build a model of the users in your network environment so you know who is doing what with resources on your network, when, and how. Identity management systems (IDMs) protect network assets while managing access to ranges of users, such as employees with security clearances, partners, and contractors. One user may have many accounts, user IDs, and roles on different systems, making it difficult to follow what they are doing on your network, and whether their behavior is appropriate for their role. The actors feature creates a real-time user model that maps humans or agents to activity in applications and on the network. Once the actor model is in place, you can use related information on page 148 to visualize relationships among actors, and correlation to determine if their activity is above board. The actors feature is available with an ArcSight IdentityView license. “How the Actors Feature Works” on page 146 “Actor Resource Framework” on page 146 “Actor Global Variables: Identifying Actors from Events” on page 147 “Actor Channels: Navigating Thousands of Actors” on page 148 “Category Models: Analyzing Actor Relationships” on page 148 “Actor Model Import Connector” on page 148
- 146. 13 The Actor Model 146 ESM 101 Confidential How the Actors Feature Works Similar to how ArcSight SmartConnectors normalize event data from different devices into a common data schema, the Actors feature normalizes user information stored in different formats in different authentication data stores to create a profile that identifies users on your network. In the example diagram in “The Actor Model” on page 145, ESM receives the actor data from the Microsoft Active Directory system via the Actor Model Import Connector. Events arrive from applications that all use different data stores to authenticate user activity, which all use different account IDs to identify the user John Zed. ESM identifies the activity as all belonging to the same actor. That actor is represented in ESM as JOHN. The actors feature is supported internally using the Actor Resource Framework, a series of internal look-up tables maintained by regular updates from the Actor Model Import connector. As part of setting up the actors feature, you also configure an applications and authenticators active list to identify the mapping between the applications in your network environment and the data stores they use to authenticate users. In the example shown in “The Actor Model” on page 145, Windows Server Active Directory is the authentication data source for Microsoft Exchange and SAP Real-Time Security. Once the actor model is in place, ESM provides modeling and visualization tools (related information on page 148) that make it possible to depict direct and indirect relationships between actors in the Actor model. Actors and category models provide real-time, drill-down views of users and their activities beyond what was possible with custom-created session lists for identity correlation in previous ESM versions. For testing purposes, you can also manually add actors to ESM. You can also import or redefine views of user groups and relationships with category models. Actor Resource Framework As shown below, when events arrive at the Manager, resources that use conditions or select fields invoke one or more of the actor global variables provided in ESM standard content. These global variables and the actor data maintained in the Actor Resource Framework provide several ways to identify actors using whatever user identity attributes are available in events arriving from different applications from across the network. The global variables first look up the authenticator using the device-specific data, such as vendor and product information in the event, then look up the relevant user information from the Actor Resource Framework tables to positively identify the actor. For details about the Actor Global Variables provided in the content that comes with IdentityView, see the IdentityView Solution Guide.
- 147. 13 The Actor Model Confidential ESM 101 147 Below is a detailed look at how the Actors feature works. ESM resources leverage system-provided actor global variables to look up actor identity attributes maintained in the Account Authenticators table and the Actor Resource Framework. Actor Global Variables: Identifying Actors from Events The actor data stored in the Actor Resource Framework coupled with actor global variables make it possible to identify an actor from any given event, then correlate that activity with other activity or attributes of that actor. The ability to identify an actor from a given event and correlate that activity with other events involving that actor and attributes of that actor, such as location and role, make it possible to verify that an actor’s activity is appropriate for their role. ESM standard content provides a series of actor global variables that are part of the Actor Resource Framework, which ESM uses to identify and store actor-related data from events in the look-up tables of the Actor Resource Framework. You can also use these global variables in your own correlation content. The content provided with the IdentityView solution includes more global variables that enable you to identify actors by just about any attribute, such as role, account ID, DN, IP, threat score, and so on. For more about using the Actor Resource Framework global variables, see the ArcSight Console User’s Guide topic “Actor Resource Framework Global Variables.”
- 148. 13 The Actor Model 148 ESM 101 Confidential For more about the global variables that come with the IdentityView solution, see the ArcSight IdentityView Solution Guide. An IdentityView license is required. For an outline of how to construct your own actor global variables, see the ArcSight Console User’s Guide topic “Leveraging Actor Data Using Variables.” Using Standard Content to Track Actor Configuration Changes Standard content also provides a set of coordinated resources that track actor configuration changes, such as when actors are created, updated, and deleted. For more about this standard content, see the ArcSight Console User’s Guide topic, “Tracking Actor Configuration Changes Using Standard Content.” Actor Channels: Navigating Thousands of Actors ESM provides actor channels, which present all the actors in your actor model in a single, scrollable view. Like active channels, you can apply local filters to actor channels to find actors with certain attributes. Actor channels are the only way to see actor models that contain 1,000 or more members, because display space in the Navigator panel is limited. You can also use actor channels for viewing actor models with fewer than 1,000 members. For more about viewing actors in actor channels, see the ArcSight Console User’s Guide topic “Viewing Actors in an Actor Channel.” Category Models: Analyzing Actor Relationships Once you have actor information created, you can make logical groupings to represent relationships among actors and actor attributes using category models. Category models can reflect direct actor relationships, such as reporting hierarchies, or relationships between actors who share common attributes, such as actors in a particular location. For reporting hierarchies, your model can consist of a top-to-bottom structure (by Manager), or its reverse (by Assistant). Category models can also reflect relationships between actors using custom attributes defined by the user. You can use category models to visualize these relationships, then leverage the data gathered in them using the HasRelationship function in local and global variables. You can use this model to group and visualize users in your organization in numerous ways, such as reporting structures, organizational units, or role-based functions, then use these relationships as parameters in user-defined monitoring, analysis, and correlation. Actor Model Import Connector The new ArcSight Actor Model Import connectors support bulk import of user accounts from multiple identity management systems, such as Microsoft Active Directory. (For a complete list of supported identity management systems, see the ArcSight connector documentation.) The Actor Model Import connector is the next generation of the Identity Model Import connectors introduced with previous versions of ESM in support of the Identity View
- 149. 13 The Actor Model Confidential ESM 101 149 solution. The Actor Model Import connector imports the user data into the actors resource, where it is leveraged by the infrastructure within ESM that identifies and tracks user activity. Correlated and normalized data about user activity is then available for monitoring and investigation, further correlation, and reporting. The actor model used to describe users is automatically populated with the attributes configured for it by the Actor Model Import connector when ESM establishes a connection with the connector. In addition to the basic single-value attributes, each actor is likely to have multi-value attributes, specifically multiple account IDs, and multiple roles, which are tracked using your IDM system. These multi-value attributes can appear differently in events coming from different devices. In some cases, such as a non-IT-related role, the information is not included in event data at all, but is still valuable information to help identify users and correlate their activity to help ensure appropriate behavior and access to resources hosted on the network.
- 150. 13 The Actor Model 150 ESM 101 Confidential
- 151. Confidential ESM 101 151 Chapter 14 Managing Resources and Standard Content This chapter defines what ESM means by resources, and describes the tools available to manage and access them. It also introduces standard content and its intended uses. ESM Resources ESM manages the logic used to process events using objects called resources. A resource defines the properties, values, and relationships used to configure the functions ESM performs. Resources can also be the output of a configuration that has been executed on events (such as archived reports, or Pattern Discovery snapshots and patterns). Resources are used for displaying and analyzing events, and contribute to generating additional events that are used internally by ESM for correlation or administration. “ESM Resources” on page 151 “Packages” on page 158 “Access Control Lists (ACLs)” on page 161 “Standard Content” on page 162 “Use Cases” on page 164
- 152. 14 Managing Resources and Standard Content 152 ESM 101 Confidential ESM resources are accessed in the Navigator panel of the ArcSight Console. Resources appear as objects in the navigation panel of the ArcSight Console and are stored in the system storage area of the CORR-Engine. Resource objects can be imported and exported from the system for sharing among multiple Managers, and can be archived for storage and data retrieval. Resources are stored hierarchically in groups that share common properties, and they can have relationships with other resources that share common dependencies. Resources that define properties, values, and relationships and evaluate events during the event life cycle as part of a use case are also referred to as content. Content is designed to address specific usage scenarios. ESM installs a predefined set of standard content for basic functions and system administration, and offers a series of content packages you can install that address common business and security cases. You can also use ESM's content authoring tools to develop your own content tailored to your business environment. For more about ESM standard content, see “Standard Content” on page 162. File Resource A File is an ESM resource that contains a non-ESM object, which other resources can access to provide users with more information or to perform special functions. Files can be used to contain scripts, utilities, data files, templates, or any general purpose file. Files are also what make the objects they contain transportable across multiple Managers. For example, you can write a rule that, when triggered, executes a script to initiate a process on your network. The script can be contained in a File resource so it can be transported from one Manager instance to another using the Packages resource. Once at
- 153. 14 Managing Resources and Standard Content Confidential ESM 101 153 the destination Manager system, the contents of the file must be extracted to the file system, where its function can be accessed by the resources on that Manager. Standard content includes two files, which supply Velocity template macros for use by the vulnerability mapping system. For more about Files, see the topic Managing Files in the ArcSight Console Help. For more about the file resources that accompany standard content, see the Standard Content Guide — ArcSight System and ArcSight Administration. The ArcSight Archive Utility The ArcSight Archive utility is a multi-function command-line tool that can be used by ArcSight Administrators to perform routine maintenance, such as back-up and restore. The archive utility is another way, besides Packages, that authors can propagate content among multiple Managers, or to configure one Manager with the same content as another. When you export a resource using the Archive utility, it may have dependencies on other resources. For example, a rule may utilize (refer to) three filters. When the rule is exported using the archive utility, you should also export the three filters it depends upon, so the join between them is preserved. Packages maintain these relationships automatically. For more about the archive utility, see Archiving Resources in Chapter 3, Resources, of the Administrator's Guide. Resource Graphs You can use a graph view to see the dependencies one resource has on other resources. To generate a graph view, right-click an individual resource in the Navigator panel and select Graph View. The resource graph will be rendered in the Viewer panel. The example resource graph below shows the rule Hostile - Attempt that is part of the threat escalation system in the standard content (/All Rules/ArcSight
- 154. 14 Managing Resources and Standard Content 154 ESM 101 Confidential System/Threat Tracking/Hostile - Attempt), the active lists it reads from, and the other rules and filters they draw from. Each of the nodes in a graph view represent a dependency, or relationship, the resource has on another resource. Uniform Resource Identifiers (URIs) and Resource Groups A URI is a path descriptor for the location in the ESM data hierarchy where resources are stored. URIs are how ESM identifies where resource definitions are stored. For example, when writing a filter or rule condition, you may want to reference an asset category, or another filter, or an active list. The URI contains the file path to that resource so ESM will insert the correct logic. Simply put, URIs are the file path to a resource. Individual resources are arranged in groups. Resource groups themselves are also resources, so they can be put into other groups. This becomes a nesting tree, where the groups are depicted as file folders. The example shown below is in the Filters section. The URI for the threat escalation filter Compromised Targets would be:
- 155. 14 Managing Resources and Standard Content Confidential ESM 101 155 All Filters/ArcSight System/Core/Threat Level Filters/Compromised Targets. Some resources are only groups that do not contain any logic, configurations, or definitions. An example of this is asset categories. Because an asset category does not actually express any logic or configuration parameters, it is only a container for organizing asset category descriptions. The example below shows the Asset Categories navigation tree. The URI for the High criticality system asset category would be:
- 156. 14 Managing Resources and Standard Content 156 ESM 101 Confidential All Asset Categories/System Asset Categories/Criticality/High. Resource IDs The resource ID is an auto-generated 25-character string that uses a combination of numbers, letters, and symbols to uniquely identify resources. Resource IDs are viewable in the resource editor in the Inspect/Edit panel. Referring to the resource ID helps to uniquely identify resources when you are developing your own content, or when sharing resources among Managers.
- 157. 14 Managing Resources and Standard Content Confidential ESM 101 157 The example below shows the resource ID for the System Core filter All Events. The resource ID is a non-editable field.
- 158. 14 Managing Resources and Standard Content 158 ESM 101 Confidential Finding Resources You can use the Find Resource feature to locate other resources (Edit > Find Resource or Ctrl + F). In the example below, the search was conducted for the keyword network monitoring. This sample search found all resources designated as part of the network monitoring foundation. Highlight one of the items returned in a Find window to view its details in the Details pane. This example shows the details of the filter Inbound Traffic. Using the Find Resource feature can be helpful when you know a key word or concept you are searching for, but don’t know where a particular resource is located. You can search through all resources, or search through a particular resource type, such as all rules. For more about the Find Resource feature, see the ArcSight Console Help topic Finding Resources. Packages A Package is an ESM resource that enables a set of related resources to be backed up, or transported and updated among Managers. A package of resources can be installed or unloaded as a unit. ArcSight delivers standard content and solutions as packages, and you can also create your own packages. Packages make some of the back-up and transfer capabilities of the ArcSight Archive tool available through the Console user interface. Packages are also created for the purposes of content syncrhonization, a function of configured ESM peers where one Manager is the publisher of all content. When the content is packaged specifically for synchronization, the publisher pushes packages to subscribers.
- 159. 14 Managing Resources and Standard Content Confidential ESM 101 159 Packages are transported in a file called a bundle (with the extension .arb), which contains one or more packages. You can import and export bundles and install and uninstall the packages that the bundles contain. When you import a bundle, the .arb source file is saved as a File resource (see “File Resource” on page 152). Packages can be used to transport content for a family of use cases, and they can also be used to transport blocks of unrelated resources, or a core of common resources that can be leveraged by other use cases. The Packages resource editor also manages dependencies on resources located in other packages. Package States: Imported and Installed A package can exist in two states in the ArcSight Console: imported and installed. A package that has been installed loads its resources into the ESM CORR-Engine and makes them accessible in the Navigator panel resource tree. The package icon in the Navigator panel package view will appear blue. If a package has been imported, it will be visible in the Package view in the Navigator panel, but the resources it contains will not be available in the resource tree view. The package icon in the package view will appear grey. If you do not want the package to be available in any form, you can delete the package. You can create, export, and import packages in order to share resources among multiple Managers. When a package is imported from one Manager to another, it must also be installed to make its resources available in the Navigator panel resource tree. Package View A key value provided by packages is their ability to manage dependencies among other related resources when preparing sets of related resources for backup or transport to another Manager. The resource tree contains a tab that provides a view of the all resources that are associated with packages. This view also provides access to tools with which you can import, install, and export packages, edit, uninstall, and delete packages, and create new packages. The dependency view toggle ( ) shows required packages, which are packages on which another package depends. In the example below, the dependency view shows that Intrusion Monitoring has two required packages, Anti Virus and Network Filters, indicated by the red asterisk ( ). If you expand the required package nodes, you will be able to see which specific resources the Intrusion Monitoring package depends upon.
- 160. 14 Managing Resources and Standard Content 160 ESM 101 Confidential Toggling the dependency view off shows only the contents of the package itself. The Packages view in the Navigator panel provides access to all the resources that are part of a package in a single view. The package management tools to create new packages and edit existing ones are available from the package right-click menu. For more about using Packages, see the topic Managing Packages in the ArcSight Console Help. Content Management You can leverage peer relationships if you want a hierarchical structure where a single Manager is the source of ESM content (the publisher) and peers the recipients of such content (subscribers). In this case, the content management feature gives you the ability to “push” ESM content in the form of packages on a regular schedule or manually, as reqyured.
- 161. 14 Managing Resources and Standard Content Confidential ESM 101 161 For information on peer configuration and content management, refer to the ArcSight Command Center User’s Guide. Access Control Lists (ACLs) ESM manages user access to resources using Access Control Lists (ACLs). ACLs are applied to user groups, which allows the users in that group to have read/write access to the resources specified by the ACL. You can further refine access to individual resources by specifying what user groups can have read/write access to it. Subgroups inherit the ACL settings of their parent groups. If a resource is assigned to more than one user group, the ACL is the combined list of those two groups. Users and user groups and the ACLs to which they have access are also managed by the ArcSight Command Center. See the topic “Managing Users” in the ArcSight Command Center User’s Guide. User Access Controls When you add users and user groups, you use the user ACL Editor to set access levels to individual resource groups. You can also set user group membership, specific event privileges, and sortable field set access. The ACL Editor provides access to: Access Privileges. This tab shows which user groups you belong to. User Permissions. Users can view the resource groups they have read and/or write access to. Administrators can edit these privileges. Event Privileges. This tab specifies filters the user group uses. Users in this group will only see events that match the filter conditions specified here. Sortable Field Sets. This tab specifies the sortable field sets the user group uses. Users in this group will only see the fields specified by these field sets. This enables you to protect data in sensitive event fields while providing users with different security clearances access to the comprehensive event stream. For more about sortable field sets, see “Sortable Field Sets” on page 79, or look in the ArcSight Console Help under Sortable Field Sets. Resource Access Controls Every resource group has an ACL (list of user groups that have access to it), which determines which user groups have permission to view and edit the resources contained in that resource group.
- 162. 14 Managing Resources and Standard Content 162 ESM 101 Confidential ACL Editor Access to both types of access controls (user and resource) is managed by the ACL Editor. Every user and resource group provides access to the ACL Editor using the right-click command Edit Access Control from the Navigator panel. Standard Content ESM comes with a series of coordinated resources that address common enterprise network security and management tasks. These resources under ArcSight Administration, ArcSight Core Security, and ArcSight System are installed automatically with ESM to provide essential system health and status operations. ArcSight Foundation provides various options during installation. Others are presented as install-time options organized by category. These resource systems are referred to collectively as standard content. Every branch in the resource tree (except ArcSight Solutions) contains standard content, a coordinated set of resources that address common security scenarios and facilitate basic ESM functions. For more information, refer to the Standard Content Guide specific to the content. Standard Content Foundations The standard content is an option during the Manager installation process in a series of packages grouped functionally into foundations. Each foundation is a coordinated system of resources that provides real-time monitoring capabilities for its area of focus, as well as after-the-fact analysis in the form of reports, trends, and trend reports. You select the foundation to install. You can extend these foundations with additional resources specific to your needs, or you can use them as a template for building your own resources and use cases. Several of the foundations rely on a series of common resources that provide core functions for common security scenarios. Resources that mange core ESM functions are expanded and locked to protect them from unintended change or deletion. Foundation Description Configuration Monitoring Foundation The Configuration Monitoring foundation identifies, analyzes, and remediates undesired modifications to systems, devices, and applications. Configuration monitoring is concerned mainly with monitoring hosts and user accounts for configuration-related activity, such as installing new applications, adding new systems to the network, anti-virus/network scanner/IDS engine and signature updates, and asset vulnerability postures. The configuration monitoring foundation helps you monitor how your networks change over time, measure daily statistics, understand the changes made, and know who’s making them. Trends help you know what is normal and spot anomalies that should be investigated.
- 163. 14 Managing Resources and Standard Content Confidential ESM 101 163 ArcSight System Content The ArcSight System content consists of resources that ESM requires for basic security processing functions, such as threat escalation and priority calculations, as well as basic throughput channels required for out-of-the-box functionality. Intrusion Monitoring Foundation The focus of the Intrusion Monitoring foundation is to identify hostile activity and take appropriate action. This foundation provides statistics about intrusion-related activity, which can be used for incident investigation as well as routine monitoring and reporting. As with previous releases, the essential security monitoring functions of the Intrusion Monitoring foundation make up the bulk of the ESM standard content. The Intrusion Monitoring foundation targets generic intrusion types as well as specific types of attacks, such as worms, viruses, denial-of-service (DoS) attacks, and so on. Network Monitoring Foundation The Network Monitoring foundation monitors the status of network throughput and network infrastructure as monitored by Argus, the real-time flow monitoring device by Qosient. This foundation provides statistics about traffic and bandwidth usage that helps you identify anomalies and areas of the network that need attention. ArcSight Workflow Foundation The ArcSight Workflow foundation is a system of active channels and reports that support incident response tracking using ESM’s incident response system. Qualifying events in the other ESM foundation packages trigger notifications and cases that get escalated through ESM’s incident response stages. ArcSight Administration Foundation The ArcSight Administration foundation provides statistics about the health and performance of ESM and its components. This foundation is installed automatically, and is essential for managing and tuning the performance of ESM content and components. ArcSight System Content Use Cases Description Internal ESM function The system content contains sets of resources that manage ESM’s network modeling, vulnerability handling, and other internal ESM functions. These resources are leveraged by many basic systems and correlation use cases. Correlation evaluation System content rules, active lists, and filters help drive parts of the correlation engine, such as priority formula calculations and basic out-of-the-box event processing. Security center operations and monitoring The system content provides standard field sets and active channels to provide basic operations and monitoring functions as soon as ESM is installed. Benchmarking and analysis ESM provides several benchmarking and analysis tools as add-on modules. As part of the system content, ESM includes two basic Pattern Discovery profiles. These profiles will be active only if you have Pattern Discovery installed. Foundation Description
- 164. 14 Managing Resources and Standard Content 164 ESM 101 Confidential This content is installed automatically so that these functions and the infrastructure that supports them are immediately available. To safeguard against accidental damage or deletion, these resources are locked (read and write protected). The core content infrastructure also serves the systems and solutions you deploy, and ESM content you create yourself. The diagram below shows how the system content is used by the ESM system. The standard features included in the core content support basic ESM functions, such as network modeling, correlation, basic monitoring, and benchmarking. Use Cases Use cases are a way to view, configure, and transport specially developed sets of related resources that address specific security issues and business requirements. Use cases are currently available for ArcSight-created content only. Once installed, use cases are presented in a new tab in the Navigator panel. When you open a use case, the viewer panel displays all the different types of resources that make up that use case and the types of devices whose events they operate on in a single view. This makes it easy to see what resources are related to others. For example, the ArcSight standard content usage scenario Internal Reconnaissance is made up of two active lists, two data monitors, three filters, an asset category, two rules, and a dashboard to monitor internal reconnaissance activity by users and machines. In the Use Cases view, all these resources are displayed and accessible for editing from a single panel. Use cases are delivered by ArcSight in packages (ArcSight Resource Bundles [.arb]) ready to be installed from the new Jumpstart directory. The Jumpstart directory delivers ArcSight start-up content designed to streamline the process of getting your ESM environment customized and online analyzing events quickly.
- 165. 14 Managing Resources and Standard Content Confidential ESM 101 165 Configuring Use Cases For resources that require configuration with values specific to your operating environment, the Use Cases feature provides a Use Case configuration wizard to configure them in a simple, centralized operation. The Use Case configuration wizard works on individual use cases and Master use cases. Master Use Cases For scenarios with multiple related use cases, you can manage common resources shared by a group of related use cases with a Master use case. A Master use case is simply a use case of shared resources. Master use cases help centralize any configuration required to tailor the use case to your operating environment. When a Master Use Case is present, the Use Case configuration wizard for the Master use case is automatically launched when the ARB containing the group of related use cases is installed. The individual use cases that are part of that group all reference the configurations set in the Master Use Case. A single package may contain several related use cases. Common resources are centralized in a Master use case. The use case configuration wizard configures that single use case as well as the master use case resources. How to identify a Master use case in a resource tree. Master use cases look the same as regular use cases in the resource tree. The Master use case is the only one whose title contains the word Master.
- 166. 14 Managing Resources and Standard Content 166 ESM 101 Confidential
- 167. Confidential ESM 101 167 pre-persistence rules 57 A access control list (ACL) editor 162 managing 161 resource access controls 161 user access controls 161 action event 59, 72 active channel 75 asset channel 124 field set 79 filters in 55 live channels 77 resource channels 78 rules channel 63, 78 active list 60 actors model import connector 148 agent severity 31 aggregated events 35, 72 aggregation rules 58 SmartConnectors 35 alternate interface 113 annotations stages 48 workflow 46 archive storage in CORRE 105 utility 153 archived reports 98 ArcSight Console 21 package view 159 ArcSight Web 21 ASM event 72 asset asset range 124 auto-created asset 122 channel 78, 124 event schema 112 network model 121 asset categories 140 assigned to assets, asset ranges, and asset groups 141 assigned to zones 142 create your own 143 audit event vs. other events 72 B base event 31, 72 C case 47 channel 77 active channel 75 asset 78, 124 resource channels 78 rules channel 78 common conditions editor (CCE) 55 CORR Engine storage 103 correlated events 60, 72 correlation data monitors 66 filters 54 overview 53 rule aggregation 58 rules 56 correlation event 59, 72 CORR-Engine storage 20 CounterACT, connector, integration commands 87 customers 128 D dashboard monitor and investigate 79 data fields event 107 data monitors correlation 66 event graph 80 event-based 65 non-event based 67 overview 65 data sources supported 19 delta reports 99 device device chain 117 devices and assets 111 devices and connectors in a network 113 in the schema 111 severity 31 E endpoint 111 Enterprise Security Management (ESM) 15 escalation level 50 ESM 15 Index
- 168. Index 168 ESM 101 Confidential anatomy 16 ArcSight Console 21 Manager 20 resources 24 roles 10 standard content 162 event data field groups 108 data fields 107 severity 31 event categories 32 event categorization utility 33 event data field groups 108 fields 107 normalize 30 event graphs as a monitoring tool 81 as an investigation and analysis tool 82 data monitors 80 event schema 108 alternate interface 113 annotations 46 assets 112 chapter 107 event types action 59, 72 aggregated 35, 72 ASM 72 audit 72 base 31, 72 correlated 72 correlation 59, 72 event type summary 71 normalized 31, 72 raw 71 external attack 114 external ID 139 F field sets active channel 79 overview 79 sortable 79 fields & global variables 79 files 152 filter 54 in active channels 55 named conditions 55 SmartConnector filters 35 unnamed conditions 55 final device 117 focused reports 99 foundations 162 G global variables 68 I integration commands 87 J job scheduler 99 K knowledge base 51 L lifecycle of an event 27 phase 1 - data collection & event processing 29 phase 2 - priority evaluation and network model lookup 37 phase 3 - correlation evaluation 53 phase 5 - workflow 45, 75 phase 6 - reporting and incident analysis 93 lightweight rules 57 live channel 77 local variables 68 locations 140 Logger 23 M Management Console 21 Manager overview 20 monitoring active channel 75 N Network Configuration Manager (NCM) 23 network model 119 actor model 145 asset categories 140 asset channel 124 assets 121 customers 128 locations 140 modeling summary 130 networks 127 populate 131 vulnerabilities 137 wizard 132 zones 125 network node 111 networks 127 normalization 30 normalized event 31, 72 notifications 49 messages and velocity templates 70 notification acknowledgements 51 notification destinations 51 notification groups 50 O original agent 117 P packages 158 ArcSight Console package view 159 states (imported, installed) 159
- 169. Index Confidential ESM 101 169 pattern discovery 100 overview 22 priority customize formula 43 formula 38 Q queries 94 query viewers 84 R raw event 71 real-time rules 63 reference pages 52 for vulnerabilities 139 reports archived reports 98 delta reports 99 focused reports 99 job scheduler 99 overview 93 queries 94 templates 97 trends 95 types 98 resource graphs 153 verify the network model 136 resources channel 78 files 152 find 158 overview 151 packages 158 resource access controls 161 resource graphs 153 scheduling 99 retention policy, in CORRE 104 roles 10 rules 56 actions and thresholds 59 aggregation 58 channel 63, 78 correlation events 59 deploying rules in real time 63 how rules are evaluated 58 how rules use active lists 60 how rules work 56 how they use session lists 63 testing rules in a rules channel 63 S scheduled jobs manager 100 sensor 111 session list rules 63 SmartConnectors 17 aggregate events 35 apply event categories 32 configuration 36 execute commands 36 filter and aggregate events 35 filter events 35 look up customer and zone in network model 34 sortable field sets 79 source/destination, attacker/target a trojan attack 115 source/destination, attacker/targett an external attack 114 stages 48 standard content 162 foundations 162 status monitor event see ASM event 72 system content 163 T templates 97 threat level formula 38 Threat Response Manager (TRM) 23, 24 integration commands 87 trends 95 queries 94 trojan attack 115 U uniform resource identifier (URI) 154 use cases in standard content foundations 162 user interfaces 21 users groups 49 paths through ESM 14 user access controls 161 V variables 68 velocity templates 69 vulnerabilities and event priority 139 overview 137 scans 137 W workflow annotations 46 knowledge base 51 notifications 49 reference pages 52 stages 48 users and user groups 49 Z zones dynamic and static 126 overview 125
- 170. Index 170 ESM 101 Confidential