SlideShare a Scribd company logo
Excel Datamining Addin Advanced
What is DATA MINING Data mining (or Knowledge Discovery) refers to the process of analyzing a give data set from different precepts and scenarios in order to discover patterns in the given data set. This information can help reveal the hidden trends about products, customer, market, employees which prove very important while designing new strategies for product marketing, market analysis, increasing revenue or cost cutting, forecasting sales figures or analyze those components that are critical to the success of the company. Data mining has proved its worth in many fields such as business, computers (finding patterns in data required for machine learning,  AI), biotechnology (data mining DNA codes to find out how changes in its structure affect human health and immunity to diseases like cancer etc), share market forecasts etc, thus making data mining a rapidly growing field with numerous possibilities and uses. Data mining, though a relatively new term has long been used by large corporations to churn through large data sets to incur conclusions with the help of powerful computers. As computers became faster and more capable, new and more advanced data mining techniques/algorithms have been developed in order to return more precise conclusions.
What is the SQL Server Add-in Microsoft has introduced a new and efficient data mining tool ,the “ Microsoft SQL Server 2005 Data Mining Add-Ins for Office 2007 ” putting data mining within the reach of every user or desktop. The add-in provides an easy way to reap the benefits of the data mining by harnessing the sophisticated data mining algorithms of  Microsoft SQL Server 2005 Analysis Services  within the familiar Microsoft Office environment at every desktop
Pre-requisites Microsoft .Net framework 2.0 : The add-in requires the .NET framework capabilities to function under Excel . Microsoft Excel 2007 :  The add-in only works in Excel 2007. SQL Server Analysis Services :  A connection between the add-in in excel and the Analysis services needs to be  created ,a the add-in uses the analysis engine to perform the data mining. 4.  The Data mining add-in :  The add-in can be downloaded for free from the Microsoft website and is essential to perform Data mining using under Excel .
Who can use this add-in This add-in combines the powerful mining engine of SQL Server Analysis Service and the intuitive and user –friendly interface of Microsoft Excel . This add-in can be used by any person with the basic knowledge Excel and no prior experience in data mining is necessary.  The add-in can be used to perform data-mining using a few clicks and the add-in employs advanced mining algorithm and also eliminate the difficult task of configuring the SQL server . For those with past experience in data mining, the add-in could be used to perform very complex and accurate data mining with ease.
Who can use this add-in This Add-in can be used by  – SME business managers . Financial officers . Supermarkets managers. Researchers with a non-computer background. Students. Colleges or schools . Individuals.
The Add-in Please select the following package to be installed in order to use the plugin.
The Add-in-How to start To start using the plugin it is necessary that we establish the connection between the SQL Server Analysis Services and the Excel add-in in order to mine data. This can be done by running the SQL Server Analysis Services (either on the present system or remote server) and then use the Connection tool in the add-in to establish connection.(Use ‘localhost’ as server if using the local system).
The add-in in Excel On Installing the add-in you can see a new tab “DATA MINING” on the excel ribbon. Click on it to expand the tab. The ribbon contains four important partitions, Data preparation. Data modeling. Accuracy and Validation. Connection. We will see in brief how to use these options.
Data Preparation This block deals with preparing the data for mining, converting it to the proper format.  As the name suggests this block deals with preparing the data for mining, converting it to the proper format. The data preparation is the most important part of the data mining process as data can only be analyzed if it is structured in a proper format if accurate reports are our goal. This is done by the three tools provided for this purpose for this purpose: Explore Data : This tool helps us to create a histogram for any column in the table.  Clean Data  : Using this tool we can specify maximum and minimum values for data that we require in particular column. Partition Data : Using this tool  we can create random partitions of required ratios to be used as different sets of data sets for training and testing the mining models.
Data Preparation- Explore Data This tool uses a given column from the table and plots histogram .The histogram provides us insight on the distribution of data and the occurrence of a set of values enabling us to explore which discrete value of group of values dominate our data set. How to use: We have to select the data set (excel table) and then the choose the column in the table  which we wish to explore and click NEXT. What is the result: We will get a histogram of the data values contained in the column we selected. We may choose to view the histogram as numeric or discrete(if the column contains discrete values )
Data Preparation- Explore Data Histogram as Numeric Here we select the Income column to be explored. Histogram as Discrete Here we have used the tool to explore the Income column of the data set. We can see that maximum of the customers have income between the range of  30000 to 50000  and very few people have income in the range 150000-170000, so that we may market our product accordingly. If required we can add this data as a column in our table
Data Preparation-Clean Data OUTLIERS: This tool helps to identify outlying values or rare values that exist beyond a give value or below it within the table which may be exceptions thus making the table data inconsistent. After detecting outliers we may choose to change their values to average or null. How to use : We have to select the data set (excel table) and then the choose the column in the table  which we wish to remove the outliers and click NEXT. What is the result : We will get a histogram with a ‘max’ and ‘min’ level which we can set as the level which we wish the data should not be below(min) or above (max) and then delete or set the values of such entries to NULL or other desired values thus eliminating rare (outlying) values from the column and making it more consistent. We may specify where to put the cleaned data.
Data Preparation-Clean Data( outliers ) Here we select the income column to find outliers In the histogram we may chose Min as ‘27580’ and Max as ‘144500’
Data Preparation-Clean Data( outliers ) Instead of Min and Max we may also choose to set a minimum count for a particular value. Here we may choose any of the above actions to clean our data.
Data Preparation-Clean Data( re-label ) This tool helps us identify all the unique values that exist in a column .It also allow us to set new labels to these unique values. For example, in the Gender column we have “Male “ and “Female” but want it to be denoted by “M” and “F” we may re-label it using this tools. How to use : We have to select the data set (excel table) and then the choose the column in the table  which we wish to rename /re-label and click NEXT. What is the result : We will get a list of all discrete labels and we can choose to combine labels or rename the labels that are not meaningful or also use it to change the label format as described above (Male to M).
Data Preparation-Clean Data( re-label ) Here we may choose to change 1,2… to one, two etc. We can see how 1,2,3.. Have been re-labeled as one, two ..respectively..
Data Preparation-Partition Data This tools helps us partition data into two parts(one for training and one for testing) or different blocks which are discrete or overlapping and then analyze each one and decide on the most accurate conclusion .The three types of partitions are. How to use : We have to select the data set (excel table) which you wish to partition. We may choose any one of the below types of partition to be created. Training and Testing set. Random Partition. Oversampling. What is the result : We get two data sets  created in the existing data structure.
Data Preparation-Partition Data  ( testing and training sets ) Training and Testing : Based on given ratios the tool divides the data set into two random partitions, the “Training set” and the “Testing set”. The training set will be used to create a mining model and based on it this model will be applied on the testing set to test the accuracy of the model generated using Accuracy and Validation  tools. We can set the ratio of the % distribution of training set and testing set. This is the training set. (60%) This is the testing set(40%)
Data Preparation-Partition Data ( Random Sampling ) Suppose we contain 1000 records in a data set and wish to analyze a percentage or number of rows, we can this tool to either partition a subset of rows we quantify  or based on percentage it will calculate the number of rows to partition. For example we may specify 20 rows of 1000 rows to be made a partition or 15% (150) rows as a partition. Note that the rows contained in the partition re randomly selected from the entire table and every record has an equal probability of ending in the portioned set. This partition will be copied on a new worksheet. Here we have selected 70% data to be split to a new worksheet
Data Preparation-Partition Data ( Oversampling ) In oversampling we can create a partition that contains a balance of a particular column For example we might select to have 40%unmarried and 60% married people in our partition. Here we select a partition of 30 rows containing randomly selected people in a ratio of 30% married and rest single.
Data Modeling This part of tools is the actual tools that will perform the data mining. This provides tools that can provide us with various data mining models using complex algorithms in built in SQL Server without the hassle of configuring the server. It also has options that can be used to configure our model further or select a desired data mining algorithm Sr.no Tool name Mining Algorithm used 1. Classify Microsoft Decision Trees 2. Estimate Microsoft Decision Trees 3. Clusters Microsoft  Clustering 4. Associate Microsoft  Association Rules 5. Forecast Microsoft  Time Series
Data Modeling-Classify This tool allows us to build a decision tree using the data that is present in your worksheet. A decision tree is a model that extracts patterns that predict individual values of one column based on other columns. We can choose the column whose value has to be predicted and also choose the columns that have to be used during classification. How to use : We have to choose the column of which we wish to build a decision tree (classification model) and also select the input columns(the columns based on which the model will be built). What is the result : We will get a classification model of the select column.
Data Modeling-Classify Here we can choose to use a temporary model or a persistent model during the analysis. It must be noted that unchecking “Use temporary model” means selecting to use persistent model that causes all current temporary models created by SQL Server Analysis Services to be destroyed The “Drill Through” option specifies whether the training data developed during analysis must be saved and associated with the data patterns formed from the data set.   Here we can see how a decision tree structure has been built using the table data which can help us deduce patterns in the data. It utilizes the Microsoft Decision Tree Algorithm.
Data Modeling - Estimate This tool creates an estimation model using the data available in the table. The patterns created while developing the estimate model is used to predict continuous values on one column based on the values of other column. Using these results, we can understand how value of one column is being affected by the values of other column and the factors contributing to the change in its values How to use it : We have to select the target column(the column whose estimation model has to be built) and the input columns. What do we get : We will get a Estimation model of the target column .
Data Modeling - Estimate Here we study how various factors affect the monthly income of an individual/customer
Data Modeling - Cluster This tool helps us create clustering model which can be used to detect which group of columns share similar characteristics. This tool can be used to mine data of all kinds. How to use it : We have to select the columns which have to be used to build the Clustering model. What do we get : We will get a Clustering model of the selected columns.
Data Modeling - Cluster Here we can see various clusters connected to each other. The base color specifies the percentage value of the selected .Here we have chosen Education in “Shading variable”. Hence Cluster two is dark as it has a 52% of customers as bachelors while cluster 6 has just 1% bachelors and hence white.
Data Modeling - Associate This tools creates Association Rules based model that uses data from the excel table. This model analyzes the data to detect items that appear together in transaction and is most suitable for giving recommendations to buy other related products based on the products they have brought and is mostly used in online shopping and market basket analysis. It employs the Microsoft Association Algorithm and finds patterns (associations) between different items of the data set. The data provided to the Associate must have its Identifier attribute (ID) sorted and the associate must be informed which I the ID column and the columns containing he items for transaction   How to use it : We have to select the column that identifies the transaction and also the column that identifies the items contained in the transaction. NOTE  :  The transaction data must be I a one-to-many type relations and the column identifying the transactions must be arranged in ascending order. What do we get : We will get a Association model of the selected columns.
Data Modeling - Associate This figure shows % association between the various items in the Item Sets This Dependency network shows which item is dependent on which other item/items. For example the customers who bought Bikes also bought Fenders (see above figure for association percentages).
Data Modeling - Forecast This tool is used to create a Forecasting model that uses data available in the excel worksheet to analyze and predicts the future values with continuous data. It detects patterns in the data and uses this patterns to forecast values. It requires us to specify the column that provides the time stamp if any (like dates, time). It employs Microsoft Time Series Algorithm to form predictive patterns and is usually used in product sales analysis, stock market analysis, company growth etc How to use it : We have to select the columns to be analyzed and also specify the column containing the timestamp if available. What do we get : We will get a Forecasting model of the selected columns
Data Modeling - Forecast Here we can see that the Forecast tool has plot a graph that predicts the sales in 11 th  month of 2004 by mining sales data of the previous months
Data Modeling – Advanced This option contains two tools: 1.Create mining model : This option allows us to create new mining models using the data available in excel tables and it gives us an option to choose the mining algorithm to be used for the creation of the new mining model. The various algorithms available to be used for data mining are Microsoft Decision trees Microsoft Clustering Microsoft  Linear Regression Microsoft Logistic Regression Microsoft Naïve Bayes.  Microsoft Neural Networks  Microsoft sequence Clustering. Microsoft Time Sequence.
Data Modeling – Advanced We can select any algorithm to create the mining model.
Data Modeling – Advanced We can use any of the previously developed models for adding to the structure. This concludes the Data modeling part. 2. Add model to structure :  This tool is used to add an already developed mining model to a structure and create a new mining model for that structure.
Accuracy and Validation In this part, we can find tools that can be used to test and validate our mining models. It is important that we know how well the mining models developed by us work with real world data, and by checking their accuracy we can validate the mining models. How to use it : Select the Excel Table on which we wish to test the accuracy and validate the previously created mining models and then choosing one of the 3 tools we may apply any of these models and test them. What do we get : We will get an accuracy chart of the related to the selected mining model.
Accuracy and Validation-Accuracy Chart This tool helps us to apply previously developed mining model on a set of real world data so that we can see how well it performs. The mining model chosen must be quite similar to the data to be tested. The above accuracy result shows comparison between the ideal and predicted value.
Accuracy and Validation-Accuracy Chart This tools applies the previously mined model to a new data set and compares the values predicted by the mining model and compares it with the actual model and then gives a result in terms of percentage how correctly the model predicted and also how much wrong values it predicted. In this above Classification Matrix, we can see that the mining model when applied to the new data set predicted about 69.20% of the values correctly. If attained values are less than the expected accuracy values, and then we must train the mining model better.
Accuracy and Validation- Profit Chart This tools when used to apply a previously developed mining model to a new set of data plots a graph of the expected profit that would occur if the mining model was used i.e. the increase of conversion of potential customers who have been approached who become customers. The graph generally raises high until a point but then begins to fall as the number of customers starts increasing Here we can see that the profit would first increase i.e. If only 1-15% of the customers that are predicted by the mining model are approached; chance that they respond is high. But this profit begins to reduce as the number of customers begins to increase.
Model Usage It contains two options: 1.Browse: This tool can be used to browse the various mining models that we have created. 2.Query: The Query Model tool lets you use the existing mining models to make predictions using the data in an Excel table. This process of applying new data to an existing model to predict trends is called a prediction query
This opens a wizard that helps us manage the previously developed models by doing required changes to the mining models. Renaming  a mining model or structure Deleting  a mining model or structure Clearing a mining model or structure Processing  a mining structure, using either new or existing data Exporting or import a mining model or structure. Management The Various options in the Mining Models management tool.
Default Local host : Used to configure the connection of Excel to SQL Server analysis Services. Trace  : Used to view the log of all the data sent to the QL Server for analysis during mining model creation. Connection
Visit more self help tutorials Pick a tutorial of your choice and browse through it at your own pace. The tutorials section is free, self-guiding and will not involve any additional support. Visit us at www.dataminingtools.net

More Related Content

PDF
Dimensionality Reduction
PPTX
CART – Classification & Regression Trees
PPTX
Improve Your Regression with CART and RandomForests
PDF
CART: Not only Classification and Regression Trees
PPT
Excel Datamining Addin Beginner
PDF
Data Science - Part V - Decision Trees & Random Forests
PPTX
Data Reduction
PDF
Matlab for marketing people
Dimensionality Reduction
CART – Classification & Regression Trees
Improve Your Regression with CART and RandomForests
CART: Not only Classification and Regression Trees
Excel Datamining Addin Beginner
Data Science - Part V - Decision Trees & Random Forests
Data Reduction
Matlab for marketing people

What's hot (16)

PDF
Classification and regression trees (cart)
PPTX
Data Reduction Stratergies
PPT
1.7 data reduction
DOCX
Data Analytics Using R - Report
PDF
Datascience101presentation4
DOC
Open06
PPTX
Data reduction
PPTX
Dimension reduction(jiten01)
PDF
Using microsoft excel for weibull analysis
PPT
Data Mining
PDF
What makes a good decision tree?
PDF
IRJET- Performance Evaluation of Various Classification Algorithms
PPTX
Random forest
PPT
Data preprocessing ng
PPTX
Heart disease classification
PPT
Data preparation
Classification and regression trees (cart)
Data Reduction Stratergies
1.7 data reduction
Data Analytics Using R - Report
Datascience101presentation4
Open06
Data reduction
Dimension reduction(jiten01)
Using microsoft excel for weibull analysis
Data Mining
What makes a good decision tree?
IRJET- Performance Evaluation of Various Classification Algorithms
Random forest
Data preprocessing ng
Heart disease classification
Data preparation
Ad

Viewers also liked (20)

PPTX
Association Analysis
PDF
Machine Learning and Data Mining: 14 Evaluation and Credibility
PDF
Machine Learning and Data Mining: 10 Introduction to Classification
ODP
Presentazione oroblu
PDF
Ontwikkeling In Eigen Handen Nl Web
PPTX
MS SQL SERVER: Microsoft sequence clustering and association rules
XLSX
PPTX
LISP: Declarations In Lisp
PPTX
Bernoullis Random Variables And Binomial Distribution
PPTX
Classification Continued
PPTX
Txomin Hartz Txikia
PPTX
SQL Server: BI
PPT
Traffic Skills, Parent & Kids Intro
PPTX
Art, Culture, and Technology
PPTX
Data Applied:Decision Trees
PPT
Excel Datamining Addin Intermediate
PPTX
Retrieving Data From A Database
PPTX
DataKraft - Powerful No-Coding Platform for Business Applications
PPTX
LISP: Errors In Lisp
PDF
Huidige status van de testtaal TTCN-3
Association Analysis
Machine Learning and Data Mining: 14 Evaluation and Credibility
Machine Learning and Data Mining: 10 Introduction to Classification
Presentazione oroblu
Ontwikkeling In Eigen Handen Nl Web
MS SQL SERVER: Microsoft sequence clustering and association rules
LISP: Declarations In Lisp
Bernoullis Random Variables And Binomial Distribution
Classification Continued
Txomin Hartz Txikia
SQL Server: BI
Traffic Skills, Parent & Kids Intro
Art, Culture, and Technology
Data Applied:Decision Trees
Excel Datamining Addin Intermediate
Retrieving Data From A Database
DataKraft - Powerful No-Coding Platform for Business Applications
LISP: Errors In Lisp
Huidige status van de testtaal TTCN-3
Ad

Similar to Excel Datamining Addin Advanced (20)

PPT
Excel Datamining Addin Beginner
PPT
Excel Datamining Addin Intermediate
PPTX
XL-MINER:Data Utilities
PPTX
XL-MINER: Data Utilities
DOC
Data Mining: Data Preprocessing
PDF
06 Excel.pdf
PDF
Data Mining with Excel 2010 and PowerPivot 201106
PPTX
MS SQL SERVER: Using the data mining tools
PPTX
MS SQL SERVER: Using the data mining tools
PPT
Datapreprocess
PPTX
Mine craft:
PPTX
Data Preprocessing&tools
PPTX
Preprocessing_exploring_and_Visualization.pptx
PDF
Statistics and Data Mining
PPT
Data preperation
PPT
Data preparation
PPT
Data preparation
PPT
Data preparation
PPT
Data preperation
PPT
Data preperation
Excel Datamining Addin Beginner
Excel Datamining Addin Intermediate
XL-MINER:Data Utilities
XL-MINER: Data Utilities
Data Mining: Data Preprocessing
06 Excel.pdf
Data Mining with Excel 2010 and PowerPivot 201106
MS SQL SERVER: Using the data mining tools
Datapreprocess
Mine craft:
Data Preprocessing&tools
Preprocessing_exploring_and_Visualization.pptx
Statistics and Data Mining
Data preperation
Data preparation
Data preparation
Data preparation
Data preperation
Data preperation

More from DataminingTools Inc (20)

PPTX
Terminology Machine Learning
PPTX
Techniques Machine Learning
PPTX
Machine learning Introduction
PPTX
Areas of machine leanring
PPTX
AI: Planning and AI
PPTX
AI: Logic in AI 2
PPTX
AI: Logic in AI
PPTX
AI: Learning in AI 2
PPTX
AI: Learning in AI
PPTX
AI: Introduction to artificial intelligence
PPTX
AI: Belief Networks
PPTX
AI: AI & Searching
PPTX
AI: AI & Problem Solving
PPTX
Data Mining: Text and web mining
PPTX
Data Mining: Outlier analysis
PPTX
Data Mining: Mining stream time series and sequence data
PPTX
Data Mining: Mining ,associations, and correlations
PPTX
Data Mining: Graph mining and social network analysis
PPTX
Data warehouse and olap technology
PPTX
Data Mining: Data processing
Terminology Machine Learning
Techniques Machine Learning
Machine learning Introduction
Areas of machine leanring
AI: Planning and AI
AI: Logic in AI 2
AI: Logic in AI
AI: Learning in AI 2
AI: Learning in AI
AI: Introduction to artificial intelligence
AI: Belief Networks
AI: AI & Searching
AI: AI & Problem Solving
Data Mining: Text and web mining
Data Mining: Outlier analysis
Data Mining: Mining stream time series and sequence data
Data Mining: Mining ,associations, and correlations
Data Mining: Graph mining and social network analysis
Data warehouse and olap technology
Data Mining: Data processing

Recently uploaded (20)

PDF
Saundersa Comprehensive Review for the NCLEX-RN Examination.pdf
PPTX
Pharma ospi slides which help in ospi learning
PDF
VCE English Exam - Section C Student Revision Booklet
PPTX
Cell Structure & Organelles in detailed.
PDF
2.FourierTransform-ShortQuestionswithAnswers.pdf
PPTX
PPT- ENG7_QUARTER1_LESSON1_WEEK1. IMAGERY -DESCRIPTIONS pptx.pptx
PDF
FourierSeries-QuestionsWithAnswers(Part-A).pdf
PPTX
Institutional Correction lecture only . . .
PDF
Basic Mud Logging Guide for educational purpose
PDF
Module 4: Burden of Disease Tutorial Slides S2 2025
PDF
01-Introduction-to-Information-Management.pdf
PDF
102 student loan defaulters named and shamed – Is someone you know on the list?
PDF
BÀI TẬP BỔ TRỢ 4 KỸ NĂNG TIẾNG ANH 9 GLOBAL SUCCESS - CẢ NĂM - BÁM SÁT FORM Đ...
PDF
Supply Chain Operations Speaking Notes -ICLT Program
PPTX
human mycosis Human fungal infections are called human mycosis..pptx
PDF
Physiotherapy_for_Respiratory_and_Cardiac_Problems WEBBER.pdf
PDF
grade 11-chemistry_fetena_net_5883.pdf teacher guide for all student
PDF
RMMM.pdf make it easy to upload and study
PDF
Abdominal Access Techniques with Prof. Dr. R K Mishra
PPTX
1st Inaugural Professorial Lecture held on 19th February 2020 (Governance and...
Saundersa Comprehensive Review for the NCLEX-RN Examination.pdf
Pharma ospi slides which help in ospi learning
VCE English Exam - Section C Student Revision Booklet
Cell Structure & Organelles in detailed.
2.FourierTransform-ShortQuestionswithAnswers.pdf
PPT- ENG7_QUARTER1_LESSON1_WEEK1. IMAGERY -DESCRIPTIONS pptx.pptx
FourierSeries-QuestionsWithAnswers(Part-A).pdf
Institutional Correction lecture only . . .
Basic Mud Logging Guide for educational purpose
Module 4: Burden of Disease Tutorial Slides S2 2025
01-Introduction-to-Information-Management.pdf
102 student loan defaulters named and shamed – Is someone you know on the list?
BÀI TẬP BỔ TRỢ 4 KỸ NĂNG TIẾNG ANH 9 GLOBAL SUCCESS - CẢ NĂM - BÁM SÁT FORM Đ...
Supply Chain Operations Speaking Notes -ICLT Program
human mycosis Human fungal infections are called human mycosis..pptx
Physiotherapy_for_Respiratory_and_Cardiac_Problems WEBBER.pdf
grade 11-chemistry_fetena_net_5883.pdf teacher guide for all student
RMMM.pdf make it easy to upload and study
Abdominal Access Techniques with Prof. Dr. R K Mishra
1st Inaugural Professorial Lecture held on 19th February 2020 (Governance and...

Excel Datamining Addin Advanced

  • 2. What is DATA MINING Data mining (or Knowledge Discovery) refers to the process of analyzing a give data set from different precepts and scenarios in order to discover patterns in the given data set. This information can help reveal the hidden trends about products, customer, market, employees which prove very important while designing new strategies for product marketing, market analysis, increasing revenue or cost cutting, forecasting sales figures or analyze those components that are critical to the success of the company. Data mining has proved its worth in many fields such as business, computers (finding patterns in data required for machine learning, AI), biotechnology (data mining DNA codes to find out how changes in its structure affect human health and immunity to diseases like cancer etc), share market forecasts etc, thus making data mining a rapidly growing field with numerous possibilities and uses. Data mining, though a relatively new term has long been used by large corporations to churn through large data sets to incur conclusions with the help of powerful computers. As computers became faster and more capable, new and more advanced data mining techniques/algorithms have been developed in order to return more precise conclusions.
  • 3. What is the SQL Server Add-in Microsoft has introduced a new and efficient data mining tool ,the “ Microsoft SQL Server 2005 Data Mining Add-Ins for Office 2007 ” putting data mining within the reach of every user or desktop. The add-in provides an easy way to reap the benefits of the data mining by harnessing the sophisticated data mining algorithms of Microsoft SQL Server 2005 Analysis Services within the familiar Microsoft Office environment at every desktop
  • 4. Pre-requisites Microsoft .Net framework 2.0 : The add-in requires the .NET framework capabilities to function under Excel . Microsoft Excel 2007 : The add-in only works in Excel 2007. SQL Server Analysis Services : A connection between the add-in in excel and the Analysis services needs to be created ,a the add-in uses the analysis engine to perform the data mining. 4. The Data mining add-in : The add-in can be downloaded for free from the Microsoft website and is essential to perform Data mining using under Excel .
  • 5. Who can use this add-in This add-in combines the powerful mining engine of SQL Server Analysis Service and the intuitive and user –friendly interface of Microsoft Excel . This add-in can be used by any person with the basic knowledge Excel and no prior experience in data mining is necessary. The add-in can be used to perform data-mining using a few clicks and the add-in employs advanced mining algorithm and also eliminate the difficult task of configuring the SQL server . For those with past experience in data mining, the add-in could be used to perform very complex and accurate data mining with ease.
  • 6. Who can use this add-in This Add-in can be used by – SME business managers . Financial officers . Supermarkets managers. Researchers with a non-computer background. Students. Colleges or schools . Individuals.
  • 7. The Add-in Please select the following package to be installed in order to use the plugin.
  • 8. The Add-in-How to start To start using the plugin it is necessary that we establish the connection between the SQL Server Analysis Services and the Excel add-in in order to mine data. This can be done by running the SQL Server Analysis Services (either on the present system or remote server) and then use the Connection tool in the add-in to establish connection.(Use ‘localhost’ as server if using the local system).
  • 9. The add-in in Excel On Installing the add-in you can see a new tab “DATA MINING” on the excel ribbon. Click on it to expand the tab. The ribbon contains four important partitions, Data preparation. Data modeling. Accuracy and Validation. Connection. We will see in brief how to use these options.
  • 10. Data Preparation This block deals with preparing the data for mining, converting it to the proper format. As the name suggests this block deals with preparing the data for mining, converting it to the proper format. The data preparation is the most important part of the data mining process as data can only be analyzed if it is structured in a proper format if accurate reports are our goal. This is done by the three tools provided for this purpose for this purpose: Explore Data : This tool helps us to create a histogram for any column in the table. Clean Data : Using this tool we can specify maximum and minimum values for data that we require in particular column. Partition Data : Using this tool we can create random partitions of required ratios to be used as different sets of data sets for training and testing the mining models.
  • 11. Data Preparation- Explore Data This tool uses a given column from the table and plots histogram .The histogram provides us insight on the distribution of data and the occurrence of a set of values enabling us to explore which discrete value of group of values dominate our data set. How to use: We have to select the data set (excel table) and then the choose the column in the table which we wish to explore and click NEXT. What is the result: We will get a histogram of the data values contained in the column we selected. We may choose to view the histogram as numeric or discrete(if the column contains discrete values )
  • 12. Data Preparation- Explore Data Histogram as Numeric Here we select the Income column to be explored. Histogram as Discrete Here we have used the tool to explore the Income column of the data set. We can see that maximum of the customers have income between the range of 30000 to 50000 and very few people have income in the range 150000-170000, so that we may market our product accordingly. If required we can add this data as a column in our table
  • 13. Data Preparation-Clean Data OUTLIERS: This tool helps to identify outlying values or rare values that exist beyond a give value or below it within the table which may be exceptions thus making the table data inconsistent. After detecting outliers we may choose to change their values to average or null. How to use : We have to select the data set (excel table) and then the choose the column in the table which we wish to remove the outliers and click NEXT. What is the result : We will get a histogram with a ‘max’ and ‘min’ level which we can set as the level which we wish the data should not be below(min) or above (max) and then delete or set the values of such entries to NULL or other desired values thus eliminating rare (outlying) values from the column and making it more consistent. We may specify where to put the cleaned data.
  • 14. Data Preparation-Clean Data( outliers ) Here we select the income column to find outliers In the histogram we may chose Min as ‘27580’ and Max as ‘144500’
  • 15. Data Preparation-Clean Data( outliers ) Instead of Min and Max we may also choose to set a minimum count for a particular value. Here we may choose any of the above actions to clean our data.
  • 16. Data Preparation-Clean Data( re-label ) This tool helps us identify all the unique values that exist in a column .It also allow us to set new labels to these unique values. For example, in the Gender column we have “Male “ and “Female” but want it to be denoted by “M” and “F” we may re-label it using this tools. How to use : We have to select the data set (excel table) and then the choose the column in the table which we wish to rename /re-label and click NEXT. What is the result : We will get a list of all discrete labels and we can choose to combine labels or rename the labels that are not meaningful or also use it to change the label format as described above (Male to M).
  • 17. Data Preparation-Clean Data( re-label ) Here we may choose to change 1,2… to one, two etc. We can see how 1,2,3.. Have been re-labeled as one, two ..respectively..
  • 18. Data Preparation-Partition Data This tools helps us partition data into two parts(one for training and one for testing) or different blocks which are discrete or overlapping and then analyze each one and decide on the most accurate conclusion .The three types of partitions are. How to use : We have to select the data set (excel table) which you wish to partition. We may choose any one of the below types of partition to be created. Training and Testing set. Random Partition. Oversampling. What is the result : We get two data sets created in the existing data structure.
  • 19. Data Preparation-Partition Data ( testing and training sets ) Training and Testing : Based on given ratios the tool divides the data set into two random partitions, the “Training set” and the “Testing set”. The training set will be used to create a mining model and based on it this model will be applied on the testing set to test the accuracy of the model generated using Accuracy and Validation tools. We can set the ratio of the % distribution of training set and testing set. This is the training set. (60%) This is the testing set(40%)
  • 20. Data Preparation-Partition Data ( Random Sampling ) Suppose we contain 1000 records in a data set and wish to analyze a percentage or number of rows, we can this tool to either partition a subset of rows we quantify or based on percentage it will calculate the number of rows to partition. For example we may specify 20 rows of 1000 rows to be made a partition or 15% (150) rows as a partition. Note that the rows contained in the partition re randomly selected from the entire table and every record has an equal probability of ending in the portioned set. This partition will be copied on a new worksheet. Here we have selected 70% data to be split to a new worksheet
  • 21. Data Preparation-Partition Data ( Oversampling ) In oversampling we can create a partition that contains a balance of a particular column For example we might select to have 40%unmarried and 60% married people in our partition. Here we select a partition of 30 rows containing randomly selected people in a ratio of 30% married and rest single.
  • 22. Data Modeling This part of tools is the actual tools that will perform the data mining. This provides tools that can provide us with various data mining models using complex algorithms in built in SQL Server without the hassle of configuring the server. It also has options that can be used to configure our model further or select a desired data mining algorithm Sr.no Tool name Mining Algorithm used 1. Classify Microsoft Decision Trees 2. Estimate Microsoft Decision Trees 3. Clusters Microsoft Clustering 4. Associate Microsoft Association Rules 5. Forecast Microsoft Time Series
  • 23. Data Modeling-Classify This tool allows us to build a decision tree using the data that is present in your worksheet. A decision tree is a model that extracts patterns that predict individual values of one column based on other columns. We can choose the column whose value has to be predicted and also choose the columns that have to be used during classification. How to use : We have to choose the column of which we wish to build a decision tree (classification model) and also select the input columns(the columns based on which the model will be built). What is the result : We will get a classification model of the select column.
  • 24. Data Modeling-Classify Here we can choose to use a temporary model or a persistent model during the analysis. It must be noted that unchecking “Use temporary model” means selecting to use persistent model that causes all current temporary models created by SQL Server Analysis Services to be destroyed The “Drill Through” option specifies whether the training data developed during analysis must be saved and associated with the data patterns formed from the data set.   Here we can see how a decision tree structure has been built using the table data which can help us deduce patterns in the data. It utilizes the Microsoft Decision Tree Algorithm.
  • 25. Data Modeling - Estimate This tool creates an estimation model using the data available in the table. The patterns created while developing the estimate model is used to predict continuous values on one column based on the values of other column. Using these results, we can understand how value of one column is being affected by the values of other column and the factors contributing to the change in its values How to use it : We have to select the target column(the column whose estimation model has to be built) and the input columns. What do we get : We will get a Estimation model of the target column .
  • 26. Data Modeling - Estimate Here we study how various factors affect the monthly income of an individual/customer
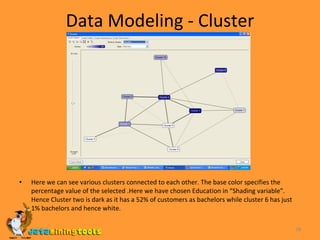
  • 27. Data Modeling - Cluster This tool helps us create clustering model which can be used to detect which group of columns share similar characteristics. This tool can be used to mine data of all kinds. How to use it : We have to select the columns which have to be used to build the Clustering model. What do we get : We will get a Clustering model of the selected columns.
  • 28. Data Modeling - Cluster Here we can see various clusters connected to each other. The base color specifies the percentage value of the selected .Here we have chosen Education in “Shading variable”. Hence Cluster two is dark as it has a 52% of customers as bachelors while cluster 6 has just 1% bachelors and hence white.
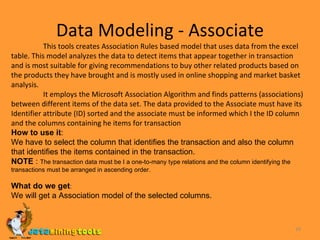
  • 29. Data Modeling - Associate This tools creates Association Rules based model that uses data from the excel table. This model analyzes the data to detect items that appear together in transaction and is most suitable for giving recommendations to buy other related products based on the products they have brought and is mostly used in online shopping and market basket analysis. It employs the Microsoft Association Algorithm and finds patterns (associations) between different items of the data set. The data provided to the Associate must have its Identifier attribute (ID) sorted and the associate must be informed which I the ID column and the columns containing he items for transaction How to use it : We have to select the column that identifies the transaction and also the column that identifies the items contained in the transaction. NOTE : The transaction data must be I a one-to-many type relations and the column identifying the transactions must be arranged in ascending order. What do we get : We will get a Association model of the selected columns.
  • 30. Data Modeling - Associate This figure shows % association between the various items in the Item Sets This Dependency network shows which item is dependent on which other item/items. For example the customers who bought Bikes also bought Fenders (see above figure for association percentages).
  • 31. Data Modeling - Forecast This tool is used to create a Forecasting model that uses data available in the excel worksheet to analyze and predicts the future values with continuous data. It detects patterns in the data and uses this patterns to forecast values. It requires us to specify the column that provides the time stamp if any (like dates, time). It employs Microsoft Time Series Algorithm to form predictive patterns and is usually used in product sales analysis, stock market analysis, company growth etc How to use it : We have to select the columns to be analyzed and also specify the column containing the timestamp if available. What do we get : We will get a Forecasting model of the selected columns
  • 32. Data Modeling - Forecast Here we can see that the Forecast tool has plot a graph that predicts the sales in 11 th month of 2004 by mining sales data of the previous months
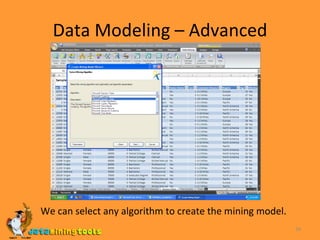
  • 33. Data Modeling – Advanced This option contains two tools: 1.Create mining model : This option allows us to create new mining models using the data available in excel tables and it gives us an option to choose the mining algorithm to be used for the creation of the new mining model. The various algorithms available to be used for data mining are Microsoft Decision trees Microsoft Clustering Microsoft Linear Regression Microsoft Logistic Regression Microsoft Naïve Bayes. Microsoft Neural Networks Microsoft sequence Clustering. Microsoft Time Sequence.
  • 34. Data Modeling – Advanced We can select any algorithm to create the mining model.
  • 35. Data Modeling – Advanced We can use any of the previously developed models for adding to the structure. This concludes the Data modeling part. 2. Add model to structure : This tool is used to add an already developed mining model to a structure and create a new mining model for that structure.
  • 36. Accuracy and Validation In this part, we can find tools that can be used to test and validate our mining models. It is important that we know how well the mining models developed by us work with real world data, and by checking their accuracy we can validate the mining models. How to use it : Select the Excel Table on which we wish to test the accuracy and validate the previously created mining models and then choosing one of the 3 tools we may apply any of these models and test them. What do we get : We will get an accuracy chart of the related to the selected mining model.
  • 37. Accuracy and Validation-Accuracy Chart This tool helps us to apply previously developed mining model on a set of real world data so that we can see how well it performs. The mining model chosen must be quite similar to the data to be tested. The above accuracy result shows comparison between the ideal and predicted value.
  • 38. Accuracy and Validation-Accuracy Chart This tools applies the previously mined model to a new data set and compares the values predicted by the mining model and compares it with the actual model and then gives a result in terms of percentage how correctly the model predicted and also how much wrong values it predicted. In this above Classification Matrix, we can see that the mining model when applied to the new data set predicted about 69.20% of the values correctly. If attained values are less than the expected accuracy values, and then we must train the mining model better.
  • 39. Accuracy and Validation- Profit Chart This tools when used to apply a previously developed mining model to a new set of data plots a graph of the expected profit that would occur if the mining model was used i.e. the increase of conversion of potential customers who have been approached who become customers. The graph generally raises high until a point but then begins to fall as the number of customers starts increasing Here we can see that the profit would first increase i.e. If only 1-15% of the customers that are predicted by the mining model are approached; chance that they respond is high. But this profit begins to reduce as the number of customers begins to increase.
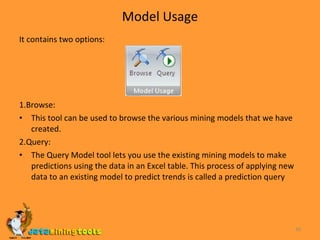
  • 40. Model Usage It contains two options: 1.Browse: This tool can be used to browse the various mining models that we have created. 2.Query: The Query Model tool lets you use the existing mining models to make predictions using the data in an Excel table. This process of applying new data to an existing model to predict trends is called a prediction query
  • 41. This opens a wizard that helps us manage the previously developed models by doing required changes to the mining models. Renaming a mining model or structure Deleting a mining model or structure Clearing a mining model or structure Processing a mining structure, using either new or existing data Exporting or import a mining model or structure. Management The Various options in the Mining Models management tool.
  • 42. Default Local host : Used to configure the connection of Excel to SQL Server analysis Services. Trace : Used to view the log of all the data sent to the QL Server for analysis during mining model creation. Connection
  • 43. Visit more self help tutorials Pick a tutorial of your choice and browse through it at your own pace. The tutorials section is free, self-guiding and will not involve any additional support. Visit us at www.dataminingtools.net