SlideShare a Scribd company logo
FOURIER-TRANSFORM INFRARED
(FTIR) AND RAMAN SPECTROSCOPY
An Overview of Techniques and
Applications
Presented by: Natheir Hasan
Date: 6th
November 2024
INTRODUCTION TO
SPECTROSCOPY
WHAT IS SPECTROSCOPY?
Spectroscopy is the scientific study of the interaction between
electromagnetic radiation (light) and matter. It encompasses various
techniques used to analyze the composition and structure of substances by
examining the light they absorb, emit, or scatter.
LIGHT-MATTER INTERACTION
Light and matter interact with each other in various ways. Matter can
absorb light (take it in); emit light (give it off); transmit light (allow it to
pass through); reflect light (cause it to bounce off); and refract light (cause
it to change speed and direction).
IMPORTANCE OF SPECTROSCOPY IN
CHEMICAL ANALYSIS:
• It does not alter or damage the sample being analyzed.
Non-Destructive Analysis:
• Provides detailed information about the molecular structure and
composition of substances.
Detailed Molecular Information:
• Pharmaceuticals, Environmental Science, Materials Science
Wide Range of Applications:
TYPES OF SPECTROSCOPY
Emission
spectroscopy
• Fluorimetry
• Flame
photometry
• Atomic Emission
Spectroscopy
Absorption
Spectroscopy
• UV-Visible
Spectroscopy
• IR Spectroscopy
• Nuclear Magnetic
Resonance
Spectroscopy
• Atomic
Absorption
Spectroscopy
Scattering
Spectroscopy
• Raman
Spectroscopy
ELECTROMAGNETIC SPECTRUM
INFRARED (IR) SPECTROSCOPY
DEFINITION OF IR SPECTROSCOPY
IR Spectroscopy (Infrared Spectroscopy) is an analytical technique used to
identify and study chemicals by measuring how molecules absorb infrared
light. This absorption causes molecular vibrations, such as stretching and
bending of bonds, which are unique to different functional groups.
PRINCIPLE
• When a molecule absorbs IR radiation, the energy of the radiation matches
the energy difference between the molecule's vibrational states.
• Only vibrational transitions that lead to a change in the dipole moment of the
molecule will absorb IR light (making polar bonds important).
• The absorption of IR radiation occurs at specific wavelengths
(wavenumbers), corresponding to the natural vibrational frequencies of the
bonds in the molecule.
PRINCIPLE
• Nonpolar molecules may not show significant IR absorption unless a dipole
moment is induced during vibration.
• Mid-IR region ( cm) is where most fundamental vibrations occur and is the most
commonly used region in IR spectroscopy.
IR REGION IN THE ELECTROMAGNETIC
SPECTRUM
VIBRATIONAL MODES
Radial (Stretching) Symmetric stretching Antisymmetric stretching
Latitudinal (In
plane bending)
Scissoring Rocking
Longitudinal (Out
of plane bending)
Wagging Twisting
VIBRATIONAL MODES
• For non-linear molecules with N atoms, the number of vibrational modes is given
by:
The is the total degrees of freedom of the molecule and the translational 3 degrees of
freedom, and 3 rotational are then subtracted which leaves 3N – 6 vibrational modes.
• For linear molecules, there is one less rotational degree of freedom and the number
of vibrational modes is therefore:
QUANTUM MECHANICAL BASIS
• Each vibrational mode corresponds to a specific vibrational energy level in the
molecule.
• These energy levels are quantized, meaning the molecule can only vibrate at
specific frequencies.
• Only vibrations that cause a change in the dipole moment of the molecule are IR-
active. Therefore, not all vibrations will result in IR absorption.
DISPERSIVE INFRARED SPECTROSCOPY
Traditional IR spectroscopy begins by shining IR
light onto a diffraction grating, which separates
light by wavelength. Different wavelengths exit
the grating at slightly different angles due to the
relationship between the angle of exit and the
wavelength of light. This technique is called
dispersive infrared spectroscopy because it
disperses the wavelengths in space.
DISPERSIVE INFRARED SPECTROSCOPY
After the IR beam is separated by
wavelength, it passes through a slit
to create a monochromatic beam
directed at the sample for
absorbance measurement.
The diffraction grating angle is then
adjusted to isolate other
wavelengths, repeating the process
until all absorbances are collected,
which allows for the plotting of the
IR spectrum.
DISPERSIVE INFRARED SPECTROSCOPY
The issue with this dispersive design
was the long time it took to obtain
an entire spectrum due to the
sequential detection.
IR SPECTRUM
THE FINGERPRINT REGION
• Complex Absorptions: The region below 1500 cm is known as the
fingerprint region. It contains a dense series of absorption peaks that are
unique to the molecule.
• This region arises from bending vibrations, complex stretching modes, and
out-of-plane vibrations.
• Identification: The fingerprint region is highly specific to each molecule
and can be used to match a sample against known reference spectra for
compound identification.
• Bending vibrations dominate.
THE DIAGNOSTIC REGION
• The diagnostic region in IR spectroscopy spans from 4000 cm to 1500 cm.
• It is called the diagnostic region because it contains well-defined absorption
peaks that are easily correlated with specific functional groups.
• In contrast to the fingerprint region, peaks in this region are less crowded
and easier to interpret, making it ideal for identifying functional groups.
• Stretching vibrations dominate.
KEY FUNCTIONAL GROUPS AND THEIR IR
ABSORPTION RANGES
• Each functional group in a molecule absorbs IR
radiation at characteristic wavenumbers due to its
unique bond vibrations.
• The position and intensity of these absorption bands
allow for the identification of specific groups in a
molecule.
FOURIER-TRANSFORM INFRARED
(FTIR) SPECTROSCOPY
DEFINITION
• Fourier Transform Infrared Spectroscopy (FTIR) is an advanced analytical
technique that measures the infrared absorption of a sample, providing
insights into its molecular composition and structure.
• Unlike traditional infrared spectroscopy, which typically employs
monochromatic light sources, FTIR utilizes a broadband infrared source. This
means that FTIR simultaneously collects data across a wide range of
wavelengths (or frequencies) instead of measuring one wavelength at a time.
FOURIER-TRANSFORM IR SPECTROMETER
1. IR Source:
Emits a broad spectrum of infrared
radiation (4000 cm 400 cm) that interacts
with the sample.
Types of Sources:
2. Globar
3. Tungsten-Halogen lamp
FOURIER-TRANSFORM IR SPECTROMETER
2. Beam-Splitter:
Divides the incoming infrared
beam into two paths: one
directed toward a fixed mirror
and the other toward a moving
mirror. It is typically made from
materials like or germanium.
FOURIER-TRANSFORM IR SPECTROMETER
3. Fixed Mirror:
Reflects one of the beams back
toward the beam splitter.
4. Moving Mirror:
Adjusts the path length of the
second beam, causing changes in
phase that create interference
patterns.
FOURIER-TRANSFORM IR SPECTROMETER
• Constructive interference occurs when the peaks of the waves align, reinforcing
each other and increasing the signal intensity at certain wavelengths.
FOURIER-TRANSFORM IR SPECTROMETER
• Destructive interference happens when the peak of one wave aligns with the
trough of another, canceling each other out, reducing the signal at those
wavelengths.
FOURIER-TRANSFORM IR SPECTROMETER
• This pattern of alternating
constructive and destructive
interference creates a signal called
an interferogram.
• The interferogram contains
information about all wavelengths
of light that passed through the
sample and is later converted into a
spectrum using Fourier Transform.
FOURIER-TRANSFORM IR SPECTROMETER
5. Sample Holders
• Solid Samples: Can be analyzed
directly or prepared as thin films, often
using techniques like KBr pellets.
• Liquid Cells: Typically made of
materials like KBr.
• Gas Cells: Designed with long path
lengths and reflective mirrors, used for
gaseous samples.
FOURIER-TRANSFORM IR SPECTROMETER
6. Detector:
Converts the infrared light that
has passed through or reflected
from the sample into an electrical
signal for analysis.
Mercury Cadmium Telluride
(MCT): A semiconductor detector
that is sensitive to a wide range of
IR wavelengths.
FOURIER-TRANSFORM IR SPECTROMETER
7. Inteferogram:
A graph showing the raw signal
from the detector.
FOURIER-TRANSFORM IR SPECTROMETER
7. Inteferogram:
An interferogram is a graph showing
the raw signal from the FTIR detector.
The x-axis represents the path
difference (retardation) between light
beams, and the y-axis shows the
intensity of transmitted light. It
displays intensity variations due to
light interference and contains the data
needed for spectrum analysis.
FOURIER-TRANSFORM IR SPECTROMETER
8. Computer/FT Algorithm:
The Fourier Transform (FT)
algorithm converts the
interferogram from the time
domain into a spectrum, enabling
the analysis of molecular
vibrations by displaying the
intensity of transmitted light as a
function of wavenumber (or
frequency).
IR SPECTRUM
IR SPECTRUM
IR SPECTRUM
An even more compressed overview looks like this:
Wavenumuber ) Bond Type
3600 – 2700 (single bonds to hydrogen)
2700 – 1900 (triple bonds)
1900 – 1500 (double bonds)
1500 – 500 (Single bonds)
D-GLUCOSE IR SPECTRUM
The figure to the
left shows the IR
spectrum of D-
glucose. The
spectrum shows the
transmittance as a
function of
wavenumber.
D-GLUCOSE IR SPECTRUM
• present around cm.
• No stretch present. No
strong peak around 1700 cm
.
• No alkene (no peaks
above 3000 cm )
USING DATABASES TO IDENTIFY BONDS
What functional groups
(types of bonds) are
present in the IR
spectrum shown?
USING DATABASES TO IDENTIFY BONDS
In the analytical region,
the spectrum has a
broad-tongue like peak
around 3300 cm, and
two medium-sharped
peaks between 2950
and 2800 cm.
USING DATABASES TO IDENTIFY BONDS
Using the Database:
• The broad tongue-
like peak around
3300 cm is typical of
• All stretches are
below 3000 cm
USING DATABASES TO IDENTIFY BONDS
We also notice that:
• There is no strong
peak around 1700
cm, which indicates
that there are no
bonds.
IR SPECTRUM OF POLYPROPYLENE
• The Peak observed at 2952 cm is
related to asymmetric stretching
vibration.
• The peaks at 1455, 2838 and
2917 cmare attributed to
symmetric bending, symmetric
stretching and asymmetric
stretching.
IR SPECTRUM OF POLYPROPYLENE
• Symmetric bending vibration mode
of group is detected at 1375 cm.
• The peaks displayed at 972, 997
and 1165 cm are assigned to
rocking vibration.
• The peak located at 840 cm is
assigned to stretching vibration.
IR SPECTRUM OF CYCLIC OLEFIN COPOLYMER
• The absorption bands sited at
2866 and 2941 cm are assigned
to the hybridized carbon atoms
symmetric and asymmetric
stretching vibrations.
• IR peak exhibited at 1452 cm
corresponds to bending vibration
mode of group.
IR SPECTRUM OF CYCLIC OLEFIN COPOLYMER
• IR peaks displayed at 934 and
1254 cm region are attributed to
bending vibration.
• Absorption peak displayed at
1294 cm region is related to
stretching vibration mode of
backbone.
ADVANTAGES AND DISADVANTAGES
Advantages
• High Sensitivity
• Rapid Data Collection
• Broad Range of Applications
disadvantages
• Water Interference
• Limited to Certain Molecules
• Complexity in Mixtures
SCATTERING SPECTROSCOPY
DEFINITION OF SCATTERING
SPECTROSCOPY
Scattering spectroscopy is a technique that examines how light
interacts with matter by analyzing the scattering of light from a
sample. It focuses on the changes in wavelength and intensity of
the scattered light to provide information about the molecular
structure and composition of the sample, distinguishing between
elastic (Rayleigh) and inelastic (Raman) scattering.
TYPES OF SCATTERING
1. Elastic Scattering (Rayleigh
Scattering):
• Scattering of light by particles without a
change in wavelength or energy.
• Occurs when photons interact with small
particles, retaining the same energy as the
incident light.
TYPES OF SCATTERING
• Intensity decreases with increasing
wavelength (shorter wavelengths scatter
more).
• Explains why the sky appears blue.
TYPES OF SCATTERING
2. Inelastic Scattering (Raman
Scattering):
• Scattering of light produces scattered
photons with a different frequency
depending on the source and the vibrational
and rotational properties of the scattered
molecules
TYPES OF SCATTERING
2. Inelastic Scattering (Raman
Scattering):
Photons are either:
• Stokes Scattering: Lose energy to the
molecule, resulting in longer wavelengths.
• Anti-Stokes Scattering: Gain energy from
the molecule, resulting in shorter
wavelengths.
TYPES OF SCATTERING
2. Inelastic Scattering (Raman
Scattering):
• Provides specific information about
molecular vibrations and chemical bonds.
• The intensity of Raman signals depends on
the molecular concentration and structure.
RAMAN SCATTERING
When light is scattered by a
molecule, the photon's
electromagnetic field polarizes
the molecule’s electron cloud,
briefly raising the molecule to a
higher energy state. This forms a
short-lived where the energy is
temporarily absorbed. The
molecule quickly returns to a
stable state, re-emitting the
photon as scattered light.
RAMAN SCATTERING
In rare cases (about 1 in a million
photons), Raman scattering
occurs, an inelastic process
where energy is transferred
between the molecule and the
photon.
RAMAN SCATTERING
If the molecule gains energy,
the scattered photon loses
energy, increasing its
wavelength—this is known as
Stokes Raman scattering.
RAMAN SCATTERING
If a molecule loses energy by
relaxing to a lower vibrational
level, the scattered photon
gains energy, decreasing its
wavelength—this is called
Anti-Stokes Raman scattering.
RAMAN SCATTERING
• Rayleigh Scattering: The
photon’s energy remains
unchanged as it is scattered
elastically.
• Stokes Raman Scattering:
The molecule gains energy,
while the scattered photon
loses energy.
• Anti-Stokes Raman
Scattering: The molecule
loses energy, and the scattered
photon gains energy.
RAMAN SCATTERING
• Rayleigh Scattering
(middle peak): Shows no
shift in frequency.
• Stokes Raman Shift (right
peak): The scattered photon
has a higher wavelength.
• Anti-Stokes Raman Shift
(left peak): The scattered
photon has a lower
wavelength.
RAMAN SPECTROSCOPY
DISPERSIVE RAMAN SPECTROMETERS
Dispersive Raman spectroscopy is one
of the most common types of Raman
spectroscopy. It works by dispersing
the scattered light from a sample into
its component wavelengths, providing
detailed information about molecular
vibrations, crystal structures, and
material composition.
DISPERSIVE RAMAN SPECTROMETERS
1. Laser Source:
A monochromatic laser source,
typically in the visible or near-infrared
range, irradiates the sample. Common
lasers include Argon-ion (514.5 nm)
and Nd (1064 nm) lasers.
DISPERSIVE RAMAN SPECTROMETERS
2. Sample Holder:
• Solid Holders: For bulk materials,
thin films, and powders.
• Liquid Cells: Quartz or glass
cuvettes for liquids.
• Gas Cells: Airtight containers for
gases.
• Microscope Holders: For precise
focusing on small areas.
DISPERSIVE RAMAN SPECTROMETERS
3. Notch Filter
• Blocks the intense Rayleigh
scattering that occurs when the laser
interacts with the sample. It allows
only the Raman-shifted light to pass
through to the detector.
DISPERSIVE RAMAN SPECTROMETERS
4. Diffraction Grating:
The diffraction grating separates
scattered light into different
wavelengths to enable the detection of
Raman shifts, allowing for the analysis
of molecular vibrations and
composition in the sample.
DISPERSIVE RAMAN SPECTROMETERS
5. CCD detector
• Detects the dispersed Raman signals
after they pass through the
diffraction grating, capturing the
intensity and wavelength of the
light.
• Charge-Coupled Device detectors
are highly sensitive to low light
levels
DISPERSIVE RAMAN SPECTROMETERS
The final step produces a Raman
spectrum, with intensity on the
vertical axis and wavenumber on the
horizontal. Peaks in the spectrum
represent molecular vibrations,
revealing the sample's chemical
structure and composition.
FOURIER-TRANSFORM RAMAN SPECTROMETERS
FT-Raman spectroscopy employs a
laser source to excite a sample,
generating scattered light that
carries information about
molecular vibrations. An
interferometer modulates this light,
producing an interference pattern
that is detected and processed by a
computer to convert the time-
domain signal into a frequency-
domain spectrum.
FOURIER-TRANSFORM RAMAN SPECTROMETERS
The interferometer
Modulates the scattered light
by splitting it into two beams
using a beamsplitter. One
beam reflects off a fixed
mirror, while the other
reflects off a movable mirror.
When the beams recombine,
they create an interference
pattern that encodes spectral
information.
FOURIER-TRANSFORM RAMAN SPECTROMETERS
The pattern of alternating constructive
and destructive interference generates
a signal known as an interferogram.
This interferogram contains
information about all wavelengths of
the Raman-scattered light from the
sample and is subsequently converted
into a spectrum using Fourier
Transform.
FOURIER-TRANSFORM RAMAN SPECTROMETERS
The Fourier Transform (FT) algorithm converts the interferogram from the time domain
into a spectrum, enabling the analysis of molecular vibrations by displaying the intensity
of scattered light intensity as a function of wavenumber (or Raman Shift).
RAMAN SPECTRUM
• Each peak on the Raman spectrum corresponds with a different frequency of
light absorbed by the sample which excited a vibration.
• Since these frequencies are unique to the molecule and the types of bonds it
contains, the Raman spectra creates a “chemical fingerprint” that allows us to
identify and quantify a large variety of substances.
RAMAN SPECTRUM
For example, we know oxygen
vibrates at around 1550 cm
while nitrogen vibrates at 2330
cm. If we illuminate these gases
with our green laser, the gases
will absorb those frequencies of
light which we’ll see on the
Raman spectra. There will be a
peak for oxygen around 1550
cm and a peak for nitrogen
around 2330 cm.
RAMAN SPECTRUM OF CARBON TETRACHLORIDE
(CCL4)
• In the center of the spectrum is the
Rayleigh scatter peak at the laser
wavelength. This peak is millions of
times more intense than the Raman
scatter and is therefore normally
blocked by a notch filter in the
Raman spectrometer but was
included here for clarity.
RAMAN SPECTRUM OF CARBON TETRACHLORIDE
(CCL4)
Symmetrically placed on either side of
the Rayleigh peak are the three Stokes
and three Anti-Stokes peaks
corresponding to the three most intense
Raman active vibrations of CCl4.
RAMAN SPECTRUM OF POLYPROPYLENE
• The spectrum of PP from 500 to
1500 cm includes backbone
stretching vibrations,
deformation and deformation
vibration.
• From 2600 to 3000 cm the
spectrum includes and
stretching vibrations.
RAMAN SPECTRUM OF CYCLIC OLEFIN COPOLYMER
• The band at 932 cm represents
the ring vibrations of COC
molecules.
• The sharp peak at 1416 cm is
characterized for an
orthorhombic crystal structure
in polyethylene
• Raman peaks at 1225 and
1311 cm are related to the
twisting mode of the group in
COC.
RAMAN SPECTRUM OF CYCLIC OLEFIN COPOLYMER
• The observed IR band at 1041
and 1118 cm corresponds to the
stretching vibrations of
backbone.
• The absorption bands displayed
at 2870 and 2924 cm are
assigned to symmetric and
asymmetric stretching
vibrations, respectively.
ADVANTAGES AND DISADVANTAGES
Advantages
• Minimal water interference
• Can analyze a wide range of
material
• Minimal to no sample
preparation
disadvantages
• Weak signal
• Fluorescence interference
• Some samples may be damaged
by the laser
• Sensitivity to noise
COMPARISON BETWEEN FTIR AND RAMAN
SPECTROSCOPY
Fourier Transform Infrared
Spectroscopy
Raman Spectroscopy
Principle Measures the absorption of infrared
light, causing molecular vibrations.
Measures the scattering of light
caused by changes in polarizability
during molecular vibrations.
Sample Preparation Requires more preparation,
especially for solid samples (e.g.,
pressing into pellets).
Minimal to no sample preparation;
can analyze directly.
Water Interference Strong interference from water
absorption
Minimal interference from water
COMPARISON BETWEEN FTIR AND RAMAN
SPECTROSCOPY
Fourier Transform Infrared
Spectroscopy
Raman Spectroscopy
Best For Polar bonds and functional groups
(e.g).
Best For: Non-polar bonds (e.g., ).
Laser Damage No laser damage, uses infrared light. Laser Damage: Possible laser-
induced damage to sensitive
samples.
Cost Generally more affordable More expensive due to specialized
lasers and detectors.
SUMMARY:
FTIR Spectroscopy is better for identifying polar bonds and is less affected
by fluorescence.
Raman Spectroscopy is ideal for non-polar bonds and works well with water-
containing samples but is prone to fluorescence interference.
QUESTIONS?
THANK
YOU!

More Related Content

PDF
( EDAX)energy Dispersive xray spectroscopy
PDF
Raman spectroscopy
DOCX
Transmission Electron Microscopy (TEM)
PDF
Spectroscopic ellipsometry
PDF
X-ray diffraction analysis for material Characterization
PPT
Basics of Electrochemical Impedance Spectroscopy
PPTX
Xrf & it's types
( EDAX)energy Dispersive xray spectroscopy
Raman spectroscopy
Transmission Electron Microscopy (TEM)
Spectroscopic ellipsometry
X-ray diffraction analysis for material Characterization
Basics of Electrochemical Impedance Spectroscopy
Xrf & it's types

What's hot (20)

PPTX
Photoacoustic spectroscopy
PPTX
XRF and its types
PPTX
Presentation on x ray diffraction
PPTX
Optical Spectroscopy
PPT
Piezo Responce Force Microscopy
PPT
Proton Induced X Ray Emission P P
PPT
PPTX
Multiferroic materials
PPTX
PDF
Energy Dispersive Spectroscopy
PPTX
Language of Analytical Chemistry 21.8.2021
PPTX
Transition Metal Nitrides(TMNs), Transition Metal Oxides, Transition Metal ph...
PPTX
superparamagnetism and its biological applications
PPTX
Electroanalytical chemistry polarography
PPT
Voltammetry vipul
PPTX
Instrumentation presentation - Auger Electron Spectroscopy (AES)
PPTX
Electron energy loss spectroscopy
PPTX
Meissner Effect.pptx
PPTX
ICP AES overview-Nipa 25.01.2023.pptx
PPTX
NMR Spectroscopy
Photoacoustic spectroscopy
XRF and its types
Presentation on x ray diffraction
Optical Spectroscopy
Piezo Responce Force Microscopy
Proton Induced X Ray Emission P P
Multiferroic materials
Energy Dispersive Spectroscopy
Language of Analytical Chemistry 21.8.2021
Transition Metal Nitrides(TMNs), Transition Metal Oxides, Transition Metal ph...
superparamagnetism and its biological applications
Electroanalytical chemistry polarography
Voltammetry vipul
Instrumentation presentation - Auger Electron Spectroscopy (AES)
Electron energy loss spectroscopy
Meissner Effect.pptx
ICP AES overview-Nipa 25.01.2023.pptx
NMR Spectroscopy
Ad

Similar to Fourier-Transform Infrared (FTIR) and Raman Spectroscopy (20)

PPTX
New microsoft power point presentation
PPT
INFRARED SPECTROSCOPY to find the functional group
PPTX
Infrared spectroscozpy analysismethods(6).pptx
PPTX
Infrared spectroscopy
PPTX
IR AND FTIR SPECTROSCOPY AND ITS APPLICATION by Drx Zainab Mantasha.pptx
PPT
Ftir final presentation
PPT
Shashi
PPTX
null.pptx
PPTX
Infrared spectroscopy
PPTX
PPT
Ir spectroscopy nd its applications copy
PPTX
Ir spectroscopy from nstu
PPTX
Infrared-Spectroscopy-kiransia.pptx info
PPTX
Infrared-Spectroscopy-ppt.pptx info bysi
PPTX
PPTX
Ftir (fourier transform infra red spectroscopy)
PPTX
Infra red spectroscopy.
PPT
FTIR_2_25.ppt_for the study and knowing.
PPTX
Rahul presentation.pptx
New microsoft power point presentation
INFRARED SPECTROSCOPY to find the functional group
Infrared spectroscozpy analysismethods(6).pptx
Infrared spectroscopy
IR AND FTIR SPECTROSCOPY AND ITS APPLICATION by Drx Zainab Mantasha.pptx
Ftir final presentation
Shashi
null.pptx
Infrared spectroscopy
Ir spectroscopy nd its applications copy
Ir spectroscopy from nstu
Infrared-Spectroscopy-kiransia.pptx info
Infrared-Spectroscopy-ppt.pptx info bysi
Ftir (fourier transform infra red spectroscopy)
Infra red spectroscopy.
FTIR_2_25.ppt_for the study and knowing.
Rahul presentation.pptx
Ad

Recently uploaded (20)

PPTX
neck nodes and dissection types and lymph nodes levels
PDF
bbec55_b34400a7914c42429908233dbd381773.pdf
PPTX
2. Earth - The Living Planet earth and life
PPTX
Protein & Amino Acid Structures Levels of protein structure (primary, seconda...
PDF
Phytochemical Investigation of Miliusa longipes.pdf
PDF
CAPERS-LRD-z9:AGas-enshroudedLittleRedDotHostingaBroad-lineActive GalacticNuc...
PPTX
Introduction to Fisheries Biotechnology_Lesson 1.pptx
PDF
An interstellar mission to test astrophysical black holes
PDF
MIRIDeepImagingSurvey(MIDIS)oftheHubbleUltraDeepField
PPTX
ANEMIA WITH LEUKOPENIA MDS 07_25.pptx htggtftgt fredrctvg
PPTX
Microbiology with diagram medical studies .pptx
PPTX
GEN. BIO 1 - CELL TYPES & CELL MODIFICATIONS
PDF
AlphaEarth Foundations and the Satellite Embedding dataset
PPT
protein biochemistry.ppt for university classes
PPTX
G5Q1W8 PPT SCIENCE.pptx 2025-2026 GRADE 5
PPTX
Derivatives of integument scales, beaks, horns,.pptx
PDF
SEHH2274 Organic Chemistry Notes 1 Structure and Bonding.pdf
PPTX
ECG_Course_Presentation د.محمد صقران ppt
PPTX
famous lake in india and its disturibution and importance
PPT
The World of Physical Science, • Labs: Safety Simulation, Measurement Practice
neck nodes and dissection types and lymph nodes levels
bbec55_b34400a7914c42429908233dbd381773.pdf
2. Earth - The Living Planet earth and life
Protein & Amino Acid Structures Levels of protein structure (primary, seconda...
Phytochemical Investigation of Miliusa longipes.pdf
CAPERS-LRD-z9:AGas-enshroudedLittleRedDotHostingaBroad-lineActive GalacticNuc...
Introduction to Fisheries Biotechnology_Lesson 1.pptx
An interstellar mission to test astrophysical black holes
MIRIDeepImagingSurvey(MIDIS)oftheHubbleUltraDeepField
ANEMIA WITH LEUKOPENIA MDS 07_25.pptx htggtftgt fredrctvg
Microbiology with diagram medical studies .pptx
GEN. BIO 1 - CELL TYPES & CELL MODIFICATIONS
AlphaEarth Foundations and the Satellite Embedding dataset
protein biochemistry.ppt for university classes
G5Q1W8 PPT SCIENCE.pptx 2025-2026 GRADE 5
Derivatives of integument scales, beaks, horns,.pptx
SEHH2274 Organic Chemistry Notes 1 Structure and Bonding.pdf
ECG_Course_Presentation د.محمد صقران ppt
famous lake in india and its disturibution and importance
The World of Physical Science, • Labs: Safety Simulation, Measurement Practice

Fourier-Transform Infrared (FTIR) and Raman Spectroscopy

  • 1. FOURIER-TRANSFORM INFRARED (FTIR) AND RAMAN SPECTROSCOPY An Overview of Techniques and Applications Presented by: Natheir Hasan Date: 6th November 2024
  • 3. WHAT IS SPECTROSCOPY? Spectroscopy is the scientific study of the interaction between electromagnetic radiation (light) and matter. It encompasses various techniques used to analyze the composition and structure of substances by examining the light they absorb, emit, or scatter.
  • 4. LIGHT-MATTER INTERACTION Light and matter interact with each other in various ways. Matter can absorb light (take it in); emit light (give it off); transmit light (allow it to pass through); reflect light (cause it to bounce off); and refract light (cause it to change speed and direction).
  • 5. IMPORTANCE OF SPECTROSCOPY IN CHEMICAL ANALYSIS: • It does not alter or damage the sample being analyzed. Non-Destructive Analysis: • Provides detailed information about the molecular structure and composition of substances. Detailed Molecular Information: • Pharmaceuticals, Environmental Science, Materials Science Wide Range of Applications:
  • 6. TYPES OF SPECTROSCOPY Emission spectroscopy • Fluorimetry • Flame photometry • Atomic Emission Spectroscopy Absorption Spectroscopy • UV-Visible Spectroscopy • IR Spectroscopy • Nuclear Magnetic Resonance Spectroscopy • Atomic Absorption Spectroscopy Scattering Spectroscopy • Raman Spectroscopy
  • 9. DEFINITION OF IR SPECTROSCOPY IR Spectroscopy (Infrared Spectroscopy) is an analytical technique used to identify and study chemicals by measuring how molecules absorb infrared light. This absorption causes molecular vibrations, such as stretching and bending of bonds, which are unique to different functional groups.
  • 10. PRINCIPLE • When a molecule absorbs IR radiation, the energy of the radiation matches the energy difference between the molecule's vibrational states. • Only vibrational transitions that lead to a change in the dipole moment of the molecule will absorb IR light (making polar bonds important). • The absorption of IR radiation occurs at specific wavelengths (wavenumbers), corresponding to the natural vibrational frequencies of the bonds in the molecule.
  • 11. PRINCIPLE • Nonpolar molecules may not show significant IR absorption unless a dipole moment is induced during vibration. • Mid-IR region ( cm) is where most fundamental vibrations occur and is the most commonly used region in IR spectroscopy.
  • 12. IR REGION IN THE ELECTROMAGNETIC SPECTRUM
  • 13. VIBRATIONAL MODES Radial (Stretching) Symmetric stretching Antisymmetric stretching Latitudinal (In plane bending) Scissoring Rocking Longitudinal (Out of plane bending) Wagging Twisting
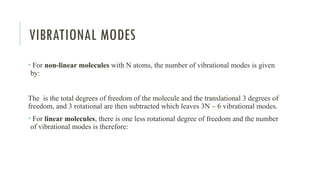
  • 14. VIBRATIONAL MODES • For non-linear molecules with N atoms, the number of vibrational modes is given by: The is the total degrees of freedom of the molecule and the translational 3 degrees of freedom, and 3 rotational are then subtracted which leaves 3N – 6 vibrational modes. • For linear molecules, there is one less rotational degree of freedom and the number of vibrational modes is therefore:
  • 15. QUANTUM MECHANICAL BASIS • Each vibrational mode corresponds to a specific vibrational energy level in the molecule. • These energy levels are quantized, meaning the molecule can only vibrate at specific frequencies. • Only vibrations that cause a change in the dipole moment of the molecule are IR- active. Therefore, not all vibrations will result in IR absorption.
  • 16. DISPERSIVE INFRARED SPECTROSCOPY Traditional IR spectroscopy begins by shining IR light onto a diffraction grating, which separates light by wavelength. Different wavelengths exit the grating at slightly different angles due to the relationship between the angle of exit and the wavelength of light. This technique is called dispersive infrared spectroscopy because it disperses the wavelengths in space.
  • 17. DISPERSIVE INFRARED SPECTROSCOPY After the IR beam is separated by wavelength, it passes through a slit to create a monochromatic beam directed at the sample for absorbance measurement. The diffraction grating angle is then adjusted to isolate other wavelengths, repeating the process until all absorbances are collected, which allows for the plotting of the IR spectrum.
  • 18. DISPERSIVE INFRARED SPECTROSCOPY The issue with this dispersive design was the long time it took to obtain an entire spectrum due to the sequential detection.
  • 20. THE FINGERPRINT REGION • Complex Absorptions: The region below 1500 cm is known as the fingerprint region. It contains a dense series of absorption peaks that are unique to the molecule. • This region arises from bending vibrations, complex stretching modes, and out-of-plane vibrations. • Identification: The fingerprint region is highly specific to each molecule and can be used to match a sample against known reference spectra for compound identification. • Bending vibrations dominate.
  • 21. THE DIAGNOSTIC REGION • The diagnostic region in IR spectroscopy spans from 4000 cm to 1500 cm. • It is called the diagnostic region because it contains well-defined absorption peaks that are easily correlated with specific functional groups. • In contrast to the fingerprint region, peaks in this region are less crowded and easier to interpret, making it ideal for identifying functional groups. • Stretching vibrations dominate.
  • 22. KEY FUNCTIONAL GROUPS AND THEIR IR ABSORPTION RANGES • Each functional group in a molecule absorbs IR radiation at characteristic wavenumbers due to its unique bond vibrations. • The position and intensity of these absorption bands allow for the identification of specific groups in a molecule.
  • 24. DEFINITION • Fourier Transform Infrared Spectroscopy (FTIR) is an advanced analytical technique that measures the infrared absorption of a sample, providing insights into its molecular composition and structure. • Unlike traditional infrared spectroscopy, which typically employs monochromatic light sources, FTIR utilizes a broadband infrared source. This means that FTIR simultaneously collects data across a wide range of wavelengths (or frequencies) instead of measuring one wavelength at a time.
  • 26. FOURIER-TRANSFORM IR SPECTROMETER 1. IR Source: Emits a broad spectrum of infrared radiation (4000 cm 400 cm) that interacts with the sample. Types of Sources: 2. Globar 3. Tungsten-Halogen lamp
  • 27. FOURIER-TRANSFORM IR SPECTROMETER 2. Beam-Splitter: Divides the incoming infrared beam into two paths: one directed toward a fixed mirror and the other toward a moving mirror. It is typically made from materials like or germanium.
  • 28. FOURIER-TRANSFORM IR SPECTROMETER 3. Fixed Mirror: Reflects one of the beams back toward the beam splitter. 4. Moving Mirror: Adjusts the path length of the second beam, causing changes in phase that create interference patterns.
  • 29. FOURIER-TRANSFORM IR SPECTROMETER • Constructive interference occurs when the peaks of the waves align, reinforcing each other and increasing the signal intensity at certain wavelengths.
  • 30. FOURIER-TRANSFORM IR SPECTROMETER • Destructive interference happens when the peak of one wave aligns with the trough of another, canceling each other out, reducing the signal at those wavelengths.
  • 31. FOURIER-TRANSFORM IR SPECTROMETER • This pattern of alternating constructive and destructive interference creates a signal called an interferogram. • The interferogram contains information about all wavelengths of light that passed through the sample and is later converted into a spectrum using Fourier Transform.
  • 32. FOURIER-TRANSFORM IR SPECTROMETER 5. Sample Holders • Solid Samples: Can be analyzed directly or prepared as thin films, often using techniques like KBr pellets. • Liquid Cells: Typically made of materials like KBr. • Gas Cells: Designed with long path lengths and reflective mirrors, used for gaseous samples.
  • 33. FOURIER-TRANSFORM IR SPECTROMETER 6. Detector: Converts the infrared light that has passed through or reflected from the sample into an electrical signal for analysis. Mercury Cadmium Telluride (MCT): A semiconductor detector that is sensitive to a wide range of IR wavelengths.
  • 34. FOURIER-TRANSFORM IR SPECTROMETER 7. Inteferogram: A graph showing the raw signal from the detector.
  • 35. FOURIER-TRANSFORM IR SPECTROMETER 7. Inteferogram: An interferogram is a graph showing the raw signal from the FTIR detector. The x-axis represents the path difference (retardation) between light beams, and the y-axis shows the intensity of transmitted light. It displays intensity variations due to light interference and contains the data needed for spectrum analysis.
  • 36. FOURIER-TRANSFORM IR SPECTROMETER 8. Computer/FT Algorithm: The Fourier Transform (FT) algorithm converts the interferogram from the time domain into a spectrum, enabling the analysis of molecular vibrations by displaying the intensity of transmitted light as a function of wavenumber (or frequency).
  • 39. IR SPECTRUM An even more compressed overview looks like this: Wavenumuber ) Bond Type 3600 – 2700 (single bonds to hydrogen) 2700 – 1900 (triple bonds) 1900 – 1500 (double bonds) 1500 – 500 (Single bonds)
  • 40. D-GLUCOSE IR SPECTRUM The figure to the left shows the IR spectrum of D- glucose. The spectrum shows the transmittance as a function of wavenumber.
  • 41. D-GLUCOSE IR SPECTRUM • present around cm. • No stretch present. No strong peak around 1700 cm . • No alkene (no peaks above 3000 cm )
  • 42. USING DATABASES TO IDENTIFY BONDS What functional groups (types of bonds) are present in the IR spectrum shown?
  • 43. USING DATABASES TO IDENTIFY BONDS In the analytical region, the spectrum has a broad-tongue like peak around 3300 cm, and two medium-sharped peaks between 2950 and 2800 cm.
  • 44. USING DATABASES TO IDENTIFY BONDS Using the Database: • The broad tongue- like peak around 3300 cm is typical of • All stretches are below 3000 cm
  • 45. USING DATABASES TO IDENTIFY BONDS We also notice that: • There is no strong peak around 1700 cm, which indicates that there are no bonds.
  • 46. IR SPECTRUM OF POLYPROPYLENE • The Peak observed at 2952 cm is related to asymmetric stretching vibration. • The peaks at 1455, 2838 and 2917 cmare attributed to symmetric bending, symmetric stretching and asymmetric stretching.
  • 47. IR SPECTRUM OF POLYPROPYLENE • Symmetric bending vibration mode of group is detected at 1375 cm. • The peaks displayed at 972, 997 and 1165 cm are assigned to rocking vibration. • The peak located at 840 cm is assigned to stretching vibration.
  • 48. IR SPECTRUM OF CYCLIC OLEFIN COPOLYMER • The absorption bands sited at 2866 and 2941 cm are assigned to the hybridized carbon atoms symmetric and asymmetric stretching vibrations. • IR peak exhibited at 1452 cm corresponds to bending vibration mode of group.
  • 49. IR SPECTRUM OF CYCLIC OLEFIN COPOLYMER • IR peaks displayed at 934 and 1254 cm region are attributed to bending vibration. • Absorption peak displayed at 1294 cm region is related to stretching vibration mode of backbone.
  • 50. ADVANTAGES AND DISADVANTAGES Advantages • High Sensitivity • Rapid Data Collection • Broad Range of Applications disadvantages • Water Interference • Limited to Certain Molecules • Complexity in Mixtures
  • 52. DEFINITION OF SCATTERING SPECTROSCOPY Scattering spectroscopy is a technique that examines how light interacts with matter by analyzing the scattering of light from a sample. It focuses on the changes in wavelength and intensity of the scattered light to provide information about the molecular structure and composition of the sample, distinguishing between elastic (Rayleigh) and inelastic (Raman) scattering.
  • 53. TYPES OF SCATTERING 1. Elastic Scattering (Rayleigh Scattering): • Scattering of light by particles without a change in wavelength or energy. • Occurs when photons interact with small particles, retaining the same energy as the incident light.
  • 54. TYPES OF SCATTERING • Intensity decreases with increasing wavelength (shorter wavelengths scatter more). • Explains why the sky appears blue.
  • 55. TYPES OF SCATTERING 2. Inelastic Scattering (Raman Scattering): • Scattering of light produces scattered photons with a different frequency depending on the source and the vibrational and rotational properties of the scattered molecules
  • 56. TYPES OF SCATTERING 2. Inelastic Scattering (Raman Scattering): Photons are either: • Stokes Scattering: Lose energy to the molecule, resulting in longer wavelengths. • Anti-Stokes Scattering: Gain energy from the molecule, resulting in shorter wavelengths.
  • 57. TYPES OF SCATTERING 2. Inelastic Scattering (Raman Scattering): • Provides specific information about molecular vibrations and chemical bonds. • The intensity of Raman signals depends on the molecular concentration and structure.
  • 58. RAMAN SCATTERING When light is scattered by a molecule, the photon's electromagnetic field polarizes the molecule’s electron cloud, briefly raising the molecule to a higher energy state. This forms a short-lived where the energy is temporarily absorbed. The molecule quickly returns to a stable state, re-emitting the photon as scattered light.
  • 59. RAMAN SCATTERING In rare cases (about 1 in a million photons), Raman scattering occurs, an inelastic process where energy is transferred between the molecule and the photon.
  • 60. RAMAN SCATTERING If the molecule gains energy, the scattered photon loses energy, increasing its wavelength—this is known as Stokes Raman scattering.
  • 61. RAMAN SCATTERING If a molecule loses energy by relaxing to a lower vibrational level, the scattered photon gains energy, decreasing its wavelength—this is called Anti-Stokes Raman scattering.
  • 62. RAMAN SCATTERING • Rayleigh Scattering: The photon’s energy remains unchanged as it is scattered elastically. • Stokes Raman Scattering: The molecule gains energy, while the scattered photon loses energy. • Anti-Stokes Raman Scattering: The molecule loses energy, and the scattered photon gains energy.
  • 63. RAMAN SCATTERING • Rayleigh Scattering (middle peak): Shows no shift in frequency. • Stokes Raman Shift (right peak): The scattered photon has a higher wavelength. • Anti-Stokes Raman Shift (left peak): The scattered photon has a lower wavelength.
  • 65. DISPERSIVE RAMAN SPECTROMETERS Dispersive Raman spectroscopy is one of the most common types of Raman spectroscopy. It works by dispersing the scattered light from a sample into its component wavelengths, providing detailed information about molecular vibrations, crystal structures, and material composition.
  • 66. DISPERSIVE RAMAN SPECTROMETERS 1. Laser Source: A monochromatic laser source, typically in the visible or near-infrared range, irradiates the sample. Common lasers include Argon-ion (514.5 nm) and Nd (1064 nm) lasers.
  • 67. DISPERSIVE RAMAN SPECTROMETERS 2. Sample Holder: • Solid Holders: For bulk materials, thin films, and powders. • Liquid Cells: Quartz or glass cuvettes for liquids. • Gas Cells: Airtight containers for gases. • Microscope Holders: For precise focusing on small areas.
  • 68. DISPERSIVE RAMAN SPECTROMETERS 3. Notch Filter • Blocks the intense Rayleigh scattering that occurs when the laser interacts with the sample. It allows only the Raman-shifted light to pass through to the detector.
  • 69. DISPERSIVE RAMAN SPECTROMETERS 4. Diffraction Grating: The diffraction grating separates scattered light into different wavelengths to enable the detection of Raman shifts, allowing for the analysis of molecular vibrations and composition in the sample.
  • 70. DISPERSIVE RAMAN SPECTROMETERS 5. CCD detector • Detects the dispersed Raman signals after they pass through the diffraction grating, capturing the intensity and wavelength of the light. • Charge-Coupled Device detectors are highly sensitive to low light levels
  • 71. DISPERSIVE RAMAN SPECTROMETERS The final step produces a Raman spectrum, with intensity on the vertical axis and wavenumber on the horizontal. Peaks in the spectrum represent molecular vibrations, revealing the sample's chemical structure and composition.
  • 72. FOURIER-TRANSFORM RAMAN SPECTROMETERS FT-Raman spectroscopy employs a laser source to excite a sample, generating scattered light that carries information about molecular vibrations. An interferometer modulates this light, producing an interference pattern that is detected and processed by a computer to convert the time- domain signal into a frequency- domain spectrum.
  • 73. FOURIER-TRANSFORM RAMAN SPECTROMETERS The interferometer Modulates the scattered light by splitting it into two beams using a beamsplitter. One beam reflects off a fixed mirror, while the other reflects off a movable mirror. When the beams recombine, they create an interference pattern that encodes spectral information.
  • 74. FOURIER-TRANSFORM RAMAN SPECTROMETERS The pattern of alternating constructive and destructive interference generates a signal known as an interferogram. This interferogram contains information about all wavelengths of the Raman-scattered light from the sample and is subsequently converted into a spectrum using Fourier Transform.
  • 75. FOURIER-TRANSFORM RAMAN SPECTROMETERS The Fourier Transform (FT) algorithm converts the interferogram from the time domain into a spectrum, enabling the analysis of molecular vibrations by displaying the intensity of scattered light intensity as a function of wavenumber (or Raman Shift).
  • 76. RAMAN SPECTRUM • Each peak on the Raman spectrum corresponds with a different frequency of light absorbed by the sample which excited a vibration. • Since these frequencies are unique to the molecule and the types of bonds it contains, the Raman spectra creates a “chemical fingerprint” that allows us to identify and quantify a large variety of substances.
  • 77. RAMAN SPECTRUM For example, we know oxygen vibrates at around 1550 cm while nitrogen vibrates at 2330 cm. If we illuminate these gases with our green laser, the gases will absorb those frequencies of light which we’ll see on the Raman spectra. There will be a peak for oxygen around 1550 cm and a peak for nitrogen around 2330 cm.
  • 78. RAMAN SPECTRUM OF CARBON TETRACHLORIDE (CCL4) • In the center of the spectrum is the Rayleigh scatter peak at the laser wavelength. This peak is millions of times more intense than the Raman scatter and is therefore normally blocked by a notch filter in the Raman spectrometer but was included here for clarity.
  • 79. RAMAN SPECTRUM OF CARBON TETRACHLORIDE (CCL4) Symmetrically placed on either side of the Rayleigh peak are the three Stokes and three Anti-Stokes peaks corresponding to the three most intense Raman active vibrations of CCl4.
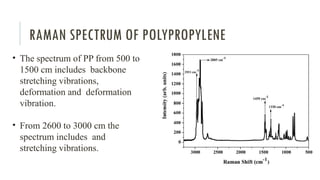
  • 80. RAMAN SPECTRUM OF POLYPROPYLENE • The spectrum of PP from 500 to 1500 cm includes backbone stretching vibrations, deformation and deformation vibration. • From 2600 to 3000 cm the spectrum includes and stretching vibrations.
  • 81. RAMAN SPECTRUM OF CYCLIC OLEFIN COPOLYMER • The band at 932 cm represents the ring vibrations of COC molecules. • The sharp peak at 1416 cm is characterized for an orthorhombic crystal structure in polyethylene • Raman peaks at 1225 and 1311 cm are related to the twisting mode of the group in COC.
  • 82. RAMAN SPECTRUM OF CYCLIC OLEFIN COPOLYMER • The observed IR band at 1041 and 1118 cm corresponds to the stretching vibrations of backbone. • The absorption bands displayed at 2870 and 2924 cm are assigned to symmetric and asymmetric stretching vibrations, respectively.
  • 83. ADVANTAGES AND DISADVANTAGES Advantages • Minimal water interference • Can analyze a wide range of material • Minimal to no sample preparation disadvantages • Weak signal • Fluorescence interference • Some samples may be damaged by the laser • Sensitivity to noise
  • 84. COMPARISON BETWEEN FTIR AND RAMAN SPECTROSCOPY Fourier Transform Infrared Spectroscopy Raman Spectroscopy Principle Measures the absorption of infrared light, causing molecular vibrations. Measures the scattering of light caused by changes in polarizability during molecular vibrations. Sample Preparation Requires more preparation, especially for solid samples (e.g., pressing into pellets). Minimal to no sample preparation; can analyze directly. Water Interference Strong interference from water absorption Minimal interference from water
  • 85. COMPARISON BETWEEN FTIR AND RAMAN SPECTROSCOPY Fourier Transform Infrared Spectroscopy Raman Spectroscopy Best For Polar bonds and functional groups (e.g). Best For: Non-polar bonds (e.g., ). Laser Damage No laser damage, uses infrared light. Laser Damage: Possible laser- induced damage to sensitive samples. Cost Generally more affordable More expensive due to specialized lasers and detectors.
  • 86. SUMMARY: FTIR Spectroscopy is better for identifying polar bonds and is less affected by fluorescence. Raman Spectroscopy is ideal for non-polar bonds and works well with water- containing samples but is prone to fluorescence interference.