GeoMesa on Apache Spark SQL with Anthony Fox
5 likes2,705 views

This document discusses location intelligence and GeoMesa. It begins with an introduction to location intelligence and GeoMesa. It then covers spatial data types, spatial SQL, and optimizing spatial SQL queries by extending Spark's Catalyst optimizer. Examples are provided to demonstrate calculating density of activity in San Francisco and generating a speed profile of a metro area using location data. Spatial analysis techniques like spatial joins, buffers, and geohashing are explored to extract insights from spatial data at scale.


![SQL optimizations for Spatial Predicates
object STContainsRule extendsRule[LogicalPlan]with PredicateHelper{
override defapply(plan: LogicalPlan): LogicalPlan ={
plan.transform{
case filt @ Filter(f, lr@LogicalRelation(gmRel: GeoMesaRelation,_,_)) =>
…
val relation =gmRel.copy(filt =ff.and(gtFilters:+gmRel.filt))
lr.copy(expectedOutputAttributes=Some(lr.output),
relation =relation)
}
}](https://image.slidesharecdn.com/035anthonyfox-170614014311/85/GeoMesa-on-Apache-Spark-SQL-with-Anthony-Fox-51-320.jpg)
![SQL optimizations for Spatial Predicates
object STContainsRule extendsRule[LogicalPlan]with PredicateHelper{
override defapply(plan: LogicalPlan): LogicalPlan ={
plan.transform{
case filt @ Filter(f, lr@LogicalRelation(gmRel: GeoMesaRelation,_,_)) =>
…
val relation =gmRel.copy(filt =ff.and(gtFilters:+gmRel.filt))
lr.copy(expectedOutputAttributes=Some(lr.output),
relation =relation)
}
}
Intercept a Filter on a
GeoMesa Logical Relation](https://image.slidesharecdn.com/035anthonyfox-170614014311/85/GeoMesa-on-Apache-Spark-SQL-with-Anthony-Fox-52-320.jpg)
![SQL optimizations for Spatial Predicates
object STContainsRule extendsRule[LogicalPlan]with PredicateHelper{
override defapply(plan: LogicalPlan): LogicalPlan ={
plan.transform{
case filt @ Filter(f, lr@LogicalRelation(gmRel: GeoMesaRelation,_,_)) =>
…
val relation =gmRel.copy(filt =ff.and(gtFilters:+gmRel.filt))
lr.copy(expectedOutputAttributes=Some(lr.output),
relation =relation)
}
} Extract the predicates that can be handled by GeoMesa, create a new GeoMesa relation with
the predicates pushed down into the scan,and return a modified tree with the new relation and
the filter removed.
GeoMesa will compute the minimal ranges necessary to cover the query region.](https://image.slidesharecdn.com/035anthonyfox-170614014311/85/GeoMesa-on-Apache-Spark-SQL-with-Anthony-Fox-53-320.jpg)


![Visualize using Jupyter
and Bokeh
Density of Activity in San Francisco
p = figure(title="STRAVA",
plot_width=900,plot_height=600,
x_range=x_range,y_range=y_range)
p.add_tile(tonerlines)
p.circle(x=projecteddf['px'],
y=projecteddf['py'],
fill_alpha=0.5,
size=6,
fill_color=colors,
line_color=colors)
show(p)](https://image.slidesharecdn.com/035anthonyfox-170614014311/85/GeoMesa-on-Apache-Spark-SQL-with-Anthony-Fox-66-320.jpg)

![Speed Profile of a Metro Area
Inputs STRAVA Activities
An activity is sampled once per second
Each observation has a location and time
{
"type": "Feature",
"geometry": { "type": "Point", "coordinates": [-122.40736,37.807147] },
"properties": {
"activity_id": "**********************",
"athlete_id": "**********************",
"device_type": 5,
"activity_type": "Ride",
"frame_type": 2,
"commute": false,
"date": "2016-11-02T23:58:03",
"index": 0
},
"id": "6a9bb90497be6f64eae009e6c760389017bc31db:0"
}](https://image.slidesharecdn.com/035anthonyfox-170614014311/85/GeoMesa-on-Apache-Spark-SQL-with-Anthony-Fox-68-320.jpg)


![p = figure(title="STRAVA",
plot_width=900,plot_height=600,
x_range=x_range,y_range=y_range)
p.add_tile(tonerlines)
p.circle(x=projecteddf['px'],
y=projecteddf['py'],
fill_alpha=0.5,
size=6,
fill_color=colors,
line_color=colors)
show(p)
Visualize using Jupyter
and Bokeh
Speed Profile of a Metro Area](https://image.slidesharecdn.com/035anthonyfox-170614014311/85/GeoMesa-on-Apache-Spark-SQL-with-Anthony-Fox-85-320.jpg)


![Space-filling curves linearize a
multi-dimensional space
Bigtable Index
[0,2^32]
1301409650
4294967296
0](https://image.slidesharecdn.com/035anthonyfox-170614014311/85/GeoMesa-on-Apache-Spark-SQL-with-Anthony-Fox-99-320.jpg)
![Regions translate to range scans
Bigtable Index
[0,2^32]
1301409657
1301409650
0
4294967296
scan ‘geomesa’,{STARTROW=> 1301409650,ENDROW=> 1301409657}](https://image.slidesharecdn.com/035anthonyfox-170614014311/85/GeoMesa-on-Apache-Spark-SQL-with-Anthony-Fox-100-320.jpg)


GeoMesa on Apache Spark SQL with Anthony Fox
- 1. Anthony Fox Directorof Data Science,Commonwealth ComputerResearch Inc GeoMesa Founderand TechnicalLead anthony.fox@ccri.com linkedin.com/in/anthony-fox-ccri twitter.com/algoriffic www.ccri.com GeoMesa on Spark SQL Extracting Location Intelligence from Data
- 3. ADS-B
- 4. Mobile Apps
- 5. Mobile Apps
- 6. Intro to Location Intelligence and GeoMesa Spatial Data Types, Spatial SQL Extending Spark Catalyst for Optimized Spatial SQL Density of activity in San Francisco Speed profile of San Francisco
- 7. Intro to Location Intelligence and GeoMesa Spatial Data Types, Spatial SQL Extending Spark Catalyst for Optimized Spatial SQL Density of activity in San Francisco Speed profile of San Francisco
- 8. Intro to Location Intelligence and GeoMesa Spatial Data Types, Spatial SQL Extending Spark Catalyst for OptimizedSpatial SQL Density of activity in San Francisco Speed profile of San Francisco
- 9. Intro to Location Intelligence and GeoMesa Spatial Data Types, Spatial SQL Extending Spark Catalyst for Optimized Spatial SQL Density of activity in San Francisco Speed profile of San Francisco
- 11. Location Intelligence Show me all the coffee shops in this neighborhood Easy Hard
- 12. Location Intelligence Show me all the coffee shops in this neighborhood How many users commute through this intersection every day? Easy Hard
- 17. Location Intelligence Show me all the coffee shops in this neighborhood How many users commute through this intersection every day? Easy Hard
- 18. Location Intelligence Show me all the coffee shops in this neighborhood How many users commute through this intersection every day? Which users commute within 250 meters of a coffee shop? Easy Hard
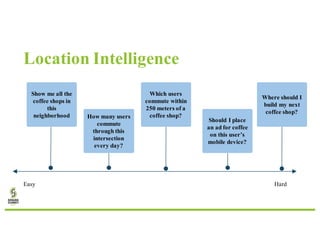
- 19. Location Intelligence Easy Hard Show me all the coffee shops in this neighborhood How many users commute through this intersection every day? Which users commute within 250 meters of a coffee shop? Should I place an ad for coffee on this user’s mobile device?
- 20. Location Intelligence Easy Hard Show me all the coffee shops in this neighborhood How many users commute through this intersection every day? Which users commute within 250 meters of a coffee shop? Should I place an ad for coffee on this user’s mobile device? Where should I build my next coffee shop?
- 21. What is GeoMesa? A suite of tools for persisting, querying, analyzing, and streaming spatio-temporal data at scale
- 22. What is GeoMesa? A suite of tools for persisting, querying, analyzing, and streaming spatio-temporal data at scale
- 23. What is GeoMesa? A suite of tools for persisting, querying, analyzing, and streaming spatio-temporal data at scale
- 24. What is GeoMesa? A suite of tools for persisting, querying, analyzing, and streaming spatio-temporal data at scale
- 25. What is GeoMesa? A suite of tools for persisting, querying, analyzing, and streaming spatio-temporal data at scale
- 26. Intro to Location Intelligence and GeoMesa Spatial Data Types, Spatial SQL Extending Spark Catalyst for Optimized Spatial SQL Density of activity in San Francisco Speed profile of San Francisco
- 28. Spatial Data Types Points Locations Events Instantaneous Positions
- 29. Spatial Data Types Points Locations Events Instantaneous Positions Lines Road networks Voyages Trips Trajectories
- 30. Spatial Data Types Points Locations Events Instantaneous Positions Lines Road networks Voyages Trips Trajectories Polygons Administrative Regions Airspaces
- 31. Spatial Data Types Points Locations Events Instantaneous Positions PointUDT MultiPointUDT Lines Road networks Voyages Trips Trajectories LineUDT MultiLineUDT Polygons Administrative Regions Airspaces PolygonUDT MultiPolygonUDT
- 32. Spatial SQL SELECT activity_id,user_id,geom,dtg FROM activities WHERE st_contains(st_makeBBOX(-78,37,-77,38),geom) AND dtg > cast(‘2017-06-01’ as timestamp) AND dtg < cast(‘2017-06-05’ as timestamp)
- 33. Spatial SQL SELECT activity_id,user_id,geom,dtg FROM activities WHERE st_contains(st_makeBBOX(-78,37,-77,38),geom) AND dtg > cast(‘2017-06-01’ as timestamp) AND dtg < cast(‘2017-06-05’ as timestamp) Geometry constructor
- 34. Spatial SQL SELECT activity_id,user_id,geom,dtg FROM activities WHERE st_contains(st_makeBBOX(-78,37,-77,38),geom) AND dtg > cast(‘2017-06-01’ as timestamp) AND dtg < cast(‘2017-06-05’ as timestamp) Spatial column in schema
- 35. Spatial SQL SELECT activity_id,user_id,geom,dtg FROM activities WHERE st_contains(st_makeBBOX(-78,37,-77,38),geom) AND dtg > cast(‘2017-06-01’ as timestamp) AND dtg < cast(‘2017-06-05’ as timestamp) Topological predicate
- 36. Sample Spatial UDFs: Geometry Constructors st_geomFromWKT Create a point, line, or polygon from a WKT st_geomFromWKT(‘POINT(-122.40,37.78)’) st_makeLine Create a line from a sequence of points st_makeLine(collect_list(geom)) st_makeBBOX Create a bounding box from (left, bottom, right, top) st_makeBBOX(-123,37,-121,39) ...
- 37. Sample Spatial UDFs: Topological Predicates st_contains Returns true if the second argument is contained within the first argument st_contains( st_geomFromWKT(‘POLYGON…’), geom ) st_within Returns true if the second argument geometry is entirely within the first argument st_within( st_geomFromWKT(‘POLYGON…’), geom ) st_dwithin Returns true if the geometries are within a specified distance from each other st_dwithin(geom1, geom2, 100)
- 38. Sample Spatial UDFs: Processing st_bufferPoint Create a bufferaround a point fordistance within type queries st_bufferPoint(geom, 10) st_envelope Extract the envelope ofa geometry st_envelope(geom) st_geohash Encode the geometry using a Z-Orderspace filling curve. Useful for grid analysis. st_geohash(geom, 35) st_closestpoint Find the point on the target geometry thatis closest to the given geometry st_closestpoint(geom1, geom2) st_distanceSpheroid Find the great circle distance usingthe WGS84 ellipsoid st_distanceSpheroid(geom1, geom2)
- 39. Intro to Location Intelligence and GeoMesa Spatial Data Types, Spatial SQL Extending Spark Catalyst for OptimizedSpatial SQL Density of activity in San Francisco Speed profile of San Francisco
- 40. Optimizing Spatial SQL SELECT activity_id,user_id,geom,dtg FROM activities WHERE st_contains(st_makeBBOX(-78,37,-77,38),geom) AND dtg > cast(‘2017-06-01’ as timestamp) AND dtg < cast(‘2017-06-05’ as timestamp)
- 41. Optimizing Spatial SQL SELECT activity_id,user_id,geom,dtg FROM activities WHERE st_contains(st_makeBBOX(-78,37,-77,38),geom) AND dtg > cast(‘2017-06-01’ as timestamp) AND dtg < cast(‘2017-06-05’ as timestamp) Only load partitions that have records that intersect the query geometry.
- 42. Extending Spark’s Catalyst Optimizer https://databricks.com/blog/2015/04/13/deep-dive-into-spark-sqls-catalyst-optimizer.html
- 43. Extending Spark’s Catalyst Optimizer https://databricks.com/blog/2015/04/13/deep-dive-into-spark-sqls-catalyst-optimizer.html Catalyst exposes hooks to insert optimization rules in various points in the query processing logic.
- 44. Extending Spark’s Catalyst Optimizer /** * :: Experimental :: * A collection of methods that are consideredexperimental,but canbe used tohook into * the query plannerforadvanced functionality. * * @group basic * @since 1.3.0 */ @Experimental @transient @InterfaceStability.Unstable def experimental: ExperimentalMethods = sparkSession.experimental
- 45. SQL optimizations for Spatial Predicates SELECT activity_id,user_id,geom,dtg FROM activities WHERE st_contains(st_makeBBOX(-78,37,-77,38),geom) AND dtg > cast(‘2017-06-01’ as timestamp) AND dtg < cast(‘2017-06-05’ as timestamp)
- 46. SQL optimizations for Spatial Predicates SELECT activity_id,user_id,geom,dtg FROM activities WHERE st_contains(st_makeBBOX(-78,37,-77,38),geom) AND dtg > cast(‘2017-06-01’ as timestamp) AND dtg < cast(‘2017-06-05’ as timestamp) GeoMesa Relation
- 47. SQL optimizations for Spatial Predicates SELECT activity_id,user_id,geom,dtg FROM activities WHERE st_contains(st_makeBBOX(-78,37,-77,38),geom) AND dtg > cast(‘2017-06-01’ as timestamp) AND dtg < cast(‘2017-06-05’ as timestamp) Relational Projection
- 48. SQL optimizations for Spatial Predicates SELECT activity_id,user_id,geom,dtg FROM activities WHERE st_contains(st_makeBBOX(-78,37,-77,38),geom) AND dtg > cast(‘2017-06-01’ as timestamp) AND dtg < cast(‘2017-06-05’ as timestamp) Topological Predicate
- 49. SQL optimizations for Spatial Predicates SELECT activity_id,user_id,geom,dtg FROM activities WHERE st_contains(st_makeBBOX(-78,37,-77,38),geom) AND dtg > cast(‘2017-06-01’ as timestamp) AND dtg < cast(‘2017-06-05’ as timestamp) Geometry Literal
- 50. SQL optimizations for Spatial Predicates SELECT activity_id,user_id,geom,dtg FROM activities WHERE st_contains(st_makeBBOX(-78,37,-77,38),geom) AND dtg > cast(‘2017-06-01’ as timestamp) AND dtg < cast(‘2017-06-05’ as timestamp) Date range predicate
- 51. SQL optimizations for Spatial Predicates object STContainsRule extendsRule[LogicalPlan]with PredicateHelper{ override defapply(plan: LogicalPlan): LogicalPlan ={ plan.transform{ case filt @ Filter(f, lr@LogicalRelation(gmRel: GeoMesaRelation,_,_)) => … val relation =gmRel.copy(filt =ff.and(gtFilters:+gmRel.filt)) lr.copy(expectedOutputAttributes=Some(lr.output), relation =relation) } }
- 52. SQL optimizations for Spatial Predicates object STContainsRule extendsRule[LogicalPlan]with PredicateHelper{ override defapply(plan: LogicalPlan): LogicalPlan ={ plan.transform{ case filt @ Filter(f, lr@LogicalRelation(gmRel: GeoMesaRelation,_,_)) => … val relation =gmRel.copy(filt =ff.and(gtFilters:+gmRel.filt)) lr.copy(expectedOutputAttributes=Some(lr.output), relation =relation) } } Intercept a Filter on a GeoMesa Logical Relation
- 53. SQL optimizations for Spatial Predicates object STContainsRule extendsRule[LogicalPlan]with PredicateHelper{ override defapply(plan: LogicalPlan): LogicalPlan ={ plan.transform{ case filt @ Filter(f, lr@LogicalRelation(gmRel: GeoMesaRelation,_,_)) => … val relation =gmRel.copy(filt =ff.and(gtFilters:+gmRel.filt)) lr.copy(expectedOutputAttributes=Some(lr.output), relation =relation) } } Extract the predicates that can be handled by GeoMesa, create a new GeoMesa relation with the predicates pushed down into the scan,and return a modified tree with the new relation and the filter removed. GeoMesa will compute the minimal ranges necessary to cover the query region.
- 54. SQL optimizations for Spatial Predicates Relational Projection Filter GeoMesa Relation
- 55. SQL optimizations for Spatial Predicates Relational Projection Filter GeoMesa Relation Relational Projection GeoMesa Relation <topo predicate>
- 56. SQL optimizations for Spatial Predicates Relational Projection Filter GeoMesa Relation Relational Projection GeoMesa Relation <topo predicate> GeoMesa Relation <topo predicate> <relational projection>
- 57. SQL optimizations for Spatial Predicates SELECT activity_id,user_id,geom,dtg FROM activities WHERE st_contains(st_makeBBOX(-78,37,-77,38),geom) AND dtg > cast(‘2017-06-01’ as timestamp) AND dtg < cast(‘2017-06-05’ as timestamp)
- 58. SQL optimizations for Spatial Predicates SELECT * FROM activities<pushdown filter and projection>
- 59. SQL optimizations for Spatial Predicates SELECT * FROM activities<pushdown filter and projection> Reduced I/O, reduced networkoverhead, reduced compute load - faster Location Intelligence answers
- 60. Intro to Location Intelligence and GeoMesa Spatial Data Types, Spatial SQL Extending Spark Catalyst for Optimized Spatial SQL Density of activity in San Francisco Speed profile of San Francisco
- 61. SELECT geohash, count(geohash)as count FROM ( SELECT st_geohash(geom,35) as geohash FROM sf WHERE st_contains(st_makeBBOX(-122.4194-1,37.77-1,-122.4194+1,37.77+1), geom) ) GROUP BY geohash 1. Constrain to San Francisco 2. Snap location to 35 bit geohash 3. Group by geohash and count records per geohash Density of Activity in San Francisco
- 62. SELECT geohash, count(geohash)as count FROM ( SELECT st_geohash(geom,35) as geohash FROM sf WHERE st_contains(st_makeBBOX(-122.4194-1,37.77-1,-122.4194+1,37.77+1), geom) ) GROUP BY geohash 1. Constrain to San Francisco 2. Snap location to 35 bit geohash 3. Group by geohash and count records per geohash Density of Activity in San Francisco
- 63. 1. Constrain to San Francisco 2. Snap location to 35 bit geohash 3. Group by geohash and count records per geohash Density of Activity in San Francisco SELECT geohash, count(geohash)as count FROM ( SELECT st_geohash(geom,35) as geohash FROM sf WHERE st_contains(st_makeBBOX(-122.4194-1,37.77-1,-122.4194+1,37.77+1), geom) ) GROUP BY geohash
- 64. SELECT geohash, count(geohash)as count FROM ( SELECT st_geohash(geom,35) as geohash FROM sf WHERE st_contains(st_makeBBOX(-122.4194-1,37.77-1,-122.4194+1,37.77+1), geom) ) GROUP BY geohash 1. Constrain to San Francisco 2. Snap location to 35 bit geohash 3. Group by geohash and count records per geohash Density of Activity in San Francisco
- 65. Density of Activity in San Francisco 1. Constrain to San Francisco 2. Snap location to 35 bit geohash 3. Group by geohash and count records per geohash
- 66. Visualize using Jupyter and Bokeh Density of Activity in San Francisco p = figure(title="STRAVA", plot_width=900,plot_height=600, x_range=x_range,y_range=y_range) p.add_tile(tonerlines) p.circle(x=projecteddf['px'], y=projecteddf['py'], fill_alpha=0.5, size=6, fill_color=colors, line_color=colors) show(p)
- 67. Visualize using Jupyter and Bokeh Density of Activity in San Francisco
- 68. Speed Profile of a Metro Area Inputs STRAVA Activities An activity is sampled once per second Each observation has a location and time { "type": "Feature", "geometry": { "type": "Point", "coordinates": [-122.40736,37.807147] }, "properties": { "activity_id": "**********************", "athlete_id": "**********************", "device_type": 5, "activity_type": "Ride", "frame_type": 2, "commute": false, "date": "2016-11-02T23:58:03", "index": 0 }, "id": "6a9bb90497be6f64eae009e6c760389017bc31db:0" }
- 69. SELECT activity_id, index, geom as s, lead(geom) OVER (PARTITION BY activity_idORDER by dtgasc) as e, dtg as start, lead(dtg) OVER (PARTITIONBY activity_idORDER by dtgasc) as end FROM activities WHERE activity_type = 'Ride' AND st_contains( st_makeBBOX(-122.4194-1,37.77-1,-122.4194+1,37.77+1), geom) ORDER BY dtg ASC 1. Select all activities within metro area 2. Sort activity by dtg ascending 3. Window over each set of consecutive samples 4. Create a temporary table Speed Profile of a Metro Area
- 70. 1. Select all activities within metro area 2. Sort activity by dtg ascending 3. Window over each set of consecutive samples 4. Create a temporary table Speed Profile of a Metro Area SELECT activity_id, index, geom as s, lead(geom) OVER (PARTITION BY activity_idORDER by dtgasc) as e, dtg as start, lead(dtg) OVER (PARTITIONBY activity_idORDER by dtgasc) as end FROM activities WHERE activity_type = 'Ride' AND st_contains( st_makeBBOX(-122.4194-1,37.77-1,-122.4194+1,37.77+1), geom) ORDER BY dtg ASC
- 71. 1. Select all activities within metro area 2. Sort activity by dtg ascending 3. Window over each set of consecutive samples 4. Create a temporary table Speed Profile of a Metro Area SELECT activity_id, index, geom as s, lead(geom) OVER (PARTITION BY activity_idORDER by dtgasc) as e, dtg as start, lead(dtg) OVER (PARTITIONBY activity_idORDER by dtgasc) as end FROM activities WHERE activity_type = 'Ride' AND st_contains( st_makeBBOX(-122.4194-1,37.77-1,-122.4194+1,37.77+1), geom) ORDER BY dtg ASC
- 72. 1. Select all activities within metro area 2. Sort activity by dtg ascending 3. Window over each set of consecutive samples 4. Create a temporary table Speed Profile of a Metro Area SELECT activity_id, index, geom as s, lead(geom) OVER (PARTITION BY activity_idORDER by dtgasc) as e, dtg as start, lead(dtg) OVER (PARTITIONBY activity_idORDER by dtgasc) as end FROM activities WHERE activity_type = 'Ride' AND st_contains( st_makeBBOX(-122.4194-1,37.77-1,-122.4194+1,37.77+1), geom) ORDER BY dtg ASC
- 73. spark.sql(“”” SELECT activity_id, index, geom as s, lead(geom) OVER (PARTITION BY activity_idORDER by dtgasc) as e, dtg as start, lead(dtg) OVER (PARTITIONBY activity_idORDER by dtgasc) as end FROM activities WHERE activity_type = 'Ride' AND st_contains( st_makeBBOX(-122.4194-1,37.77-1,-122.4194+1,37.77+1), geom) ORDER BY dtg ASC “””).createOrReplaceTempView(“segments”) 1. Select all activities within metro area 2. Sort activity by dtg ascending 3. Window over each set of consecutive samples 4. Create a temporary table Speed Profile of a Metro Area
- 74. 1. Select all activities within metro area 2. Sort activity by dtg ascending 3. Window over each set of consecutive samples 4. Create a temporary table Speed Profile of a Metro Area
- 75. SELECT st_geohash(s,35)as gh, st_distanceSpheroid(s, e)/ cast(cast(end as long)-cast(startas long)as double) as meters_per_second FROM segments 5. Compute the distance between consecutive points 6. Compute the time difference between consecutive points 7. Compute the speed 8. Snap the location to a grid based on a GeoHash 9. Create a temporary table Speed Profile of a Metro Area
- 76. SELECT st_geohash(s,35)as gh, st_distanceSpheroid(s, e)/ cast(cast(end as long)-cast(startas long)as double) as meters_per_second FROM segments 5. Compute the distance between consecutive points 6. Compute the time difference between consecutive points 7. Compute the speed 8. Snap the location to a grid based on a GeoHash 9. Create a temporary table Speed Profile of a Metro Area
- 77. SELECT st_geohash(s,35)as gh, st_distanceSpheroid(s, e)/ cast(cast(end as long)-cast(startas long)as double) as meters_per_second FROM segments 5. Compute the distance between consecutive points 6. Compute the time difference between consecutive points 7. Compute the speed 8. Snap the location to a grid based on a GeoHash 9. Create a temporary table Speed Profile of a Metro Area
- 78. SELECT st_geohash(s,35)as gh, st_distanceSpheroid(s, e)/ cast(cast(end as long)-cast(startas long)as double) as meters_per_second FROM segments 5. Compute the distance between consecutive points 6. Compute the time difference between consecutive points 7. Compute the speed 8. Snap the location to a grid based on a GeoHash 9. Create a temporary table Speed Profile of a Metro Area
- 79. spark.sql(“”” SELECT st_geohash(s,35)as gh, st_distanceSpheroid(s, e)/ cast(cast(end as long)-cast(startas long)as double) as meters_per_second FROM segments “””).createOrReplaceTempView(“gridspeeds”) 5. Compute the distance between consecutive points 6. Compute the time difference between consecutive points 7. Compute the speed 8. Snap the location to a grid based on a GeoHash 9. Create a temporary table Speed Profile of a Metro Area
- 80. 5. Compute the distance between consecutive points 6. Compute the time difference between consecutive points 7. Compute the speed 8. Snap the location to a grid based on a GeoHash 9. Create a temporary table Speed Profile of a Metro Area
- 81. SELECT st_centroid(st_geomFromGeoHash(gh,35))as p, percentile_approx(meters_per_second,0.5) as avg_meters_per_second, stddev(meters_per_second) as std_dev FROM gridspeeds GROUP BY gh 10. Group the grid cells 11. For each grid cell, compute the median and standard deviation of the speed 12. Extract the location of the grid cell Speed Profile of a Metro Area
- 82. SELECT st_centroid(st_geomFromGeoHash(gh,35))as p, percentile_approx(meters_per_second,0.5) as med_meters_per_second, stddev(meters_per_second) as std_dev FROM gridspeeds GROUP BY gh 10. Group the grid cells 11. For each grid cell, compute the median and standard deviation of the speed 12. Extract the location of the grid cell Speed Profile of a Metro Area
- 83. SELECT st_centroid(st_geomFromGeoHash(gh,35))as p, percentile_approx(meters_per_second,0.5) as avg_meters_per_second, stddev(meters_per_second) as std_dev FROM gridspeeds GROUP BY gh 10. Group the grid cells 11. For each grid cell, compute the median and standard deviation of the speed 12. Extract the location of the grid cell Speed Profile of a Metro Area
- 84. 10. Group the grid cells 11. For each grid cell, compute the median and standard deviation of the speed 12. Extract the location of the grid cell Speed Profile of a Metro Area
- 85. p = figure(title="STRAVA", plot_width=900,plot_height=600, x_range=x_range,y_range=y_range) p.add_tile(tonerlines) p.circle(x=projecteddf['px'], y=projecteddf['py'], fill_alpha=0.5, size=6, fill_color=colors, line_color=colors) show(p) Visualize using Jupyter and Bokeh Speed Profile of a Metro Area
- 86. Speed Profile of a Metro Area
- 87. Speed Profile of a Metro Area
- 89. Indexing Spatio-Temporal Data in Bigtable Moscone Centercoordinates 37.7839°N,122.4012°W
- 90. Indexing Spatio-Temporal Data in Bigtable • Bigtable clones have a single dimension lexicographic sorted index Moscone Centercoordinates 37.7839°N,122.4012°W
- 91. Indexing Spatio-Temporal Data in Bigtable • Bigtable clones have a single dimension lexicographic sorted index • What if we concatenated latitude and longitude? Moscone Centercoordinates 37.7839°N,122.4012°W Row Key 37.7839,-122.4012
- 92. Indexing Spatio-Temporal Data in Bigtable • Bigtable clones have a single dimension lexicographic sorted index • What if we concatenated latitude and longitude? • Fukushima sorts lexicographically near Moscone Center because they have the same latitude Moscone Centercoordinates 37.7839°N,122.4012°W Row Key 37.7839,-122.4012 37.7839,140.4676
- 93. Space-filling Curves 2-D Z-orderCurve 2-D Hilbert Curve
- 94. Space-filling curve example Moscone Center coordinates 37.7839° N, 122.4012° W Encode coordinates to a 32 bit Z
- 95. Space-filling curve example Moscone Center coordinates 37.7839° N, 122.4012° W Encode coordinates to a 32 bit Z 1. Scale latitude and longitude to use 16 available bits each scaled_x = (-122.4012 + 180)/360 * 2^16 = 10485 scaled_y = (37.7839 + 90)/180 * 2^16 = 46524
- 96. Space-filling curve example Moscone Center coordinates 37.7839° N, 122.4012° W Encode coordinates to a 32 bit Z 1. Scale latitude and longitude to use 16 available bits each scaled_x = (-122.4012 + 180)/360 * 2^16 = 10485 scaled_y = (37.7839 + 90)/180 * 2^16 = 46524 1. Take binary representation of scaled coordinates bin_x = 0010100011110101 bin_y = 1011010110111100
- 97. Space-filling curve example Moscone Center coordinates 37.7839° N, 122.4012° W Encode coordinates to a 32 bit Z 1. Scale latitude and longitude to use 16 available bits each scaled_x = (-122.4012 + 180)/360 * 2^16 = 10485 scaled_y = (37.7839 + 90)/180 * 2^16 = 46524 1. Take binary representation of scaled coordinates bin_x = 0010100011110101 bin_y = 1011010110111100 1. Interleave bits of x and y and convert back to an integer bin_z = 01001101100100011110111101110010 z = 1301409650
- 98. Space-filling curve example Moscone Center coordinates 37.7839° N, 122.4012° W Encode coordinates to a 32 bit Z 1. Scale latitude and longitude to use 16 available bits each scaled_x = (-122.4012 + 180)/360 * 2^16 = 10485 scaled_y = (37.7839 + 90)/180 * 2^16 = 46524 1. Take binary representation of scaled coordinates bin_x = 0010100011110101 bin_y = 1011010110111100 1. Interleave bits of x and y and convert back to an integer bin_z = 01001101100100011110111101110010 z = 1301409650 Distance preserving hash
- 99. Space-filling curves linearize a multi-dimensional space Bigtable Index [0,2^32] 1301409650 4294967296 0
- 100. Regions translate to range scans Bigtable Index [0,2^32] 1301409657 1301409650 0 4294967296 scan ‘geomesa’,{STARTROW=> 1301409650,ENDROW=> 1301409657}
- 101. ADS-B
- 103. Provisioning Spatial RDDs params = { "instanceId": "geomesa", "zookeepers": "X.X.X.X", "user": "user", "password": "******", "tableName": "geomesa.strava" } spark .read .format("geomesa") .options(**params) .option("geomesa.feature", "activities") .load() Accumulo
- 104. Provisioning Spatial RDDs params = { "bigtable.table.name": "geomesa.strava" } spark .read .format("geomesa") .options(**params) .option("geomesa.feature", "activities") .load() HBase and Bigtable
- 105. Provisioning Spatial RDDs params = { "geomesa.converter": "strava", "geomesa.input": "s3://path/to/data/*.json.gz" } spark .read .format("geomesa") .options(**params) .option("geomesa.feature", "activities") .load() Flat files
- 106. Speed Profile of a Metro Area
- 107. Speed Profile of a Metro Area
- 108. The Dream
- 109. Speed Profile of a Metro Area Inputs Approach ● Select all activities within metro area ● Sort each activity by dtg ascending ● Window over each set of consecutive samples ● Compute summary statistics of speed ● Group by grid cell ● Visualize