


![• Row-based format represented by key-value
pairs in a partially structured format.
• eg.
{”ID”:1,”Name”:”Luke”,Interests”:[”Psychology”]}
{”ID”:2,”Name”:”Yuki”,”Interests”:[”Ballet”,
“Travelling”]}
• Compressible
• Supports schema evolution
SOME USEFUL DATA FILE FORMATS
• Row-based format.
• record delimiter- newline, Header- Optional.
• Does not support block compression.
• Special encoding like UTF8 to display the
non-ASCIII chars in the file.
01
CSV (Comma-separated Values)
02
JSON (JavaScript Object Notation)
HDF5 (Hierarchical Data Form version 5)
04
03
• Columnar format developed by Cloudera
and Twitter. Only the required columns
are read reducing disk I/O.
• Stores data in the form of binary files.
• Parquet files are splittable.
• Support block and file level
compression.
Parquet
• Open-source file format that supports large,
complex, and heterogeneous data with its
“directory-like” grouping mechanism.
• store and modify compressed data i.e. Fast I/O](https://image.slidesharecdn.com/groupb-pandas-240629161109-8c372780/85/Group-B-Pandas-Pandas-is-a-powerful-Python-library-that-provides-high-performance-easy-to-use-data-structures-and-data-analysis-tools-It-is-built-on-top-of-the-NumPy-library-and-is-designed-to-make-working-with-data-both-easy-and-efficient-pptx-14-320.jpg)


![• Logical operators in Python pandas are used to combine or modify conditions when
filtering and querying data within DataFrame objects.
• Logical operators, including AND (&), OR (|), and NOT (~), play a crucial role in creating
complex conditions for data selection.
• Example: df[(df['column1'] > 50) & (df['column2'] == 'value')] selects rows where 'column1'
is greater than 50 and 'column2' is equal to 'value'.
Logical Operators in Pandas](https://image.slidesharecdn.com/groupb-pandas-240629161109-8c372780/85/Group-B-Pandas-Pandas-is-a-powerful-Python-library-that-provides-high-performance-easy-to-use-data-structures-and-data-analysis-tools-It-is-built-on-top-of-the-NumPy-library-and-is-designed-to-make-working-with-data-both-easy-and-efficient-pptx-43-320.jpg)
![• The iloc indexer in pandas is used for integer-location based indexing, allowing you to
select data from a DataFrame based on its numerical position in the DataFrame. It is
primarily used for selecting rows and columns by their integer indices.
• Example: df.iloc[2:5, 0:3] selects rows 2 to 4 and columns 0 to 2.
iloc in Pandas](https://image.slidesharecdn.com/groupb-pandas-240629161109-8c372780/85/Group-B-Pandas-Pandas-is-a-powerful-Python-library-that-provides-high-performance-easy-to-use-data-structures-and-data-analysis-tools-It-is-built-on-top-of-the-NumPy-library-and-is-designed-to-make-working-with-data-both-easy-and-efficient-pptx-45-320.jpg)


Group B - Pandas Pandas is a powerful Python library that provides high-performance, easy-to-use data structures and data analysis tools. It is built on top of the NumPy library and is designed to make working with data both easy and efficient..pptx
- 1. UNIVERSITY OF DELHI PANDAS DEPARTMENT OF OPERATIONAL RESEARCH PYTHON B TEAM SUBMITTED TO – DR. ADARSH ANAND
- 2. TEAM - B MEMBERS • SHIVAM KUMAR • RAMASHISH KUMAR • NANDUNAM SAI KUIMAR • ANUSHA SINGH • GAURAV • SURABHI • SUDIN JANA • RIJUL ANAND • PRIYA RAWAT • AKASH BALIYAN • AADARSH GAUTAM • HARSHIT • PAWAN KUMAR • HIMANSHU • RAHUL NAGLE • ALBIN GEO
- 3. CONTENTS • Introduction to Pandas • Basics of Dataframe • Import of Data • Functions of Dataframe • Data Extraction • Creating charts for Dataframe
- 4. INTRODUCTION TO PANDAS Pandas is a powerful Python library that provides high-performance, easy-to-use data structures and data analysis tools. It is built on top of the NumPy library and is designed to make working with data both easy and efficient. Pandas is a popular choice for data analysis because it offers a wide range of features, including: • DataFrame • Series • Indexing • Data manipulation • Time series • Plotting
- 6. What is a DataFrame? A DataFrame is a two-dimensional, tabular data structure in the Pandas library for Python. It is similar to a spreadsheet or a SQL table, where data is organized in rows and columns. The DataFrame provides a powerful and flexible way to manipulate, analyze, and visualize structured data. Key characteristics of a Pandas DataFrame – • Two-Dimensional Structure • Column Names and Index • Heterogeneous Data Types • Flexibility in Data Operations • Integration with Other Libraries • Data Input and Output
- 7. Series VS DataFrame In Pandas, a Series is a one-dimensional labeled array, whereas a DataFrame is a two- dimensional labeled data structure with columns of potentially different types. Some key differences between the two include: • Shape • Data types • Indexing • Operations E.g., a Series can be used to represent a single column of data, such as the heights of a group of people, while a DataFrame can be used to represent a table of data, such as the results of a survey.
- 8. • Creating from a Dictionary: Creating a DataFrame • Creating from a List of Dictionaries: • Reading from External Sources:
- 9. Adding Rows and Columns • Adding a new row to the DataFrame: • Adding a new column to the DataFrame:
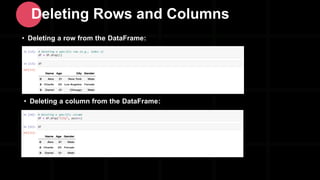
- 10. • Deleting a column from the DataFrame: Deleting Rows and Columns • Deleting a row from the DataFrame:
- 11. Import of Data
- 12. DATA FILE FORMATS TYPES OF FILE FORMATS UTILITY PERFORMANCE
- 13. • Storage and processing • Continuously evolving schema. • Time taken to read from one loc and write to another loc. • Row /Columnar Based • read/write heavy workloads splitable • Support schema evolution • Compression
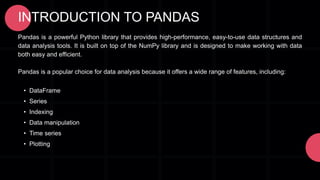
- 14. • Row-based format represented by key-value pairs in a partially structured format. • eg. {”ID”:1,”Name”:”Luke”,Interests”:[”Psychology”]} {”ID”:2,”Name”:”Yuki”,”Interests”:[”Ballet”, “Travelling”]} • Compressible • Supports schema evolution SOME USEFUL DATA FILE FORMATS • Row-based format. • record delimiter- newline, Header- Optional. • Does not support block compression. • Special encoding like UTF8 to display the non-ASCIII chars in the file. 01 CSV (Comma-separated Values) 02 JSON (JavaScript Object Notation) HDF5 (Hierarchical Data Form version 5) 04 03 • Columnar format developed by Cloudera and Twitter. Only the required columns are read reducing disk I/O. • Stores data in the form of binary files. • Parquet files are splittable. • Support block and file level compression. Parquet • Open-source file format that supports large, complex, and heterogeneous data with its “directory-like” grouping mechanism. • store and modify compressed data i.e. Fast I/O
- 15. SUMMARY SOURCE : https://aaltoscicomp.github.io/python-for-scicomp/data-formats/
- 16. SOURCE : https://aaltoscicomp.github.io/python-for-scicomp/data-formats/ PERFORMANCE
- 17. IMPORT THE DATASET • IMPORT THE DATASET USING PANDAS’ read_*{fileExtension} Eg: read_csv(filename), read_json(filename)
- 20. Working with CSV files • Loading pandas library • Reading CSV file • Displaying DataFrame • Output
- 21. The info() method prints information about the DataFrame.The information contains the number of columns, column labels, column data types, memory usage, range index, and the number of cells in each column (non-null values). Syntax – dataframe.info(verbose,buf,max_cols,memory_usage,show_counts,null_counts) Pandas DataFrame info() Method
- 22. Return Value None. The info() method does not return any value, it prints the information. • Using Info function • OUTPUT
- 23. • Checking No. of row and columns • Finding Size of Dataframe • Examine the dimension of the dataframe Some Basic Information Functions of Dataframe • OUTPUT
- 24. Functions Description Functions Description pd.DataFrame() Creates a new DataFrame. df.append(new_row) Adds a new row to the DataFrame. df.head(n) Returns the first ‘n’ rows of the DataFrame. df.merge(df2) Merges two DataFrames based on a common column. df.tail(n) Returns the last n rows of the DataFrame. df.isnull() Returns a DataFrame of the same shape as df with True and False values indicating missing values. df.info() Provides a concise summary of the DataFrame. df.dropna() Drops rows containing any missing values. df.describe() Generates descriptive statistics of numeric columns. df.fillna(value) Fills missing values with a specified value. df.columns Returns the column labels of the DataFrame. df.pivot_table() Creates a spreadsheet-style pivot table. df.index Returns the row labels of the DataFrame. df.rename(columns={'old_name': 'new_name'}) Renames columns. df.dtypes Returns the data types of each column. df.shape Returns a tuple representing the dimensions of the DataFrame. df.values Returns a Numpy representation of the DataFrame. df.groupby('col').agg(func) Groups DataFrame by a column and applies an aggregation function. df.drop(index) Deletes a row by index. df.sort_values('col') Sorts DataFrame by values in a specific column. DataFrame Functions and Methods
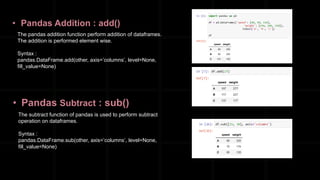
- 26. • Pandas Addition : add() The pandas addition function perform addition of dataframes. The addition is performed element wise. Syntax : pandas.DataFrame.add(other, axis=’columns’, level=None, fill_value=None) • Pandas Subtract : sub() The subtract function of pandas is used to perform subtract operation on dataframes. Syntax : pandas.DataFrame.sub(other, axis=’columns’, level=None, fill_value=None)
- 27. • Pandas Multiply : mul() The multiplication function of pandas is used to perform multiplication operations on dataframes. Syntax : pandas.DataFrame.mul(other, axis=’columns’, level=None, fill_value=None) • Pandas Division : div() The division function of pandas is used to perform division operation on dataframes. Syntax : pandas.DataFrame.div(other, axis=’columns’, level=None, fill_value=None)
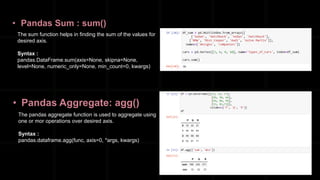
- 28. • Pandas Sum : sum() The sum function helps in finding the sum of the values for desired axis. Syntax : pandas.DataFrame.sum(axis=None, skipna=None, level=None, numeric_only=None, min_count=0, kwargs) • Pandas Aggregate: agg() The pandas aggregate function is used to aggregate using one or mor operations over desired axis. Syntax : pandas.dataframe.agg(func, axis=0, *args, kwargs)
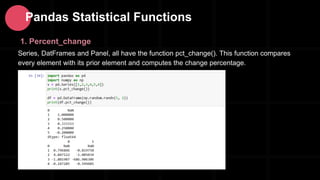
- 29. 1. Percent_change Series, DatFrames and Panel, all have the function pct_change(). This function compares every element with its prior element and computes the change percentage. Pandas Statistical Functions
- 30. 2. Covariance Covariance is applied on series data. The Series object has a method cov to compute covariance between series objects. NA will be excluded automatically. 3. Correlation Correlation shows the linear relationship between any two array of values (series). There are multiple methods to compute the correlation like pearson(default), spearman and kendall.
- 31. Sort Functions
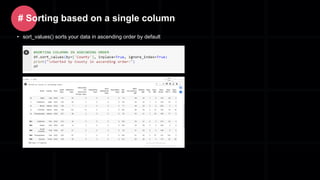
- 32. Sorting in Pandas refers to the process of arranging the elements (rows or columns) of a DataFrame or Series in a specified order based on the values they contain. The primary purpose of sorting is to organize the data in a structured way, making it easier to analyze and interpret. Pandas provides the ‘sort_values()’ function for sorting DataFrame rows based on one or more columns, and it also offers methods like ‘sort_index()’ for sorting based on the index. • Sort by value – You use .sort_values() to sort values in a DataFrame along either axis (columns or rows). Typically, you want to sort the rows in a DataFrame by the values of one or more columns. • Sort by index – You use .sort_index() to sort a DataFrame by its row index or column labels. The difference from using .sort_values() is that you’re sorting the DataFrame based on its row index or column names, not by the values in these rows or columns. Sorting
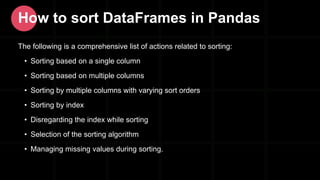
- 33. The following is a comprehensive list of actions related to sorting: • Sorting based on a single column • Sorting based on multiple columns • Sorting by multiple columns with varying sort orders • Sorting by index • Disregarding the index while sorting • Selection of the sorting algorithm • Managing missing values during sorting. How to sort DataFrames in Pandas
- 34. • sort_values() sorts your data in ascending order by default # Sorting based on a single column
- 35. # Sorting based on multiple columns # Sorting by multiple columns with varying sort orders
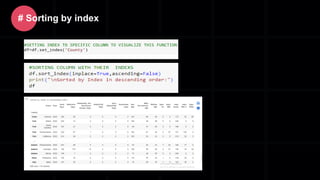
- 36. # Sorting by index
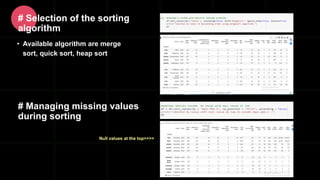
- 37. • Available algorithm are merge sort, quick sort, heap sort # Selection of the sorting algorithm # Managing missing values during sorting Null values at the top>>>>
- 38. Data Extraction
- 39. In the context of Pandas, data extraction refers to the process of retrieving specific subsets of data from a larger dataset based on certain criteria or conditions. The Pandas library provides several methods and functions for efficiently extracting and filtering data from DataFrames. Why Pandas for Data Extraction? 1. Tabular Data Handling 2. Data Cleaning 3. Powerful Data Structures 4. Integration with NumPy 5. Wide Range of I/O Functions What is Data Extraction?
- 40. There are many ways to extract data from a Pandas DataFrame. Here are a few examples: • Using the loc attribute • Using the iloc attribute • Using the at attribute • Using the iat attribute • Using the get method Ways to Extract Data in Pandas
- 41. • Relational operators are used for making comparisons in Pandas. • They are often used for filtering and querying data within DataFrame objects. DataFrame is a two-dimensional, size-mutable, and potentially heterogeneous tabular data structure with labeled axes (rows and columns). • Relational operators in pandas are used to create boolean masks, which are then used to filter rows of a DataFrame based on specified conditions. • Common operators: <, >, <=, >=, ==, !=. Relational Operators in Pandas
- 42. • Using Relational Operator to extract specific data EXAMPLE • OUTPUT
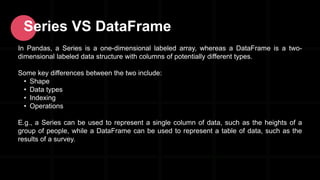
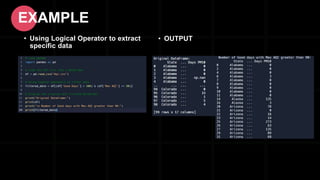
- 43. • Logical operators in Python pandas are used to combine or modify conditions when filtering and querying data within DataFrame objects. • Logical operators, including AND (&), OR (|), and NOT (~), play a crucial role in creating complex conditions for data selection. • Example: df[(df['column1'] > 50) & (df['column2'] == 'value')] selects rows where 'column1' is greater than 50 and 'column2' is equal to 'value'. Logical Operators in Pandas
- 44. EXAMPLE • Using Logical Operator to extract specific data • OUTPUT
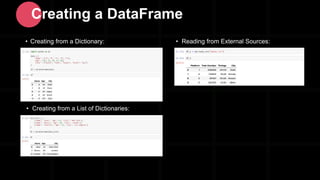
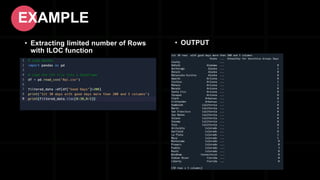
- 45. • The iloc indexer in pandas is used for integer-location based indexing, allowing you to select data from a DataFrame based on its numerical position in the DataFrame. It is primarily used for selecting rows and columns by their integer indices. • Example: df.iloc[2:5, 0:3] selects rows 2 to 4 and columns 0 to 2. iloc in Pandas
- 46. • Extracting limited number of Rows with ILOC function EXAMPLE • OUTPUT
- 48. WHY DO WE MAKE CHARTS ?
- 49. Line plot Bar diagram Histogram Box plot Area plot
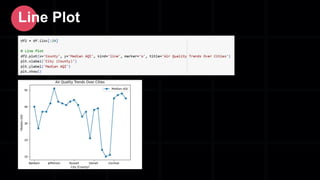
- 50. Line Plot
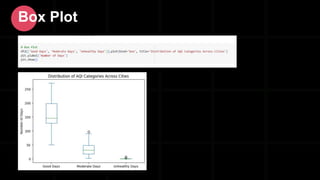
- 51. Box Plot
- 52. Area Plot
- 53. Histogram
- 54. Bar Diagram
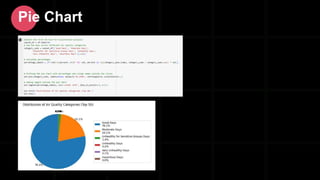
- 55. Pie Chart
- 56. PROBLEMS
- 57. • Consider this... • Guess the output ? 1. 2.
- 58. ANSWER “Two identical things do not exist at all.” 1 2
- 59. Q&A TIME
- 60. THANK YOU!