SlideShare a Scribd company logo
Growing Intelligence by Properly Storing and
               Mining Call Center Data

                            AGENDA
•   Today’s Data Challenge in the Call Center Environment
•   The Difference Between Data Storage and Data Warehouse
•   Steps to Create a Quality Warehouse
     • Data Mapping
     • Data Discovery
     • Data Cleaning
     • Export to Warehouse
•   How to Determine Customer Base
•   Future Benefits of Having a Warehouse
•   Data Mining
•   Statistics for Mortals
•   Final Thoughts and Questions
Data Overflow
                                 Corporate Sales


              International
                                                    Switch (Avaya)
           (Different Systems)


                                                                       HR Data
Agent Surveys
                                                                     (PeopleSoft)


  Financials
                                                                     Email (Kana)
(Accounting)


                 Forecasting &
                                                      Workforce
                   Planning
                                                   Management (IEX)
                (CenterBridge)
                                  External Data
                                 (Benchmarking)
What is a Data Warehouse

 Centralize all data that can be used for information
    in one location.
   Data should be audited.
   Data should allow the same timespan.
   Data should have all calculations finalized or
    defined.
   Data should be standardized or have support tables
    that allow for standardization.
   It should be scalable.
   It Should address the users’ needs.
Steps to Create a Data Warehouse

           Corporate Data Mapping

 Close Internal (Own Department)
 Distant Internal (Other Departments)
 Close External (Corporate)
 Distant External (Outsourced or International)
 External – Non-Generated (Benchmarking,
 government)
   http://research.stlouisfed.org/fred2/
Steps to Create a Data Warehouse

           Corporate Data Mapping: Close Internal

•   What data sources (database, report from the web, excel)
•   Attempt to get data from the first data source (avoid
    pulling data from the web, excel spreadsheets etc.).
•   What type of data (identification)
•   How is it currently used (purpose)
•   Who is currently using the data (audience)
•   Who is currently owning the data (manager)
Steps to Create a Data Warehouse

                   Owner: John
                    Johnson,
                    Telecom,
                     Omaha


    Purpose /                      Users: Call
                      IEX or
   Definition of                     Center
                   CenterBridge
       data                       Management


                   Stand-alone
                   or composite
Steps to Create a Data Warehouse

                     Data Mapping /Discovery
•   Owner:
    •   get access to data
    •   ask questions about format and usage
•   Users:
    •   how do they use the data
    •   what is missing (important!)
    •   timeframe needed
• Purpose / Definition:
    •   type of tables
    •   understand the fields
• Stand-alone or composite:
    •   is the data we need in one table, or
    •   do we need to combine tables to get the result
Steps to Create a Data Warehouse

 Data Cleaning
    Purpose of Data
    Weed Out “Waste”
    Determine Unique Links (Database Keys)
    Determine Time Frame
 Determine Calculated Fields
    Can be done at extraction
    Danger is that people may use different
     formulas
Steps to Create a Data Warehouse

 Create Link (or Support) tables.
    Date
    Skill / VDN / Vector Dictionary
 Create Schema
 Determine Redundant Data
    Keep the table that is easiest to extract
    The table that has a stable extract
 Create Audit Tables
Steps to Create a Data Warehouse
                             Date Link Table Example
 txtDate ntxtDate   Date    Year Month Week WeekDay Period PdWeek OTR
4/1/2012    41000 4/1/2012 2012      4   14 Sunday       4      2   2
4/2/2012    41001 4/2/2012 2012      4   14 Monday       4      2   2
4/3/2012    41002 4/3/2012 2012      4   14 Tuesday      4      2   2
4/4/2012    41003 4/4/2012 2012      4   14 Wednesday    4      2   2
4/5/2012    41004 4/5/2012 2012      4   14 Thursday     4      2   2
4/6/2012    41005 4/6/2012 2012      4   14 Friday       4      2   2
4/7/2012    41006 4/7/2012 2012      4   14 Saturday     4      2   2
4/8/2012    41007 4/8/2012 2012      4   15 Sunday       4      3   2
4/9/2012    41008 4/9/2012 2012      4   15 Monday       4      3   2
4/10/2012   41009 4/10/2012 2012     4   15 Tuesday      4      3   2
4/11/2012   41010 4/11/2012 2012     4   15 Wednesday    4      3   2
4/12/2012   41011 4/12/2012 2012     4   15 Thursday     4      3   2
4/13/2012   41012 4/13/2012 2012     4   15 Friday       4      3   2
4/14/2012   41013 4/14/2012 2012     4   15 Saturday     4      3   2
Steps to Create a Data Warehouse
             Schema Example
Steps to Create a Data Warehouse

                Exporting Data to Warehouse

 Server Size / Type:
    Tower (16TB)
    Rack (12 hard drives)
    Blade
 Database:
    SQL Server, Oracle, DB2, PostgreSQL
 Scope:
    Interval
    Daily
    Weekly
    Monthly
Benefits of a Data Warehouse

              Who Should Have Access


 Traditional Reporting
 Direct Access
    Access via desktop database (ODBC etc.)
    Direct Access to Warehouse
    Interactive Reporting (Web “Cloud”)
Benefits of a Data Warehouse


 Consistent Numbers
 Easier to Audit / Problem Fixing.
 Quick Ad Hoc Reporting
 Knowledge of Data Available
 Data Mining
Data Mining

 What is it?
 Why do we not use it more often?
What Statistics Do (in a nutshell)


• Finding the Probability that Something Will Happen.
• Comparing two (or more) Groups of Data.
• Determines if Movements in one Type of Data Explains
  Movement in a Different Data-set.
Getting Stats in Excel
Comparing Groups of Data


• Example: Which group of agents perform best?
• 480 agents chosen from sample.
    • 160 agents worked up to 1 year
    • 160 agents worked from 1 – 4 years.
    • 160 agents worked more than 4 years.
• Do these agents perform differently in regards to conversion.
• We can use ANOVA to figure this out.
Comparing Groups of Data

                      1-4
    Agent    1 year   years   4+

            1 0.28    0.41    0.62

            2 0.25    0.38    0.50

            3 0.29    0.40    0.50

            4 0.37    0.32    0.53

            5 0.41    0.42    0.59

            6 0.50    0.39    0.54

            7 0.43    0.42    0.45

            8 0.38    0.42    0.47

            9 0.41    0.40    0.48

        10 0.47       0.44    0.52

        11 0.38       0.32    0.45

        12 0.41       0.36    0.48

        13 0.38       0.37    0.47
Comparing Groups of Data


Anova: Single Factor

SUMMARY
       Groups            Count          Sum       Average     Variance
1 year                           160 61.82122445 0.386382653 0.003960592
1-4 years                        160 76.16293624 0.476018351 0.004419634
4+                               160 81.91744414 0.511984026 0.00356321


ANOVA
 Source of Variation       SS            df           MS           F        P-value      F crit
Between Groups         1.338868966              2 0.669434483 168.1512278 5.38904E-56 3.014625576
Within Groups          1.899006344            477 0.003981145

Total                   3.23787531            479
Types of Regression Analysis


•   Simple Linear Regression
•   Multiple Regression
•   Lagged Regression
•   Stepwise Regression
•   Logistic Regression
Simple Regression


• Example: Does the 2010 call volume explain the 2011 call
  volume?
• Simple Regression comparing 2010 with 2011 by week.
Simple Regression


SUMMARY OUTPUT

      Regression Statistics
Multiple R                   0.86
R Square                     0.74
Adjusted R Square            0.74
Standard Error           9,790.76
Observations                    52

ANOVA
                          df             SS                    MS                F      Significance F
Regression                      1 13,882,238,604.22     13,882,238,604.22        144.82           0.00
Residual                       50 4,792,946,045.53          95,858,920.91
Total                          51 18,675,184,649.75

                     Coefficients    Standard Error          t Stat           P-value     Lower 95%      Upper 95% Lower 95.0% Upper 95.0%
Intercept              53,227.69           10,198.69                   5.22        0.00     32,743.02     73,712.37  32,743.02   73,712.37
X Variable 1                 0.71                0.06                 12.03        0.00          0.59          0.83       0.59        0.83
Growing Intelligence by Properly Storing
     and Mining Call Center Data
              Questions?
              Comments?

             Geir Rosoy
   Manager of Resource Intelligence
       geir.rosoy@hyatt.com
          402-592-6469

More Related Content

PPTX
Business Process Outsourcing
PDF
Process Mining - Chapter 3 - Data Mining
PDF
Data Science at Scale on MPP databases - Use Cases & Open Source Tools
PPTX
Different Types of BPO Services
PPT
Call Center Metrics
PPT
Bpo presentation
DOC
Business analyst
DOCX
Business Intelligence
Business Process Outsourcing
Process Mining - Chapter 3 - Data Mining
Data Science at Scale on MPP databases - Use Cases & Open Source Tools
Different Types of BPO Services
Call Center Metrics
Bpo presentation
Business analyst
Business Intelligence

Similar to Growing Intelligence by Properly Storing and Mining Call Center Data (20)

PPTX
EDA_Revision_Session_1cdeba87-6912-4236-ba3b-079a5463bf00.pptx
PPT
Introduction to Data Warehouse
PDF
ETIS09 - Data Quality: Common Problems & Checks - Presentation
PPT
Grace Currie Ann Jebson First Things First
PPTX
Kp-Data Analytics-ts.pptx
PPTX
Dataware house introduction by InformaticaTrainingClasses
PDF
Data analytics, a (short) tour
PPT
Data Preprocessing_17924109858fc09abd41bc880e540c13.ppt
PPTX
Preprocessing_exploring_and_Visualization.pptx
PPTX
Introduction to Big Data Analytics
PDF
Business Intelligence Presentation (1/2)
PPT
Data Preprocessing
PPTX
Data warehousing
PPT
Whats A Data Warehouse
PDF
Distributed Data Analysis with Hadoop and R - Strangeloop 2011
PDF
Metopen 6
PDF
what is ..how to process types and methods involved in data analysis
PDF
Data mining & data warehousing (ppt)
PPT
Data warehousing
PPTX
EDA_Revision_Session_1cdeba87-6912-4236-ba3b-079a5463bf00.pptx
Introduction to Data Warehouse
ETIS09 - Data Quality: Common Problems & Checks - Presentation
Grace Currie Ann Jebson First Things First
Kp-Data Analytics-ts.pptx
Dataware house introduction by InformaticaTrainingClasses
Data analytics, a (short) tour
Data Preprocessing_17924109858fc09abd41bc880e540c13.ppt
Preprocessing_exploring_and_Visualization.pptx
Introduction to Big Data Analytics
Business Intelligence Presentation (1/2)
Data Preprocessing
Data warehousing
Whats A Data Warehouse
Distributed Data Analysis with Hadoop and R - Strangeloop 2011
Metopen 6
what is ..how to process types and methods involved in data analysis
Data mining & data warehousing (ppt)
Data warehousing
Ad

Recently uploaded (20)

PPTX
Programs and apps: productivity, graphics, security and other tools
PDF
Peak of Data & AI Encore- AI for Metadata and Smarter Workflows
PDF
MIND Revenue Release Quarter 2 2025 Press Release
PDF
Encapsulation_ Review paper, used for researhc scholars
PPTX
Digital-Transformation-Roadmap-for-Companies.pptx
PDF
Agricultural_Statistics_at_a_Glance_2022_0.pdf
PDF
7 ChatGPT Prompts to Help You Define Your Ideal Customer Profile.pdf
PDF
Optimiser vos workloads AI/ML sur Amazon EC2 et AWS Graviton
PDF
Spectral efficient network and resource selection model in 5G networks
PDF
Build a system with the filesystem maintained by OSTree @ COSCUP 2025
PPTX
VMware vSphere Foundation How to Sell Presentation-Ver1.4-2-14-2024.pptx
PDF
Review of recent advances in non-invasive hemoglobin estimation
PDF
Approach and Philosophy of On baking technology
PPTX
Detection-First SIEM: Rule Types, Dashboards, and Threat-Informed Strategy
PPTX
Understanding_Digital_Forensics_Presentation.pptx
PDF
Unlocking AI with Model Context Protocol (MCP)
PDF
Diabetes mellitus diagnosis method based random forest with bat algorithm
PPTX
20250228 LYD VKU AI Blended-Learning.pptx
PDF
Electronic commerce courselecture one. Pdf
PDF
Advanced methodologies resolving dimensionality complications for autism neur...
Programs and apps: productivity, graphics, security and other tools
Peak of Data & AI Encore- AI for Metadata and Smarter Workflows
MIND Revenue Release Quarter 2 2025 Press Release
Encapsulation_ Review paper, used for researhc scholars
Digital-Transformation-Roadmap-for-Companies.pptx
Agricultural_Statistics_at_a_Glance_2022_0.pdf
7 ChatGPT Prompts to Help You Define Your Ideal Customer Profile.pdf
Optimiser vos workloads AI/ML sur Amazon EC2 et AWS Graviton
Spectral efficient network and resource selection model in 5G networks
Build a system with the filesystem maintained by OSTree @ COSCUP 2025
VMware vSphere Foundation How to Sell Presentation-Ver1.4-2-14-2024.pptx
Review of recent advances in non-invasive hemoglobin estimation
Approach and Philosophy of On baking technology
Detection-First SIEM: Rule Types, Dashboards, and Threat-Informed Strategy
Understanding_Digital_Forensics_Presentation.pptx
Unlocking AI with Model Context Protocol (MCP)
Diabetes mellitus diagnosis method based random forest with bat algorithm
20250228 LYD VKU AI Blended-Learning.pptx
Electronic commerce courselecture one. Pdf
Advanced methodologies resolving dimensionality complications for autism neur...
Ad

Growing Intelligence by Properly Storing and Mining Call Center Data

  • 1. Growing Intelligence by Properly Storing and Mining Call Center Data AGENDA • Today’s Data Challenge in the Call Center Environment • The Difference Between Data Storage and Data Warehouse • Steps to Create a Quality Warehouse • Data Mapping • Data Discovery • Data Cleaning • Export to Warehouse • How to Determine Customer Base • Future Benefits of Having a Warehouse • Data Mining • Statistics for Mortals • Final Thoughts and Questions
  • 2. Data Overflow Corporate Sales International Switch (Avaya) (Different Systems) HR Data Agent Surveys (PeopleSoft) Financials Email (Kana) (Accounting) Forecasting & Workforce Planning Management (IEX) (CenterBridge) External Data (Benchmarking)
  • 3. What is a Data Warehouse
  • 4. What is a Data Warehouse  Centralize all data that can be used for information in one location.  Data should be audited.  Data should allow the same timespan.  Data should have all calculations finalized or defined.  Data should be standardized or have support tables that allow for standardization.  It should be scalable.  It Should address the users’ needs.
  • 5. Steps to Create a Data Warehouse Corporate Data Mapping  Close Internal (Own Department)  Distant Internal (Other Departments)  Close External (Corporate)  Distant External (Outsourced or International)  External – Non-Generated (Benchmarking, government)  http://research.stlouisfed.org/fred2/
  • 6. Steps to Create a Data Warehouse Corporate Data Mapping: Close Internal • What data sources (database, report from the web, excel) • Attempt to get data from the first data source (avoid pulling data from the web, excel spreadsheets etc.). • What type of data (identification) • How is it currently used (purpose) • Who is currently using the data (audience) • Who is currently owning the data (manager)
  • 7. Steps to Create a Data Warehouse Owner: John Johnson, Telecom, Omaha Purpose / Users: Call IEX or Definition of Center CenterBridge data Management Stand-alone or composite
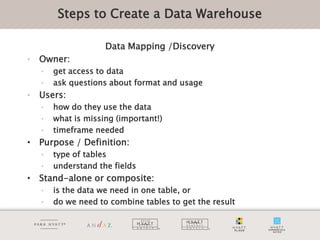
  • 8. Steps to Create a Data Warehouse Data Mapping /Discovery • Owner: • get access to data • ask questions about format and usage • Users: • how do they use the data • what is missing (important!) • timeframe needed • Purpose / Definition: • type of tables • understand the fields • Stand-alone or composite: • is the data we need in one table, or • do we need to combine tables to get the result
  • 9. Steps to Create a Data Warehouse  Data Cleaning  Purpose of Data  Weed Out “Waste”  Determine Unique Links (Database Keys)  Determine Time Frame  Determine Calculated Fields  Can be done at extraction  Danger is that people may use different formulas
  • 10. Steps to Create a Data Warehouse  Create Link (or Support) tables.  Date  Skill / VDN / Vector Dictionary  Create Schema  Determine Redundant Data  Keep the table that is easiest to extract  The table that has a stable extract  Create Audit Tables
  • 11. Steps to Create a Data Warehouse Date Link Table Example txtDate ntxtDate Date Year Month Week WeekDay Period PdWeek OTR 4/1/2012 41000 4/1/2012 2012 4 14 Sunday 4 2 2 4/2/2012 41001 4/2/2012 2012 4 14 Monday 4 2 2 4/3/2012 41002 4/3/2012 2012 4 14 Tuesday 4 2 2 4/4/2012 41003 4/4/2012 2012 4 14 Wednesday 4 2 2 4/5/2012 41004 4/5/2012 2012 4 14 Thursday 4 2 2 4/6/2012 41005 4/6/2012 2012 4 14 Friday 4 2 2 4/7/2012 41006 4/7/2012 2012 4 14 Saturday 4 2 2 4/8/2012 41007 4/8/2012 2012 4 15 Sunday 4 3 2 4/9/2012 41008 4/9/2012 2012 4 15 Monday 4 3 2 4/10/2012 41009 4/10/2012 2012 4 15 Tuesday 4 3 2 4/11/2012 41010 4/11/2012 2012 4 15 Wednesday 4 3 2 4/12/2012 41011 4/12/2012 2012 4 15 Thursday 4 3 2 4/13/2012 41012 4/13/2012 2012 4 15 Friday 4 3 2 4/14/2012 41013 4/14/2012 2012 4 15 Saturday 4 3 2
  • 12. Steps to Create a Data Warehouse Schema Example
  • 13. Steps to Create a Data Warehouse Exporting Data to Warehouse  Server Size / Type:  Tower (16TB)  Rack (12 hard drives)  Blade  Database:  SQL Server, Oracle, DB2, PostgreSQL  Scope:  Interval  Daily  Weekly  Monthly
  • 14. Benefits of a Data Warehouse Who Should Have Access  Traditional Reporting  Direct Access  Access via desktop database (ODBC etc.)  Direct Access to Warehouse  Interactive Reporting (Web “Cloud”)
  • 15. Benefits of a Data Warehouse  Consistent Numbers  Easier to Audit / Problem Fixing.  Quick Ad Hoc Reporting  Knowledge of Data Available  Data Mining
  • 16. Data Mining  What is it?  Why do we not use it more often?
  • 17. What Statistics Do (in a nutshell) • Finding the Probability that Something Will Happen. • Comparing two (or more) Groups of Data. • Determines if Movements in one Type of Data Explains Movement in a Different Data-set.
  • 23. Comparing Groups of Data • Example: Which group of agents perform best? • 480 agents chosen from sample. • 160 agents worked up to 1 year • 160 agents worked from 1 – 4 years. • 160 agents worked more than 4 years. • Do these agents perform differently in regards to conversion. • We can use ANOVA to figure this out.
  • 25. Comparing Groups of Data 1-4 Agent 1 year years 4+ 1 0.28 0.41 0.62 2 0.25 0.38 0.50 3 0.29 0.40 0.50 4 0.37 0.32 0.53 5 0.41 0.42 0.59 6 0.50 0.39 0.54 7 0.43 0.42 0.45 8 0.38 0.42 0.47 9 0.41 0.40 0.48 10 0.47 0.44 0.52 11 0.38 0.32 0.45 12 0.41 0.36 0.48 13 0.38 0.37 0.47
  • 26. Comparing Groups of Data Anova: Single Factor SUMMARY Groups Count Sum Average Variance 1 year 160 61.82122445 0.386382653 0.003960592 1-4 years 160 76.16293624 0.476018351 0.004419634 4+ 160 81.91744414 0.511984026 0.00356321 ANOVA Source of Variation SS df MS F P-value F crit Between Groups 1.338868966 2 0.669434483 168.1512278 5.38904E-56 3.014625576 Within Groups 1.899006344 477 0.003981145 Total 3.23787531 479
  • 27. Types of Regression Analysis • Simple Linear Regression • Multiple Regression • Lagged Regression • Stepwise Regression • Logistic Regression
  • 28. Simple Regression • Example: Does the 2010 call volume explain the 2011 call volume? • Simple Regression comparing 2010 with 2011 by week.
  • 29. Simple Regression SUMMARY OUTPUT Regression Statistics Multiple R 0.86 R Square 0.74 Adjusted R Square 0.74 Standard Error 9,790.76 Observations 52 ANOVA df SS MS F Significance F Regression 1 13,882,238,604.22 13,882,238,604.22 144.82 0.00 Residual 50 4,792,946,045.53 95,858,920.91 Total 51 18,675,184,649.75 Coefficients Standard Error t Stat P-value Lower 95% Upper 95% Lower 95.0% Upper 95.0% Intercept 53,227.69 10,198.69 5.22 0.00 32,743.02 73,712.37 32,743.02 73,712.37 X Variable 1 0.71 0.06 12.03 0.00 0.59 0.83 0.59 0.83
  • 30. Growing Intelligence by Properly Storing and Mining Call Center Data Questions? Comments? Geir Rosoy Manager of Resource Intelligence geir.rosoy@hyatt.com 402-592-6469