Lecture5---Gantt Chart
Download as PPT, PDF23 likes28,257 views

GANTT charts are a type of bar chart used to illustrate project schedules. They show the start and end dates of tasks, their duration, and dependencies between tasks. To construct a GANTT chart, critical tasks are scheduled first followed by non-critical tasks within their time windows. Staff and resources are then allocated to tasks based on availability. The chart can be re-scheduled if needed due to changes in staffing or equipment availability. Project management software helps automate GANTT chart creation and resource smoothing but decisions still require human judgment.


Lecture5---Gantt Chart
- 1. LECTURE 5 – GANTT CHART • GANTT Charts • Constructing GANTT Charts • Staffing and Re-scheduling • Project Management Software Software Project Management Maria Petridou 1
- 2. GANTT CHART A GANTT chart is a type of bar chart that illustrates a project schedule. After the PERT/CPM analysis is completed, the following phase is to construct the GANTT chart and then to re- allocate resources and re-schedule if necessary. GANTT charts have become a common technique for representing the phases and activities of a project work breakdown structure. It was introduced by Henry Gantt around 1910 – 1915. Software Project Management 2 Maria Petridou
- 3. GANTT CHART Software Project Management 3 Maria Petridou
- 4. GANTT CHART Characteristics: The bar in each row identifies the corresponding task The horizontal position of the bar identifies start and end times of the task Bar length represents the duration of the task Task durations can be compared easily Good for allocating resources and re-scheduling Precedence relationships can be represented using arrows Critical activities are usually highlighted Slack times are represented using bars with doted lines The bar of each activity begins at the activity earliest start time (ES) The bar of each activity ends at the activity latest finish time (LF). Software Project Management 4 Maria Petridou
- 5. GANTT CHART Software Project Management 5 Maria Petridou Advantages Simple Good visual communication to others Task durations can be compared easily Good for scheduling resources Disadvantages Dependencies are more difficult to visualise Minor changes in data can cause major changes in the chart
- 6. CONSTRUCTING GANTT CHART The steps to construct a GANTT chart from the information obtained by PERT/CPM are: 1. Schedule the critical tasks in the correct position. 2. Place the time windows in which the non-critical tasks can be scheduled. 3. Schedule the non-critical tasks according to their earliest starting times. 4. Indicate precedence relationships between tasks. Software Project Management 6 Maria Petridou
- 7. CONSTRUCTING GANTT CHART Example of an early GANTT chart construction: Software Project Management 7 Maria Petridou
- 8. CONSTRUCTING GANTT CHART Step 1. Schedule critical tasks: Software Project Management 8 Maria Petridou
- 9. CONSTRUCTING GANTT CHART Step 2. Place time windows for non-critical tasks: Software Project Management 9 Maria Petridou
- 10. CONSTRUCTING GANTT CHART Step 3. Schedule non-critical tasks Step 4. Indicate precedence relationships: Software Project Management 10 Maria Petridou
- 11. STAFFING & RE-SCHEDULING Once the project schedule, (e.g. GANTT chart), has been constructed, take into account available staff hours slack times and the project schedule Assign staff and other resources to each activity in the project Software Project Management 11 Maria Petridou
- 12. STAFFING & RE-SCHEDULING Resource Smoothing is a technique used to re-allocate resources and re-schedule activities. In resource smoothing, non-critical tasks are re-scheduled within their time window. Staff Utilization:(duration of activity x staff required for each activity, all added together) / (maximum staff required x duration of project) Software Project Management 12 Maria Petridou
- 13. STAFFING & RE-SCHEDULING Software Project Management 13 Maria Petridou Example1
- 14. STAFFING & RE-SCHEDULING Software Project Management 14 Maria Petridou The original schedule (constructed above) for this project is as shown below. 1. Staff utilisation = (3x2+4x4+5x1+7x3+2x1+4x2+3x5)/(14x6) = 0.857 = 85.5%
- 15. STAFFING & RE-SCHEDULING Software Project Management 15 Maria Petridou 2. Work out the Staff Profile
- 16. STAFFING & RE-SCHEDULING Now, assume that there are 6 people available for working in this project but one of them returns from holidays at time=2. So re-scheduling is needed because activities A and B cannot be carried out in parallel until time=2. Software Project Management 16 Maria Petridou
- 17. STAFFING & RE-SCHEDULING Suppose another scenario in which equipment and materials needed to carry out activities E and F are available at time=5 and time=9 respectively instead of being available at the activities ES time. Then, rescheduling is needed but the overall duration of the project is not affected. Software Project Management 17 Maria Petridou
- 18. STAFFING & RE-SCHEDULING The obvious way to reduce the overall project duration, it is by reducing the duration of the critical activities. Crashing Critical Activities refers to reducing the duration of a critical activity by allocating more resources to it. The risk is that crashing activities may actually reduce productivity and increase costs. Software Project Management 18 Maria Petridou
- 19. STAFFING & RE-SCHEDULING Example 2 Apply the PERT/CPM method and construct a GANTT chart for the following list of activities with precedence and duration. Software Project Management 19 Maria Petridou
- 20. STAFFING & RE-SCHEDULING Software Project Management 20 Maria Petridou
- 21. STAFFING & RE-SCHEDULING Step 1. Schedule critical tasks. Software Project Management 21 Maria Petridou
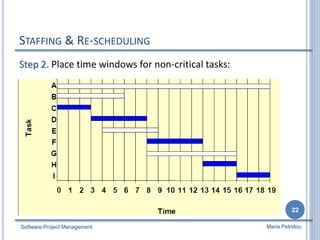
- 22. STAFFING & RE-SCHEDULING Step 2. Place time windows for non-critical tasks: Software Project Management 22 Maria Petridou
- 23. STAFFING & RE-SCHEDULING Step 3. Schedule non-critical tasks: Step 4. Indicate precedence relationships: Software Project Management 23 Maria Petridou
- 24. PROJECT MANAGEMENT SOFTWARE There are a number of project management software tools available to help in the planning and control of large software development projects. E.g. MS Project is a CASE software tool for Project Management This software is available in the main computer room in CSIT Most tools include functions to plan, schedule and control, but decision-making still has to be done by the project manager. Software Project Management 24 Maria Petridou
- 25. PROJECT MANAGEMENT SOFTWARE Benefits of project management software: Calculate project schedule Resource smoothing Automatic generation of reports and charts Limitations of project management software Allocation of resources to tasks Estimation of tasks durations Make decisions Reading: (Kendall&Kendall, chapter 3), (Dennis &Wixom, chapter 3). Software Project Management 25 Maria Petridou