SlideShare a Scribd company logo
Unleashing the Enormous Power
of Desktop Support KPI’s
Desktop Support Best Practices Series
Visit MetricNet’s Resource Library at www.metricnet.com
© MetricNet, LLC, www.metricnet.com 1
1
Become a MetricNet Premium Member: It’s Free!
© MetricNet, LLC, www.metricnet.com 2
MetricNet Benchmarks
MetricNet
Benchmarks
Peer Group
Benchmarks
Industry
Benchmarks
Benchmarking
Data Files
© MetricNet, LLC, www.metricnet.com 3
 Custom Benchmark
 Unique Peer Group
 Industry Benchmarking
Reports by geography
 Custom Benchmarking
Data in Excel format
© MetricNet, LLC, www.metricnet.com 4
Learn more at metricnet.com/path-to-world-class-performance
Did you know? Industry data shows that organizations that conduct
benchmarking at least once a year are far more likely to achieve
world-class performance. In fact, there is a virtual 1:1
correspondence between organizations that perform benchmarking
on an annual basis, and those that achieve world-class performance.
“
5© MetricNet, LLC, www.metricnet.com
Connect With MetricNet on Social Media
5
Use
#MetricNetLive
on Twitter to
participate.
Share thoughts,
key points,
questions or just
follow along!
MetricNet Best Practices Series
Benchmark 2014
Global Results for Desktop Support
7© MetricNet, LLC, www.metricnet.com
27 Years of IT Service and Support Benchmarks
More than 3,000 IT Service and Support Benchmarks
Global Database
70+ Key Performance Indicators
More than 120 Industry Best Practices
8
2014 Benchmarking Data: 138 Data Records from 31 Countries
© MetricNet, LLC, www.metricnet.com
9© MetricNet, LLC, www.metricnet.com
The Benchmarking Methodology
Samanage Customer
Service Desk
Performance
Performance of
Benchmarking Peer
Group
Determine How
Best in Class
Achieve Superiority
Adopt Selected
Practices of
Best in Class
Build a Sustainable
Competitive
Advantage
The ultimate
objective of
benchmarking
COMPARE
10© MetricNet, LLC, www.metricnet.com
The Goal of Benchmarking
Cost per Ticket
Quality
HigherLower
Higher
BEST-IN-CLASS
PERFORMANCE CURVE
AVERAGE PERFORMANCE CURVE
AFTER BENCHMARKING
STARTING POINT: BEFORE
BENCHMARKING
11© MetricNet, LLC, www.metricnet.com
POLLING QUESTION
12© MetricNet, LLC, www.metricnet.com
POLLING QUESTION
KPI’s Used in MetricNet Desktop Support Benchmarks
 Cost per Ticket
 Cost per Incident
 Cost per Service Request
Cost ProductivityService Level
Quality
Ticket Handling
Technician
 Average Incident Response
Time (minutes)
 % of Incidents Resolved in
1 Business Day
 Mean Time to Resolve
Incidents (business hours)
 Mean Time to Complete
Service Requests (business
days)
 Technician Utilization
 Tickets per Technician-
Month
 Incidents per Technician-
Month
 Service Requests per
Technician-Month
 Ratio of Technicians to
Total Headcount
 Customer Satisfaction
 First Contact Resolution Rate
(Incidents
 % Resolved Level 1 Capable
 Technician Satisfaction
 New Technician Training
Hours
 Annual Technician Training
Hours
 Annual Technician Turnover
 Technician Absenteeism
 Technician Tenure (months)
 Average Incident Work
Time (min)
 Average Service Request
Work Time (min)
 Average Travel Time per
Ticket (min)
Workload
 Tickets per Seat per Month
 Incidents per Seat per
Month
 Service Requests per Seat
per Month
 Incidents as a % of Total
Ticket Volume
© MetricNet, LLC, www.metricnet.com 13
Tickets, Incidents, and Service Requests
Incident Volume + Service Request Volume = Ticket Volume
Tickets
Incidents Service Requests
 Unplanned work that
requires a physical
touch to a device
 Hardware break/fix
 Device failure
 Connectivity failure
 Planned work that
requires a physical touch
to one or more devices
 Move/Add/Change
 Hardware or software
upgrade
 Device refresh
 Device set-up
© MetricNet, LLC, www.metricnet.com 14
Benchmarking Results Organized Into Three Categories
High Density
Medium Density
Field Services
© MetricNet, LLC, www.metricnet.com 15
Benchmarking Data Summary: High Density
© MetricNet, LLC, www.metricnet.com 16
Average Min Median Max
Cost per Ticket $84.42 $31.98 $82.03 $179.33
Cost per Incident $69.79 $18.27 $69.35 $148.92
Cost per Service Request $118.10 $48.89 $102.56 $260.27
Tickets per Technician per Month 142.8 54.4 124.9 276.4
Incidents per Technician per Month 100.2 19.2 88.4 230.7
Service Requests per Technician per Month 42.6 10.8 41.5 100.1
Technicians as a Percent of Total FTE's 85.5% 74.8% 84.6% 94.8%
Technician Utilization 54.8% 33.8% 56.5% 70.9%
Mean Time to Resolve Incidents (business hours) 6.5 1.0 5.0 24.1
% of Incidents Resolved in 1 Business Day 74.9% 18.7% 79.0% 94.8%
Mean Time to Fulfill Service Requests (business days) 2.9 1.0 2.6 5.7
% of Service Requests Fulfilled in 3 Business Days 56.3% 16.8% 59.2% 82.5%
Customer Satisfaction 83.6% 54.9% 86.5% 95.8%
Incident First Visit Resolution Rate 83.7% 66.7% 84.3% 97.2%
% Resolved Level 1 Capable 20.2% 3.8% 19.8% 35.4%
Annual Technician Turnover 31.4% 13.1% 27.8% 58.0%
Daily Technician Absenteeism 4.6% 0.8% 4.1% 11.4%
New Technician Training Hours 57 0 48 140
Annual Technician Training Hours 9 0 3 61
Technician Tenure (months) 43.6 17.6 43.9 88.4
Technician Job Satisfaction 78.9% 67.3% 79.7% 89.3%
Average Incident Work Time (minutes) 24.1 8.0 19.9 53.7
Average Service Request Work Time (minutes) 46.3 20.0 40.0 140.0
Travel Time per Ticket (minutes) 9.4 7.0 8.5 19.0
Tickets per Seat per Month 0.54 0.20 0.47 1.01
Incidents per Seat per Month 0.38 0.11 0.35 0.86
Service Requests per Seat per Month 0.16 0.04 0.14 0.42
Incidents as a % of Total Ticket Volume 68.0% 33.6% 69.6% 91.6%
2014 Benchmarking Statistics (High Density)
Cost
Productivity
Workload
Metric Type Key Performance Indicator (KPI)
Service Level
Quality
Technician
Ticket Handling
Benchmarking Data Summary: Medium Density
© MetricNet, LLC, www.metricnet.com 17
Average Min Median Max
Cost per Ticket $125.13 $56.46 $116.46 $288.99
Cost per Incident $112.42 $44.13 $105.45 $279.28
Cost per Service Request $158.84 $75.29 $144.92 $348.39
Tickets per Technician per Month 88.1 37.7 83.0 149.7
Incidents per Technician per Month 65.1 26.9 61.5 118.7
Service Requests per Technician per Month 22.9 4.6 23.0 52.1
Technicians as a Percent of Total FTE's 85.1% 72.1% 83.8% 97.4%
Technician Utilization 55.8% 36.2% 56.0% 72.2%
Mean Time to Resolve Incidents (business hours) 9.6 3.0 8.1 22.1
% of Incidents Resolved in 1 Business Day 35.7% 18.9% 38.3% 44.4%
Mean Time to Fulfill Service Requests (business days) 5.1 2.1 5.1 11.1
% of Service Requests Fulfilled in 3 Business Days 26.2% 2.4% 25.6% 39.6%
Customer Satisfaction 85.1% 51.3% 87.1% 99.1%
Incident First Visit Resolution Rate 84.9% 68.0% 86.3% 97.8%
% Resolved Level 1 Capable 21.5% 4.8% 21.7% 33.7%
Annual Technician Turnover 25.3% 2.5% 24.8% 53.7%
Daily Technician Absenteeism 4.7% 0.1% 3.7% 13.4%
New Technician Training Hours 62 0 65 135
Annual Technician Training Hours 13 0 7 59
Technician Tenure (months) 53.9 18.2 47.3 110.3
Technician Job Satisfaction 81.1% 68.2% 80.6% 97.6%
Average Incident Work Time (minutes) 21.2 8.0 19.7 51.3
Average Service Request Work Time (minutes) 45.1 20.0 38.5 124.0
Travel Time per Ticket (minutes) 37.6 20.0 37.5 78.0
Tickets per Seat per Month 0.56 0.21 0.57 1.16
Incidents per Seat per Month 0.42 0.12 0.42 1.00
Service Requests per Seat per Month 0.13 0.04 0.12 0.45
Incidents as a % of Total Ticket Volume 73.0% 40.8% 76.9% 94.7%
2014 Benchmarking Statistics (Medium Density)
Cost
Productivity
Workload
Metric Type Key Performance Indicator (KPI)
Service Level
Quality
Technician
Ticket Handling
Benchmarking Data Summary: Field Services
© MetricNet, LLC, www.metricnet.com 18
Average Min Median Max
Cost per Ticket $249.27 $97.12 $243.90 $508.45
Cost per Incident $232.62 $88.75 $220.48 $477.79
Cost per Service Request $282.58 $103.01 $266.42 $577.19
Tickets per Technician per Month 46.6 26.6 44.9 85.5
Incidents per Technician per Month 31.4 13.0 28.7 64.9
Service Requests per Technician per Month 15.1 4.2 13.1 40.4
Technicians as a Percent of Total FTE's 85.0% 71.9% 85.0% 96.9%
Technician Utilization 57.7% 35.7% 58.9% 72.5%
Mean Time to Resolve Incidents (business hours) 13.9 5.7 12.9 31.2
% of Incidents Resolved in 1 Business Day 24.3% 10.6% 25.0% 32.7%
Mean Time to Fulfill Service Requests (business days) 7.3 3.0 6.9 13.3
% of Service Requests Fulfilled in 3 Business Days 16.4% 1.5% 17.7% 26.3%
Customer Satisfaction 81.4% 48.0% 85.0% 98.0%
Incident First Visit Resolution Rate 83.4% 70.0% 82.8% 97.3%
% Resolved Level 1 Capable 19.7% 7.6% 19.9% 32.9%
Annual Technician Turnover 27.8% 11.0% 28.5% 55.6%
Daily Technician Absenteeism 4.7% 0.7% 4.0% 11.1%
New Technician Training Hours 62 0 61 185
Annual Technician Training Hours 10 0 8 46
Technician Tenure (months) 47.3 21.5 41.4 96.2
Technician Job Satisfaction 79.6% 68.7% 79.4% 89.8%
Average Incident Work Time (minutes) 19.8 8.0 16.9 44.5
Average Service Request Work Time (minutes) 44.7 20.0 39.0 113.0
Travel Time per Ticket (minutes) 99.4 60.0 92.0 181.0
Tickets per Seat per Month 0.53 0.21 0.47 1.19
Incidents per Seat per Month 0.36 0.11 0.31 0.95
Service Requests per Seat per Month 0.16 0.04 0.14 0.40
Incidents as a % of Total Ticket Volume 66.5% 39.8% 67.6% 91.4%
2014 Benchmarking Statistics (Field Services)
Cost
Productivity
Workload
Metric Type Key Performance Indicator (KPI)
Service Level
Quality
Technician
Ticket Handling
Benchmarking Data Summary: Comparative Averages
© MetricNet, LLC, www.metricnet.com 19
High Density Medium Density Field Services
Cost per Ticket $84.42 $125.13 $249.27
Cost per Incident $69.79 $112.42 $232.62
Cost per Service Request $118.10 $158.84 $282.58
Tickets per Technician per Month 142.8 88.1 46.6
Incidents per Technician per Month 100.2 65.1 31.4
Service Requests per Technician per Month 42.6 22.9 15.1
Technicians as a Percent of Total FTE's 85.5% 85.1% 85.0%
Technician Utilization 54.8% 55.8% 57.7%
Mean Time to Resolve Incidents (business hours) 6.5 9.6 13.9
% of Incidents Resolved in 1 Business Day 74.9% 35.7% 24.3%
Mean Time to Fulfill Service Requests (business days) 2.9 5.1 7.3
% of Service Requests Fulfilled in 3 Business Days 56.3% 26.2% 16.4%
Customer Satisfaction 83.6% 85.1% 81.4%
Incident First Visit Resolution Rate 83.7% 84.9% 83.4%
% Resolved Level 1 Capable 20.2% 21.5% 19.7%
Annual Technician Turnover 31.4% 25.3% 27.8%
Daily Technician Absenteeism 4.6% 4.7% 4.7%
New Technician Training Hours 57 62 62
Annual Technician Training Hours 9 13 10
Technician Tenure (months) 43.6 53.9 47.3
Technician Job Satisfaction 78.9% 81.1% 79.6%
Average Incident Work Time (minutes) 24.1 21.2 19.8
Average Service Request Work Time (minutes) 46.3 45.1 44.7
Travel Time per Ticket (minutes) 9.4 37.6 99.4
Tickets per Seat per Month 0.54 0.56 0.53
Incidents per Seat per Month 0.38 0.42 0.36
Service Requests per Seat per Month 0.16 0.13 0.16
Incidents as a % of Total Ticket Volume 68.0% 73.0% 66.5%
2014 Benchmarking Averages
Cost
Productivity
Workload
Metric Type Key Performance Indicator (KPI)
Service Level
Quality
Technician
Ticket Handling
Key Metrics Magnified
© MetricNet, LLC, www.metricnet.com 20
High Density Medium Density Field Services
Cost per Ticket $84.42 $125.13 $249.27
Travel Time per Ticket (minutes) 9.4 37.6 99.4
Average Incident Work Time (minutes) 24.1 21.2 19.8
Average Service Request Work Time (minutes) 46.3 45.1 44.7
Customer Satisfaction 83.6% 85.1% 81.4%
Tickets per Technician per Month 142.8 88.1 46.6
Technician Utilization 54.8% 55.8% 57.7%
Mean Time to Resolve Incidents (business hours) 6.5 9.6 13.9
Mean Time to Fulfill Service Requests (business days) 2.9 5.1 7.3
% Resolved Level 1 Capable 20.2% 21.5% 19.7%
Tickets per Seat per Month 0.54 0.56 0.53
2014 Benchmarking Averages
Key Performance Indicator (KPI)
The Desktop Support Balanced Scorecard
Step 1
Eight critical
performance
metrics have been
selected for the
scorecard
Step 2
Each metric has been
weighted according to its
relative importance
Step 3
For each performance metric,
the highest and lowest
performance levels in the
benchmark are recorded
Step 4
Your actual
performance for
each metric is
recorded in this
column
Step 5
Your score for each
metric is then
calculated: (worst case
– actual performance) /
(worst case – best
case) X 100
Step 6
Your balanced score for each
metric is calculated: metric
score X weighting
21
Worst Case Best Case
Cost per Incident 15.0% $312.00 $19.00 $48.00 90.1% 13.5%
Cost per Service Request 15.0% $556.00 $41.00 $113.00 86.0% 12.9%
Customer Satisfaction 25.0% 67.0% 94.0% 83.0% 59.3% 14.8%
Technician Utilization 15.0% 36.0% 84.0% 59.0% 47.9% 7.2%
First Contact Resolution Rate (incidents) 15.0% 38.0% 84.0% 61.0% 50.0% 7.5%
% of Incidents Resolved in 24 Hours 5.0% 19.0% 71.0% 58.0% 75.0% 3.8%
Mean Time to Complete Service Requests (days) 5.0% 18.4 1.8 5.8 75.9% 3.8%
Technician Satisfaction 5.0% 59.0% 93.0% 84.0% 73.5% 3.7%
Total 100.0% N/A N/A N/A N/A 67.1%
Balanced
Score
Your Actual
Performance
Metric
Score
Performance RangeMetric
WeightingPerformance Metric
The Scorecard Allows a Fair Benchmarking Comparison
0.0%
10.0%
20.0%
30.0%
40.0%
50.0%
60.0%
70.0%
80.0%
90.0%
100.0%
DesktopSupportBalancedScores
High 86.2%
Average ----- 51.9%
Median 50.1%
Low 16.0%
Your Score 67.1%
Desktop Support Balanced Scores
Key Statistics
© MetricNet, LLC, www.metricnet.com 22
Desktop Support Scorecard Trend
40%
45%
50%
55%
60%
65%
70%
75%
80%
85%
Jan Feb Mar Apr May Jun Jul Aug Sep Oct Nov Dec
DesktopSupportBalancedScore
12 Month Average Monthly Score
© MetricNet, LLC, www.metricnet.com 23
24© MetricNet, LLC, www.metricnet.com
Empirical Observations from the Best-in-Class
1. Performance Measurement and Management as a Holistic Discipline
2. Annual Benchmarking – 1:1 Correspondence
3. Significant Investments in Technician Training
4. Understanding and Exploiting TCO and First Level Resolution
5. Selective Investments in Technology – Remote Control and Knowledge
Management
6. Process Optimization (ITIL, ITSM)
7. Driving Accountability to Technician Level
8. Marketing Service and Support
9. The Widespread Adoption of ROI Analysis
10. Managing Service and Support as a Business
25© MetricNet, LLC, www.metricnet.com
Empirical Observations from the Best-in-Class
1. Performance Measurement and Management as a Holistic Discipline
2. Annual Benchmarking – 1:1 Correspondence
3. Significant Investments in Technician Training
4. Understanding and Exploiting TCO and First Level Resolution
5. Selective Investments in Technology – Remote Control and Knowledge
Management
6. Process Optimization (ITIL, ITSM)
7. Driving Accountability to Technician Level
8. Marketing Service and Support
9. The Widespread Adoption of ROI Analysis
10. Managing Service and Support as a Business
Metrics as a Fundamental Building Block in IT Support
METRICS
PEOPLE
PROCESS
TECH
26© MetricNet, LLC, www.metricnet.com
10%
20%
30%
40%
50%
60%
70%
80%
90%
100%
1 2 3 4 5
Metrics Maturity Ranking
DesktopSupportBalancedScore
The Evidence for Metrics as a Foundation Discipline
n = 143
27© MetricNet, LLC, www.metricnet.com
28© MetricNet, LLC, www.metricnet.com
Two Paradigms for Desktop Support KPI’s
The Historical Approach The Holistic Approach
Measurement
(75%)
Analysis
(15%)
Prescription
(7.5%)
Action
(2.5%)
Measurement
(5%)
Analysis
(20%)
Prescription
(30%)
Action
(45%)
IncreasingValue!
The 80/20 Rule for Desktop Support KPI’s
 Cost per TicketCost
Productivity
Quality
Call Handling
 Technician Utilization
 Customer satisfaction
 First contact resolution rate (incidents)
Technician  Technician Satisfaction
Aggregate  Balanced scorecard
TCO  % Resolved Level 1 Capable
Service Level  Mean Time to Resolve
© MetricNet, LLC, www.metricnet.com 29
Cost and Quality: Nothing Else Matters!
Lower Cost
Cost per Ticket (Efficiency)
CustomerSatisfaction
(Effectiveness)
Top Quartile
Efficient and Effective
Lower Quartile
Middle Quartiles
Effective but not Efficient
Middle Quartiles
Efficient but not Effective
World-Class
Desktop
Support
Peer Group
Higher Cost
Lower
Quality
Higher
Quality
© MetricNet, LLC, www.metricnet.com 30
Desktop Support KPI’s: Cause-and-Effect
Cost per Ticket Customer Satisfaction
Technician
Utilization
FCR
(Incidents)
Technician
Satisfaction
Coaching Career Path Training Hours
SL’s
MTTR
Work/
Travel Time
Techs/
Total FTE’s
Absenteeism/
Turnover
% Resolved
Level 1
Capable
Scheduling
Efficiency
Service
Levels: MTTR
© MetricNet, LLC, www.metricnet.com 31
32© MetricNet, LLC, www.metricnet.com
1. Performance Measurement and Management as a Holistic Discipline
2. Annual Benchmarking – 1:1 Correspondence
3. Significant Investments in Technician Training
4. Understanding and Exploiting TCO and First Level Resolution
5. Selective Investments in Technology – Remote Control and Knowledge
Management
6. Process Optimization (ITIL, ITSM)
7. Driving Accountability to Technician Level
8. Marketing Service and Support
9. The Widespread Adoption of ROI Analysis
10. Managing Service and Support as a Business
Empirical Observations from the Best-in-Class
Desktop Support KPI’s: Cause-and-Effect
Cost per Ticket Customer Satisfaction
Technician
Utilization
FCR
(Incidents)
Technician
Satisfaction
Coaching Career Path Training Hours
SL’s
MTTR
Work/
Travel Time
Techs/
Total FTE’s
Absenteeism/
Turnover
% Resolved
Level 1
Capable
Scheduling
Efficiency
Service
Levels: MTTR
© MetricNet, LLC, www.metricnet.com 33
New Technician Training Hours vs. Technician Satisfaction
20%
30%
40%
50%
60%
70%
80%
90%
100%
0.0 50.0 100.0 150.0 200.0 250.0
New Technician Training Hours
TechnicianSatisfaction
© MetricNet, LLC, www.metricnet.com 34
Annual Training Hours vs. Technician Job Satisfaction
40%
50%
60%
70%
80%
90%
100%
0 20 40 60 80 100 120 140
Annual Technician Training Hours
TechnicianSatisfaction
© MetricNet, LLC, www.metricnet.com 35
36© MetricNet, LLC, www.metricnet.com
Empirical Observations from the Best-in-Class
1. Performance Measurement and Management as a Holistic Discipline
2. Annual Benchmarking – 1:1 Correspondence
3. Significant Investments in Technician Training
4. Understanding and Exploiting TCO and First Level Resolution
5. Selective Investments in Technology – Remote Control and Knowledge
Management
6. Process Optimization (ITIL, ITSM)
7. Driving Accountability to Technician Level
8. Marketing Service and Support
9. The Widespread Adoption of ROI Analysis
10. Managing Service and Support as a Business
Cost of Resolution: North American Averages
Support Level Cost per Ticket
Vendor
Level 2: Desktop Support
Field Support
Level 3 IT
(apps, networking, NOC, etc.)
Level 1: Service Desk
$471
$196
$85
$62
$22
© MetricNet, LLC, www.metricnet.com 37
© MetricNet, LLC, www.metricnet.com
Cost of Resolution: North American Averages
38
39© MetricNet, LLC, www.metricnet.com
The Tao of SPOC (Single Point of Contact)
User Community
Level 1
Service Desk
Desktop
Support
Field
Support
Level 2 IT
Support
Vendor
Support
39
40© MetricNet, LLC, www.metricnet.com
Key SPOC Principles
Key SPOC Principles
 Enterprise takes an end-to-end view of user
support
 User/Customer has a single point of contact
for all IT-related incidents, questions,
problems, and work requests
 The Level 1 Service Desk is the SPOC
 Level 1 is responsible for:
 Ticket triage
 Resolution at Level 1 if possible
 Effective handoffs to n level support
 Resolution coordination and facilitation
 Ticket closure
 Desktop “Drive-bys”, “Fly-bys”, and “Snags”
are strongly discouraged
41© MetricNet, LLC, www.metricnet.com
SPOC Support Reduces Total Cost of Ownership
0%
5%
10%
15%
20%
25%
30%
35%
40%
%ResolvedLevel1Capable
% Resolved Level 1 Capable with SPOC % Resolved Level 1 Capable without SPOC
Average = 22.8%
Average = 15.3%
42© MetricNet, LLC, www.metricnet.com
Empirical Observations from the Best-in-Class
1. Performance Measurement and Management as a Holistic Discipline
2. Annual Benchmarking – 1:1 Correspondence
3. Significant Investments in Technician Training
4. Understanding and Exploiting TCO and First Level Resolution
5. Selective Investments in Technology – Remote Control and Knowledge
Management
6. Process Optimization (ITIL, ITSM)
7. Driving Accountability to Technician Level
8. Marketing Service and Support
9. The Widespread Adoption of ROI Analysis
10. Managing Service and Support as a Business
43© MetricNet, LLC, www.metricnet.com
Two Metrics You Should Know
% Resolved Level 1 Capable (PRLC)
The percentage of tickets resolved by desktop support that could
have been resolved at level 1 support.
First Level Resolution Rate (FLR)
The number of tickets resolved at level 1 divided by all tickets that
can potentially be resolved at level 1.
44© MetricNet, LLC, www.metricnet.com
POLLING QUESTION
45© MetricNet, LLC, www.metricnet.com
POLLING QUESTION
46© MetricNet, LLC, www.metricnet.com
0.0%
10.0%
20.0%
30.0%
40.0%
50.0%
60.0%
70.0%
80.0%
90.0%
100.0%
NetFirstLevelResolution
Remote Diagnostic Software No Remote Diagnostic Software
The Effect of Remote Control Software on FLR
Average = 77.8% FLR
Average = 61.4% FLR
47© MetricNet, LLC, www.metricnet.com
The Effect of a Mature Knowledge Base on FLR
0.0%
10.0%
20.0%
30.0%
40.0%
50.0%
60.0%
70.0%
80.0%
90.0%
100.0%
0 1 2 3 4 5 6
KBase Maturity
NetFirstLevelResolution
48© MetricNet, LLC, www.metricnet.com
1. Performance Measurement and Management as a Holistic Discipline
2. Annual Benchmarking – 1:1 Correspondence
3. Significant Investments in Technician Training
4. Understanding and Exploiting TCO and First Level Resolution
5. Selective Investments in Technology – Remote Control and Knowledge
Management
6. Process Optimization (ITIL, ITSM)
7. Driving Accountability to Technician Level
8. Marketing Service and Support
9. The Widespread Adoption of ROI Analysis
10. Managing Service and Support as a Business
Empirical Observations from the Best-in-Class
49© MetricNet, LLC, www.metricnet.com
Driving Individual Accountability: The Technician Scorecard
Step 1
Eight critical
performance
metrics have been
selected for the
scorecard
Step 2
Each metric has been
weighted according to its
relative importance
Step 3
For each performance metric,
the highest and lowest
performance levels in the
benchmark are recorded
Step 4
Your actual
performance for
each metric is
recorded in this
column
Step 5
Your score for each
metric is then
calculated: (worst case
– actual performance) /
(worst case –best case)
X 100
Step 6
Your balanced score for each
metric is calculated: metric
score X weighting
49
Worst Case Best Case
Customer Satisfaction 20.0% 67.0% 94.0% 83.0% 59.3% 11.9%
First Contact Resolution Rate (Incidents) 20.0% 38.0% 84.0% 61.0% 50.0% 10.0%
Incidents Closed this Month 15.0% 19.9 76.9 59.8 69.9% 10.5%
Service Requests Closed This Month 15.0% 15.6 42.2 28.5 48.6% 7.3%
Unplanned Absenteeism 7.5% 0.0% 22.0% 19.0% 86.4% 6.5%
Teamwork 7.5% 0.0 5.0 3.5 69.9% 5.2%
Initiative 7.5% 0.0 5.0 5.0 100.0% 7.5%
Mentoring 7.5% 0.0 5.0 4.5 90.0% 6.7%
Total 100.0% N/A N/A N/A N/A 43.7%
Balanced
Score
Your Actual
Performance
Metric
Score
Performance RangeMetric
WeightingPerformance Metric
50© MetricNet, LLC, www.metricnet.com
Monthly Technician Performance Postings
Sep Aug Jul Jun May Apr
11 1 95.8% 98.0% 97.1% 95.7% 98.3% 97.3% 97.0%
32 2 92.8% 92.1% 90.3% 89.3% 84.6% 92.2% 90.2%
21 3 91.5% 88.5% 83.2% 94.0% 93.7% 93.5% 90.7%
35 4 91.0% 86.8% 85.2% 78.5% 80.5% 68.2% 81.7%
14 5 89.5% 89.1% 90.0% 90.1% 92.3% 92.1% 90.5%
26 6 83.8% 84.4% 90.2% 86.5% 77.8% 63.9% 81.1%
25 7 83.0% 73.6% 81.9% 72.1% 84.8% 87.9% 80.5%
15 8 70.4% 66.6% 53.3% 56.3% 56.6% 39.0% 57.0%
20 9 64.9% 66.5% 70.1% 56.9% 40.9% 72.7% 62.0%
31 10 62.3% 47.4% 22.7% 38.4% 26.0% 93.0% 48.3%
16 11 61.0% 62.8% 54.5% 45.9% 41.7% 62.7% 54.8%
17 12 57.9% 42.1% 32.3% 71.6% 60.3% 60.3% 54.1%
33 13 56.8% 75.5% 64.8% 80.3% 79.7% 73.5% 71.8%
13 14 52.2% 34.9% 61.0% 52.8% 58.9% 48.7% 51.4%
24 15 48.9% 66.7% 86.9% 87.7% 83.6% 74.5% 74.7%
28 16 46.4% 45.5% 19.3% 40.3% 28.8% 32.4% 35.4%
27 17 43.7% 26.5% 31.5% 24.3% 22.2% 17.2% 27.6%
19 18 41.5% 28.4% 50.1% 48.1% 71.1% 81.0% 53.4%
23 19 39.1% 52.3% 57.1% 86.4% 87.7% 88.9% 68.6%
22 20 36.8% 18.7% 19.3% 52.9% 66.4% 64.3% 43.1%
12 21 36.6% 43.2% 33.1% 65.7% 69.0% 86.0% 55.6%
30 22 36.3% 22.6% 23.5% 85.8% 81.5% 70.3% 53.3%
29 23 34.1% 44.9% 50.2% 28.3% 48.9% 36.9% 40.5%
34 24 33.4% 37.9% 23.1% 21.7% 29.7% 22.6% 28.0%
18 25 32.6% 68.4% 80.4% 88.4% 83.8% 91.6% 74.2%
59.3% 58.5% 58.0% 65.5% 66.0% 68.4% 62.6%
Monthly
Ranking
Monthly Average
Technician
Number
Monthly Scorecard Performance Six Month
Average
51© MetricNet, LLC, www.metricnet.com
1. Performance Measurement and Management as a Holistic Discipline
2. Annual Benchmarking – 1:1 Correspondence
3. Significant Investments in Technician Training
4. Understanding and Exploiting TCO and First Level Resolution
5. Selective Investments in Technology – Remote Control and Knowledge
Management
6. Process Optimization (ITIL, ITSM)
7. Driving Accountability to Technician Level
8. Marketing Service and Support
9. The Widespread Adoption of ROI Analysis
10. Managing Service and Support as a Business
Empirical Observations from the Best-in-Class
52© MetricNet, LLC, www.metricnet.com
Perception vs. Reality in Service and Support
LOWER COST HIGHERACTUAL VALUE
PERCEIVED
VALUE
HIGHER
LOWER
Perceived Value > Actual Value
Perceived Value < Actual Value
Perceived Value = Actual Value
53
Where Does Your Desktop Support Operate?
LOWER COST HIGHERACTUAL VALUE
PERCEIVED
VALUE
HIGHER
LOWER
Perceived Value > Actual Value
Perceived Value < Actual Value
Perceived Value = Actual Value
A Common (but
Dangerous) Operating
Position
© MetricNet, LLC, www.metricnet.com
54
Operational Effectiveness First!
LOWER COST HIGHERACTUAL VALUE
PERCEIVED
VALUE
HIGHER
LOWER
Perceived Value > Actual Value
Perceived Value < Actual Value
Perceived Value = Actual Value
#1 Operational
Effectiveness
#2Brand
Management
© MetricNet, LLC, www.metricnet.com
55
Closing the Perception vs. Reality Gap
LOWER COST HIGHERACTUAL VALUE
PERCEIVED
VALUE
HIGHER
LOWER
Perceived Value > Actual Value
Perceived Value < Actual Value
Perceived Value = Actual Value
Closing
the
Perception
Gap
Where you Should Be
Where you Are
© MetricNet, LLC, www.metricnet.com
56© MetricNet, LLC, www.metricnet.com
Image Management: The Five W’s
1. Who – Who are the Key Stakeholder Groups?
2. What – What are the Key Messages?
3. When – When are You Going to Communicate Them?
4. Where/How – Where/How do You Reach the Stakeholders?
5. Why – Why are We Doing This?
57© MetricNet, LLC, www.metricnet.com
Key Success Factors in Desktop Image Management
MessagesTiming
Channels
Timing
Frequent Contact
• New employee orientation
• At log-in
• During training
• During the incident
• At scheduled sessions
Messages
Multiple Messages
• Services
• Major initiatives
• Performance Levels
• FAQ’s
• Success Stories
Channels
Use All Available
• User liaisons
• Newsletters
• Reference Guides
• Surveys
• Log-in messages
58© MetricNet, LLC, www.metricnet.com
Why are We Doing This?
We’ve all heard the expression…
“Expectations Not Set…
are Expectations Not Met!
So, let’s get serious about proactively
managing expectations!
59© MetricNet, LLC, www.metricnet.com 59© MetricNet, LLC, www.metricnet.com 59
60© MetricNet, LLC, www.metricnet.com
Marketing Summary
 Managing the gap between perception and reality is fairly
straightforward
 It doesn’t take a lot of time, or cost a lot of money
 But it is critically important
 The success of Level 1 and Desktop Support depends as much on your
image, as it does on your actual performance!
 The Benefits of effective Image Management Include:
 Customer loyalty and positive word-of-mouth referrals
 Credibility, which leverages your ability to Get Things Done!
 A Positive Image for IT overall
 High levels of Customer Satisfaction
61© MetricNet, LLC, www.metricnet.com
1. Performance Measurement and Management as a Holistic Discipline
2. Annual Benchmarking – 1:1 Correspondence
3. Significant Investments in Technician Training
4. Understanding and Exploiting TCO and First Level Resolution
5. Selective Investments in Technology – Remote Control and Knowledge
Management
6. Process Optimization (ITIL, ITSM)
7. Driving Accountability to Technician Level
8. Marketing Service and Support
9. The Widespread Adoption of ROI Analysis
10. Managing Service and Support as a Business
Empirical Observations from the Best-in-Class
62© MetricNet, LLC, www.metricnet.com 62
The Paradox of IT Support
 Less than 5% of all IT spending is
allocated to end-user support
 Service desk, desktop support,
field support
 This leads many to erroneously
assume that there is little upside
opportunity in IT support
 The result is that most support
organizations are managed with the
goal of minimizing costs
 But the most effective support
strategies focus on maximizing
valueCorporate IT Spending Breakdown
4%
96%: Non support functions
End-User Support
 Application
Development
 Application
Maintenance
 Network
Operations
 Mainframe and
midrange Computing
 Desktop Computing
 Contract Services
(e.g., disaster
recovery)
63© MetricNet, LLC, www.metricnet.com
Support Level Cost per Ticket
Vendor
Level 2: Desktop Support
Field Support
Level 3 IT
(apps, networking, NOC, etc.)
Level 1: Service Desk
$471
$196
$85
$62
$22
Support Has an Opportunity to Minimize TCO
© MetricNet, LLC, www.metricnet.com
Cost of Resolution: North American Averages
64
65© MetricNet, LLC, www.metricnet.com
0
10
20
30
40
50
60
70
0 1 2 3 4 5
ProductiveHoursLostperEmployeeperYear
Quality of Support Drives End-User Productivity
1 (top) 2 3 4 (bottom)
Customer Satisfaction 93.5% 84.5% 76.1% 69.3%
First Contact Resolution Rate 90.1% 83.0% 72.7% 66.4%
Mean Time to Resolve (hours) 0.8 1.2 3.6 5.0
Customer Satisfaction 94.4% 89.2% 79.0% 71.7%
First Contact Resolution Rate 89.3% 85.6% 80.9% 74.5%
Mean Time to Resolve (hours) 2.9 4.8 9.4 12.3
Service Desk
Desktop Support
Performance Quartile
Support Function Key Performance Indicator
37.4 46.9Average Productive Hours Lost per Employee per Year 17.1 25.9
Performance Quartile n = 60
84%
47%
31% 29%
22%
19%
8%
0%
10%
20%
30%
40%
50%
60%
70%
80%
90%
Service Desk Desktop
Support
Network
Outages
VPN Training Enterprise
Applications
Desktop
Software
Factors Contributing to IT Customer Satisfaction
%SayingVeryImportant
 n = 1,044
 Global large cap companies
 Survey type: multiple choice
 3 responses allowed per survey
 84% cited the service desk as a very important factor in their overall satisfaction with corporate IT
 47% cited desktop support as a very important factor in their overall satisfaction with corporate IT
66© MetricNet, LLC, www.metricnet.com
Desktop Support Drives Customer Satisfaction for All of IT
What We Learned from Benchmark 2014
 Desktop Support is now being managed as a strategic asset within the
enterprise
 One that can reduce the overall cost of IT
 Dramatically improve the productivity of end-users
 And drive a positive view of IT
 World-Class Desktop Support organizations have a number of success
factors in common
1. Part of an end-to-end support process
2. An understanding of the economics of TCO for user support
3. Active efforts to maximize First Contact, and First Level resolution rates
4. Use performance metrics diagnostically and prescriptively
5. Invest in technician training, coaching, and career pathing
6. Have active internal marketing efforts
7. And aggressively promote and communicate the value delivered by
Desktop Support
67© MetricNet, LLC, www.metricnet.com
A Call to Action:
Your Opportunity to Excel!
68
69© MetricNet, LLC, www.metricnet.com
Five Ideas to Get You Started!
4
3
2
1
Customer
Enthusiasm
Measure
Diagnose
Prescribe
Implement
4. Browse MetricNet’s
Resource Library
1. Visit Our Website and
Become a Free Member
2. Connect with MetricNet on
Social Media
5. Participate in a MetricNet IT
Support Benchmark
3. Register for Future
MetricNet Webcasts
Five Opportunities
to Get Started!
Visit MetricNet’s Resource Library at www.metricnet.com
© MetricNet, LLC, www.metricnet.com 70
70
Become a Member: It’s Free!
© MetricNet, LLC, www.metricnet.com 71
72© MetricNet, LLC, www.metricnet.com
Connect With MetricNet on Social Media
Company Page
Best Practices in
Call Centers - Group
Best Practices in Customer
Satisfaction - Group
Best Practices in Desktop
Support - Group
Best Practices in Service
Desks - Group
Company PageBest Practices in
Service Desks -
Community
Best Practices in Desktop
Support - Community
Best Practices in Customer
Satisfaction - Community
Best Practices in Call
Centers - Community
73© MetricNet, LLC, www.metricnet.com
MetricNet on Social Media
 Like us on Facebook:
 http://www.facebook.com/metricnet | Mention us using @MetricNet
 Follow us on Twitter:
 http://www.twitter.com/metricnet | Mention us using @MetricNet or #MetricNet
 Follow our LinkedIn Company Page:
 http://www.linkedin.com/company/metricnet
 Become a Member of our MetricNet Certified LinkedIn Groups:
 http://www.linkedin.com/groups/Best-Practices-in-Call-Centers-1801665
 http://www.linkedin.com/groups/Best-Practices-in-Customer-Satisfaction-1825753
 http://www.linkedin.com/groups/Best-Practices-in-Desktop-Support-4034463
 http://www.linkedin.com/groups/Best-Practices-in-Service-Desks-1801657
 Subscribe to YouTube:
 http://www.youtube.com/metricnet
 Follow our Google+ Company Page:
 http://plus.google.com/u/0/b/111056508365533897358/111056508365533897358/posts
Mention us using +MetricNet
 Become a Member of our Google+ Communities:
 http://plus.google.com/u/0/b/111056508365533897358/communities/111509357790346291238
 http://plus.google.com/u/0/b/111056508365533897358/communities/117245911462171588332
 http://plus.google.com/u/0/b/111056508365533897358/communities/114421701803292354205
 http://plus.google.com/u/0/b/111056508365533897358/communities/109121315816446874775
74© MetricNet, LLC, www.metricnet.com© MetricNet, LLC, www.metricnet.com
Upcoming MetricNet Webcasts
 June 2015
 Call Center Key Performance Indicators
 June 2015
 The Role of IT Leadership in Service and Support
 July 2015
 Service Desk Best Practices
 September 2015
 Benchmarking Roundup: Summary of 2015 Service
and Support Benchmarks
 October 2015
 The Zen of Support
For more information on Industry Best Practices, please register for MetricNet’s FREE upcoming webcasts
© MetricNet, LLC, www.metricnet.com 74
Register at www.metricnet.com
75© MetricNet, LLC, www.metricnet.com
Download Free Content from Our Resource Library
Download at www.metricnet.com
© MetricNet, LLC, www.metricnet.com 75
MetricNet Benchmarks
MetricNet
Benchmarks
Peer Group
Benchmarks
Industry
Benchmarks
Benchmarking
Data Files
© MetricNet, LLC, www.metricnet.com 76
 Custom Benchmark
 Unique Peer Group
 Diagnostic
 Industry Benchmarking
Reports by geography
 Custom Benchmarking
Data in Excel format
 Unique Peer Group
© MetricNet, LLC, www.metricnet.com 77
Learn more at metricnet.com/path-to-world-class-performance
Did you know? Industry data shows that organizations that conduct
benchmarking at least once a year are far more likely to achieve
world-class performance. In fact, there is a virtual 1:1
correspondence between organizations that perform benchmarking
on an annual basis, and those that achieve world-class performance.
“
78© MetricNet, LLC, www.metricnet.com
You Can Reach MetricNet…
By Phone…
703-992-7559
On Our Website…
www.metricnet.com
Or E-mail us…
info@metricnet.com
79
Thank You!
80
Questions?
81
About MetricNet
Your Benchmarking Partner
82
Your Speaker: Jeff Rumburg
© MetricNet, LLC, www.metricnet.com
 Co Founder and Managing Partner,
MetricNet, LLC
 Winner of the 2014 Ron Muns
Lifetime Achievement Award
 Former CEO, The Verity Group
 Former Vice President, Gartner
 Founder of the Service Desk
Benchmarking Consortium
 Author of A Hands-On Guide to
Competitive Benchmarking
 Harvard MBA, Stanford MS
83© MetricNet, LLC, www.metricnet.com
Benchmarking is MetricNet’s Core Business
Call Centers
Telecom
Information
Technology
Satisfaction
 Customer Service
 Technical Support
 Telemarketing/Telesales
 Collections
 Service Desk
 Desktop Support
 Field Support
 Price Benchmarking
 Customer Satisfaction
 Employee Satisfaction
84© MetricNet, LLC, www.metricnet.com
27 Years of IT Service and Support Benchmarking Data
More than 3,000 IT Service and Support Benchmarks
Global Database
70+ Key Performance Indicators
More than 120 Industry Best Practices
85© MetricNet, LLC, www.metricnet.com
Meet a Sampling of Our Clients
MetricNet Conducts benchmarking for IT Service and Support
organizations worldwide, and across virtually every industry sector.
86© MetricNet, LLC, www.metricnet.com
You Can Reach MetricNet…
By Phone…
703-992-7559
On Our Website…
www.metricnet.com
Or E-mail us…
info@metricnet.com
87
Thank You!

More Related Content

PDF
Free Training Series | Case Studies in Service Desk and Desktop Support Colla...
PDF
Free Desktop Support Training Series | What You Need to Know About Desktop Su...
PDF
Leveraging KPI’s to Maximize the ROI of Support
PDF
Free Training Series | Desktop Support and Service Desk Collaboration | Metri...
PDF
Free Desktop Support Training Series | The Zen of Support - The Path to Strat...
PDF
Free Desktop Support Training Series | The Economic Impact of Support | What'...
PDF
Benchmark 2014 | Global Results for Desktop Support | HDI 2015
PDF
Free IT Support Training | Best Practices in Desktop Support
Free Training Series | Case Studies in Service Desk and Desktop Support Colla...
Free Desktop Support Training Series | What You Need to Know About Desktop Su...
Leveraging KPI’s to Maximize the ROI of Support
Free Training Series | Desktop Support and Service Desk Collaboration | Metri...
Free Desktop Support Training Series | The Zen of Support - The Path to Strat...
Free Desktop Support Training Series | The Economic Impact of Support | What'...
Benchmark 2014 | Global Results for Desktop Support | HDI 2015
Free IT Support Training | Best Practices in Desktop Support

What's hot (20)

PDF
Free Service Desk Training Series | Service Desk First Level Resolution | Met...
PDF
Past and present | 25 years of Service Desk KPIs
PDF
Unleashing the Enormous Power of Service Desk KPIs
PDF
MetricNet Medical Care Benchmark Informational Briefing
PDF
The role of it leadership in service and support v2
PDF
Free Service Desk Training Series | MetricNet's Service Desk Best Practices
PDF
Free Desktop Support Training Series | The Zen of Support | MetricNet
PDF
FUSION14 Session 302 | Optimizing the Tradeoff: Cost vs. Quality in IT Support
PDF
Free Training Series | Enabling Chat | Key Success Factors in Chat Implementa...
PDF
Free Call Center Training | Unleashing the Enormous Power of Call Center KPIs
PDF
The 80/20 Rule for Desktop KPI's: Less is More!
PDF
5 case-studies-collaboration
PDF
Free Desktop Support Training Series | Cost vs. Quality in IT Support | Metri...
PDF
Free Service Desk Training Series | Unlocking The Hidden Value of Service Des...
PPTX
Shift left v3 (1)
PPTX
Breaking Call Center Rules: Find Time to Wow Customers
PDF
Contact Center Assessment: Solution Overview and Approach
PDF
Mastering DevOps with AI-powered Change Risk Prediction
PPT
Jan2007 Establishing A Service Desk Draft
PDF
It helpdesk communication plan it-toolkits
Free Service Desk Training Series | Service Desk First Level Resolution | Met...
Past and present | 25 years of Service Desk KPIs
Unleashing the Enormous Power of Service Desk KPIs
MetricNet Medical Care Benchmark Informational Briefing
The role of it leadership in service and support v2
Free Service Desk Training Series | MetricNet's Service Desk Best Practices
Free Desktop Support Training Series | The Zen of Support | MetricNet
FUSION14 Session 302 | Optimizing the Tradeoff: Cost vs. Quality in IT Support
Free Training Series | Enabling Chat | Key Success Factors in Chat Implementa...
Free Call Center Training | Unleashing the Enormous Power of Call Center KPIs
The 80/20 Rule for Desktop KPI's: Less is More!
5 case-studies-collaboration
Free Desktop Support Training Series | Cost vs. Quality in IT Support | Metri...
Free Service Desk Training Series | Unlocking The Hidden Value of Service Des...
Shift left v3 (1)
Breaking Call Center Rules: Find Time to Wow Customers
Contact Center Assessment: Solution Overview and Approach
Mastering DevOps with AI-powered Change Risk Prediction
Jan2007 Establishing A Service Desk Draft
It helpdesk communication plan it-toolkits
Ad

Similar to Free Desktop Support Training | Unleashing the Enormous Power of Desktop Support KPIs (20)

PPTX
E Solution's Service Quality Analysis
DOC
Cost Analysis
PPTX
First Contact Resolution - The Performance Driver!
PPTX
Aligning People, Processes and Technology in Field Service
PDF
Physical processes have a gut feeling - Radwell
PPTX
MB-240T00A-ENU-AppliedWorkshop-InstructorDeck.pptx
PDF
ServiceNow Field Service Management
PPTX
IT Metrics Presentation
PDF
Top Issues Faced by Field Service Businesses & The Solution
PDF
Free Desktop Support Training Series | The Economic Impact of Support | What'...
PPT
Chrs & Kevin Cust Satisfaction Final Copy
PPT
Chrs & Kevin Cust Satisfaction Final Copy
PDF
Rumburg seven kp_is
PPTX
Top 5 Tips to Increase Field Service Technician Utilization
PDF
Understanding Metrics – What to Measure, and Why - John Custy
PPTX
Service Turnaround
PPTX
Standardize the Service Desk
PPTX
Call center project - draft only
PDF
How Remote Monitoring And Management Will Revolutionize Your Help Desk Rsap...
PDF
Cyber Resilience Summit Briefing March 15, 2016
E Solution's Service Quality Analysis
Cost Analysis
First Contact Resolution - The Performance Driver!
Aligning People, Processes and Technology in Field Service
Physical processes have a gut feeling - Radwell
MB-240T00A-ENU-AppliedWorkshop-InstructorDeck.pptx
ServiceNow Field Service Management
IT Metrics Presentation
Top Issues Faced by Field Service Businesses & The Solution
Free Desktop Support Training Series | The Economic Impact of Support | What'...
Chrs & Kevin Cust Satisfaction Final Copy
Rumburg seven kp_is
Top 5 Tips to Increase Field Service Technician Utilization
Understanding Metrics – What to Measure, and Why - John Custy
Service Turnaround
Standardize the Service Desk
Call center project - draft only
How Remote Monitoring And Management Will Revolutionize Your Help Desk Rsap...
Cyber Resilience Summit Briefing March 15, 2016
Ad

Recently uploaded (20)

PPTX
Slide gioi thieu VietinBank Quy 2 - 2025
PDF
Technical Architecture - Chainsys dataZap
PDF
How to Get Approval for Business Funding
PDF
Keppel_Proposed Divestment of M1 Limited
PDF
pdfcoffee.com-opt-b1plus-sb-answers.pdfvi
PPTX
Negotiation and Persuasion Skills: A Shrewd Person's Perspective
PDF
SIMNET Inc – 2023’s Most Trusted IT Services & Solution Provider
PDF
Booking.com The Global AI Sentiment Report 2025
PDF
Solara Labs: Empowering Health through Innovative Nutraceutical Solutions
PPTX
svnfcksanfskjcsnvvjknsnvsdscnsncxasxa saccacxsax
PPTX
Principles of Marketing, Industrial, Consumers,
PPTX
2025 Product Deck V1.0.pptxCATALOGTCLCIA
PDF
Blood Collected straight from the donor into a blood bag and mixed with an an...
PDF
Tata consultancy services case study shri Sharda college, basrur
PPTX
Slide gioi thieu VietinBank Quy 2 - 2025
PDF
ANALYZING THE OPPORTUNITIES OF DIGITAL MARKETING IN BANGLADESH TO PROVIDE AN ...
PPT
Lecture 3344;;,,(,(((((((((((((((((((((((
PDF
Cours de Système d'information about ERP.pdf
PDF
NISM Series V-A MFD Workbook v December 2024.khhhjtgvwevoypdnew one must use ...
PDF
Charisse Litchman: A Maverick Making Neurological Care More Accessible
Slide gioi thieu VietinBank Quy 2 - 2025
Technical Architecture - Chainsys dataZap
How to Get Approval for Business Funding
Keppel_Proposed Divestment of M1 Limited
pdfcoffee.com-opt-b1plus-sb-answers.pdfvi
Negotiation and Persuasion Skills: A Shrewd Person's Perspective
SIMNET Inc – 2023’s Most Trusted IT Services & Solution Provider
Booking.com The Global AI Sentiment Report 2025
Solara Labs: Empowering Health through Innovative Nutraceutical Solutions
svnfcksanfskjcsnvvjknsnvsdscnsncxasxa saccacxsax
Principles of Marketing, Industrial, Consumers,
2025 Product Deck V1.0.pptxCATALOGTCLCIA
Blood Collected straight from the donor into a blood bag and mixed with an an...
Tata consultancy services case study shri Sharda college, basrur
Slide gioi thieu VietinBank Quy 2 - 2025
ANALYZING THE OPPORTUNITIES OF DIGITAL MARKETING IN BANGLADESH TO PROVIDE AN ...
Lecture 3344;;,,(,(((((((((((((((((((((((
Cours de Système d'information about ERP.pdf
NISM Series V-A MFD Workbook v December 2024.khhhjtgvwevoypdnew one must use ...
Charisse Litchman: A Maverick Making Neurological Care More Accessible

Free Desktop Support Training | Unleashing the Enormous Power of Desktop Support KPIs

  • 1. Unleashing the Enormous Power of Desktop Support KPI’s Desktop Support Best Practices Series
  • 2. Visit MetricNet’s Resource Library at www.metricnet.com © MetricNet, LLC, www.metricnet.com 1 1
  • 3. Become a MetricNet Premium Member: It’s Free! © MetricNet, LLC, www.metricnet.com 2
  • 4. MetricNet Benchmarks MetricNet Benchmarks Peer Group Benchmarks Industry Benchmarks Benchmarking Data Files © MetricNet, LLC, www.metricnet.com 3  Custom Benchmark  Unique Peer Group  Industry Benchmarking Reports by geography  Custom Benchmarking Data in Excel format
  • 5. © MetricNet, LLC, www.metricnet.com 4 Learn more at metricnet.com/path-to-world-class-performance Did you know? Industry data shows that organizations that conduct benchmarking at least once a year are far more likely to achieve world-class performance. In fact, there is a virtual 1:1 correspondence between organizations that perform benchmarking on an annual basis, and those that achieve world-class performance. “
  • 6. 5© MetricNet, LLC, www.metricnet.com Connect With MetricNet on Social Media 5 Use #MetricNetLive on Twitter to participate. Share thoughts, key points, questions or just follow along!
  • 7. MetricNet Best Practices Series Benchmark 2014 Global Results for Desktop Support
  • 8. 7© MetricNet, LLC, www.metricnet.com 27 Years of IT Service and Support Benchmarks More than 3,000 IT Service and Support Benchmarks Global Database 70+ Key Performance Indicators More than 120 Industry Best Practices
  • 9. 8 2014 Benchmarking Data: 138 Data Records from 31 Countries © MetricNet, LLC, www.metricnet.com
  • 10. 9© MetricNet, LLC, www.metricnet.com The Benchmarking Methodology Samanage Customer Service Desk Performance Performance of Benchmarking Peer Group Determine How Best in Class Achieve Superiority Adopt Selected Practices of Best in Class Build a Sustainable Competitive Advantage The ultimate objective of benchmarking COMPARE
  • 11. 10© MetricNet, LLC, www.metricnet.com The Goal of Benchmarking Cost per Ticket Quality HigherLower Higher BEST-IN-CLASS PERFORMANCE CURVE AVERAGE PERFORMANCE CURVE AFTER BENCHMARKING STARTING POINT: BEFORE BENCHMARKING
  • 12. 11© MetricNet, LLC, www.metricnet.com POLLING QUESTION
  • 13. 12© MetricNet, LLC, www.metricnet.com POLLING QUESTION
  • 14. KPI’s Used in MetricNet Desktop Support Benchmarks  Cost per Ticket  Cost per Incident  Cost per Service Request Cost ProductivityService Level Quality Ticket Handling Technician  Average Incident Response Time (minutes)  % of Incidents Resolved in 1 Business Day  Mean Time to Resolve Incidents (business hours)  Mean Time to Complete Service Requests (business days)  Technician Utilization  Tickets per Technician- Month  Incidents per Technician- Month  Service Requests per Technician-Month  Ratio of Technicians to Total Headcount  Customer Satisfaction  First Contact Resolution Rate (Incidents  % Resolved Level 1 Capable  Technician Satisfaction  New Technician Training Hours  Annual Technician Training Hours  Annual Technician Turnover  Technician Absenteeism  Technician Tenure (months)  Average Incident Work Time (min)  Average Service Request Work Time (min)  Average Travel Time per Ticket (min) Workload  Tickets per Seat per Month  Incidents per Seat per Month  Service Requests per Seat per Month  Incidents as a % of Total Ticket Volume © MetricNet, LLC, www.metricnet.com 13
  • 15. Tickets, Incidents, and Service Requests Incident Volume + Service Request Volume = Ticket Volume Tickets Incidents Service Requests  Unplanned work that requires a physical touch to a device  Hardware break/fix  Device failure  Connectivity failure  Planned work that requires a physical touch to one or more devices  Move/Add/Change  Hardware or software upgrade  Device refresh  Device set-up © MetricNet, LLC, www.metricnet.com 14
  • 16. Benchmarking Results Organized Into Three Categories High Density Medium Density Field Services © MetricNet, LLC, www.metricnet.com 15
  • 17. Benchmarking Data Summary: High Density © MetricNet, LLC, www.metricnet.com 16 Average Min Median Max Cost per Ticket $84.42 $31.98 $82.03 $179.33 Cost per Incident $69.79 $18.27 $69.35 $148.92 Cost per Service Request $118.10 $48.89 $102.56 $260.27 Tickets per Technician per Month 142.8 54.4 124.9 276.4 Incidents per Technician per Month 100.2 19.2 88.4 230.7 Service Requests per Technician per Month 42.6 10.8 41.5 100.1 Technicians as a Percent of Total FTE's 85.5% 74.8% 84.6% 94.8% Technician Utilization 54.8% 33.8% 56.5% 70.9% Mean Time to Resolve Incidents (business hours) 6.5 1.0 5.0 24.1 % of Incidents Resolved in 1 Business Day 74.9% 18.7% 79.0% 94.8% Mean Time to Fulfill Service Requests (business days) 2.9 1.0 2.6 5.7 % of Service Requests Fulfilled in 3 Business Days 56.3% 16.8% 59.2% 82.5% Customer Satisfaction 83.6% 54.9% 86.5% 95.8% Incident First Visit Resolution Rate 83.7% 66.7% 84.3% 97.2% % Resolved Level 1 Capable 20.2% 3.8% 19.8% 35.4% Annual Technician Turnover 31.4% 13.1% 27.8% 58.0% Daily Technician Absenteeism 4.6% 0.8% 4.1% 11.4% New Technician Training Hours 57 0 48 140 Annual Technician Training Hours 9 0 3 61 Technician Tenure (months) 43.6 17.6 43.9 88.4 Technician Job Satisfaction 78.9% 67.3% 79.7% 89.3% Average Incident Work Time (minutes) 24.1 8.0 19.9 53.7 Average Service Request Work Time (minutes) 46.3 20.0 40.0 140.0 Travel Time per Ticket (minutes) 9.4 7.0 8.5 19.0 Tickets per Seat per Month 0.54 0.20 0.47 1.01 Incidents per Seat per Month 0.38 0.11 0.35 0.86 Service Requests per Seat per Month 0.16 0.04 0.14 0.42 Incidents as a % of Total Ticket Volume 68.0% 33.6% 69.6% 91.6% 2014 Benchmarking Statistics (High Density) Cost Productivity Workload Metric Type Key Performance Indicator (KPI) Service Level Quality Technician Ticket Handling
  • 18. Benchmarking Data Summary: Medium Density © MetricNet, LLC, www.metricnet.com 17 Average Min Median Max Cost per Ticket $125.13 $56.46 $116.46 $288.99 Cost per Incident $112.42 $44.13 $105.45 $279.28 Cost per Service Request $158.84 $75.29 $144.92 $348.39 Tickets per Technician per Month 88.1 37.7 83.0 149.7 Incidents per Technician per Month 65.1 26.9 61.5 118.7 Service Requests per Technician per Month 22.9 4.6 23.0 52.1 Technicians as a Percent of Total FTE's 85.1% 72.1% 83.8% 97.4% Technician Utilization 55.8% 36.2% 56.0% 72.2% Mean Time to Resolve Incidents (business hours) 9.6 3.0 8.1 22.1 % of Incidents Resolved in 1 Business Day 35.7% 18.9% 38.3% 44.4% Mean Time to Fulfill Service Requests (business days) 5.1 2.1 5.1 11.1 % of Service Requests Fulfilled in 3 Business Days 26.2% 2.4% 25.6% 39.6% Customer Satisfaction 85.1% 51.3% 87.1% 99.1% Incident First Visit Resolution Rate 84.9% 68.0% 86.3% 97.8% % Resolved Level 1 Capable 21.5% 4.8% 21.7% 33.7% Annual Technician Turnover 25.3% 2.5% 24.8% 53.7% Daily Technician Absenteeism 4.7% 0.1% 3.7% 13.4% New Technician Training Hours 62 0 65 135 Annual Technician Training Hours 13 0 7 59 Technician Tenure (months) 53.9 18.2 47.3 110.3 Technician Job Satisfaction 81.1% 68.2% 80.6% 97.6% Average Incident Work Time (minutes) 21.2 8.0 19.7 51.3 Average Service Request Work Time (minutes) 45.1 20.0 38.5 124.0 Travel Time per Ticket (minutes) 37.6 20.0 37.5 78.0 Tickets per Seat per Month 0.56 0.21 0.57 1.16 Incidents per Seat per Month 0.42 0.12 0.42 1.00 Service Requests per Seat per Month 0.13 0.04 0.12 0.45 Incidents as a % of Total Ticket Volume 73.0% 40.8% 76.9% 94.7% 2014 Benchmarking Statistics (Medium Density) Cost Productivity Workload Metric Type Key Performance Indicator (KPI) Service Level Quality Technician Ticket Handling
  • 19. Benchmarking Data Summary: Field Services © MetricNet, LLC, www.metricnet.com 18 Average Min Median Max Cost per Ticket $249.27 $97.12 $243.90 $508.45 Cost per Incident $232.62 $88.75 $220.48 $477.79 Cost per Service Request $282.58 $103.01 $266.42 $577.19 Tickets per Technician per Month 46.6 26.6 44.9 85.5 Incidents per Technician per Month 31.4 13.0 28.7 64.9 Service Requests per Technician per Month 15.1 4.2 13.1 40.4 Technicians as a Percent of Total FTE's 85.0% 71.9% 85.0% 96.9% Technician Utilization 57.7% 35.7% 58.9% 72.5% Mean Time to Resolve Incidents (business hours) 13.9 5.7 12.9 31.2 % of Incidents Resolved in 1 Business Day 24.3% 10.6% 25.0% 32.7% Mean Time to Fulfill Service Requests (business days) 7.3 3.0 6.9 13.3 % of Service Requests Fulfilled in 3 Business Days 16.4% 1.5% 17.7% 26.3% Customer Satisfaction 81.4% 48.0% 85.0% 98.0% Incident First Visit Resolution Rate 83.4% 70.0% 82.8% 97.3% % Resolved Level 1 Capable 19.7% 7.6% 19.9% 32.9% Annual Technician Turnover 27.8% 11.0% 28.5% 55.6% Daily Technician Absenteeism 4.7% 0.7% 4.0% 11.1% New Technician Training Hours 62 0 61 185 Annual Technician Training Hours 10 0 8 46 Technician Tenure (months) 47.3 21.5 41.4 96.2 Technician Job Satisfaction 79.6% 68.7% 79.4% 89.8% Average Incident Work Time (minutes) 19.8 8.0 16.9 44.5 Average Service Request Work Time (minutes) 44.7 20.0 39.0 113.0 Travel Time per Ticket (minutes) 99.4 60.0 92.0 181.0 Tickets per Seat per Month 0.53 0.21 0.47 1.19 Incidents per Seat per Month 0.36 0.11 0.31 0.95 Service Requests per Seat per Month 0.16 0.04 0.14 0.40 Incidents as a % of Total Ticket Volume 66.5% 39.8% 67.6% 91.4% 2014 Benchmarking Statistics (Field Services) Cost Productivity Workload Metric Type Key Performance Indicator (KPI) Service Level Quality Technician Ticket Handling
  • 20. Benchmarking Data Summary: Comparative Averages © MetricNet, LLC, www.metricnet.com 19 High Density Medium Density Field Services Cost per Ticket $84.42 $125.13 $249.27 Cost per Incident $69.79 $112.42 $232.62 Cost per Service Request $118.10 $158.84 $282.58 Tickets per Technician per Month 142.8 88.1 46.6 Incidents per Technician per Month 100.2 65.1 31.4 Service Requests per Technician per Month 42.6 22.9 15.1 Technicians as a Percent of Total FTE's 85.5% 85.1% 85.0% Technician Utilization 54.8% 55.8% 57.7% Mean Time to Resolve Incidents (business hours) 6.5 9.6 13.9 % of Incidents Resolved in 1 Business Day 74.9% 35.7% 24.3% Mean Time to Fulfill Service Requests (business days) 2.9 5.1 7.3 % of Service Requests Fulfilled in 3 Business Days 56.3% 26.2% 16.4% Customer Satisfaction 83.6% 85.1% 81.4% Incident First Visit Resolution Rate 83.7% 84.9% 83.4% % Resolved Level 1 Capable 20.2% 21.5% 19.7% Annual Technician Turnover 31.4% 25.3% 27.8% Daily Technician Absenteeism 4.6% 4.7% 4.7% New Technician Training Hours 57 62 62 Annual Technician Training Hours 9 13 10 Technician Tenure (months) 43.6 53.9 47.3 Technician Job Satisfaction 78.9% 81.1% 79.6% Average Incident Work Time (minutes) 24.1 21.2 19.8 Average Service Request Work Time (minutes) 46.3 45.1 44.7 Travel Time per Ticket (minutes) 9.4 37.6 99.4 Tickets per Seat per Month 0.54 0.56 0.53 Incidents per Seat per Month 0.38 0.42 0.36 Service Requests per Seat per Month 0.16 0.13 0.16 Incidents as a % of Total Ticket Volume 68.0% 73.0% 66.5% 2014 Benchmarking Averages Cost Productivity Workload Metric Type Key Performance Indicator (KPI) Service Level Quality Technician Ticket Handling
  • 21. Key Metrics Magnified © MetricNet, LLC, www.metricnet.com 20 High Density Medium Density Field Services Cost per Ticket $84.42 $125.13 $249.27 Travel Time per Ticket (minutes) 9.4 37.6 99.4 Average Incident Work Time (minutes) 24.1 21.2 19.8 Average Service Request Work Time (minutes) 46.3 45.1 44.7 Customer Satisfaction 83.6% 85.1% 81.4% Tickets per Technician per Month 142.8 88.1 46.6 Technician Utilization 54.8% 55.8% 57.7% Mean Time to Resolve Incidents (business hours) 6.5 9.6 13.9 Mean Time to Fulfill Service Requests (business days) 2.9 5.1 7.3 % Resolved Level 1 Capable 20.2% 21.5% 19.7% Tickets per Seat per Month 0.54 0.56 0.53 2014 Benchmarking Averages Key Performance Indicator (KPI)
  • 22. The Desktop Support Balanced Scorecard Step 1 Eight critical performance metrics have been selected for the scorecard Step 2 Each metric has been weighted according to its relative importance Step 3 For each performance metric, the highest and lowest performance levels in the benchmark are recorded Step 4 Your actual performance for each metric is recorded in this column Step 5 Your score for each metric is then calculated: (worst case – actual performance) / (worst case – best case) X 100 Step 6 Your balanced score for each metric is calculated: metric score X weighting 21 Worst Case Best Case Cost per Incident 15.0% $312.00 $19.00 $48.00 90.1% 13.5% Cost per Service Request 15.0% $556.00 $41.00 $113.00 86.0% 12.9% Customer Satisfaction 25.0% 67.0% 94.0% 83.0% 59.3% 14.8% Technician Utilization 15.0% 36.0% 84.0% 59.0% 47.9% 7.2% First Contact Resolution Rate (incidents) 15.0% 38.0% 84.0% 61.0% 50.0% 7.5% % of Incidents Resolved in 24 Hours 5.0% 19.0% 71.0% 58.0% 75.0% 3.8% Mean Time to Complete Service Requests (days) 5.0% 18.4 1.8 5.8 75.9% 3.8% Technician Satisfaction 5.0% 59.0% 93.0% 84.0% 73.5% 3.7% Total 100.0% N/A N/A N/A N/A 67.1% Balanced Score Your Actual Performance Metric Score Performance RangeMetric WeightingPerformance Metric
  • 23. The Scorecard Allows a Fair Benchmarking Comparison 0.0% 10.0% 20.0% 30.0% 40.0% 50.0% 60.0% 70.0% 80.0% 90.0% 100.0% DesktopSupportBalancedScores High 86.2% Average ----- 51.9% Median 50.1% Low 16.0% Your Score 67.1% Desktop Support Balanced Scores Key Statistics © MetricNet, LLC, www.metricnet.com 22
  • 24. Desktop Support Scorecard Trend 40% 45% 50% 55% 60% 65% 70% 75% 80% 85% Jan Feb Mar Apr May Jun Jul Aug Sep Oct Nov Dec DesktopSupportBalancedScore 12 Month Average Monthly Score © MetricNet, LLC, www.metricnet.com 23
  • 25. 24© MetricNet, LLC, www.metricnet.com Empirical Observations from the Best-in-Class 1. Performance Measurement and Management as a Holistic Discipline 2. Annual Benchmarking – 1:1 Correspondence 3. Significant Investments in Technician Training 4. Understanding and Exploiting TCO and First Level Resolution 5. Selective Investments in Technology – Remote Control and Knowledge Management 6. Process Optimization (ITIL, ITSM) 7. Driving Accountability to Technician Level 8. Marketing Service and Support 9. The Widespread Adoption of ROI Analysis 10. Managing Service and Support as a Business
  • 26. 25© MetricNet, LLC, www.metricnet.com Empirical Observations from the Best-in-Class 1. Performance Measurement and Management as a Holistic Discipline 2. Annual Benchmarking – 1:1 Correspondence 3. Significant Investments in Technician Training 4. Understanding and Exploiting TCO and First Level Resolution 5. Selective Investments in Technology – Remote Control and Knowledge Management 6. Process Optimization (ITIL, ITSM) 7. Driving Accountability to Technician Level 8. Marketing Service and Support 9. The Widespread Adoption of ROI Analysis 10. Managing Service and Support as a Business
  • 27. Metrics as a Fundamental Building Block in IT Support METRICS PEOPLE PROCESS TECH 26© MetricNet, LLC, www.metricnet.com
  • 28. 10% 20% 30% 40% 50% 60% 70% 80% 90% 100% 1 2 3 4 5 Metrics Maturity Ranking DesktopSupportBalancedScore The Evidence for Metrics as a Foundation Discipline n = 143 27© MetricNet, LLC, www.metricnet.com
  • 29. 28© MetricNet, LLC, www.metricnet.com Two Paradigms for Desktop Support KPI’s The Historical Approach The Holistic Approach Measurement (75%) Analysis (15%) Prescription (7.5%) Action (2.5%) Measurement (5%) Analysis (20%) Prescription (30%) Action (45%) IncreasingValue!
  • 30. The 80/20 Rule for Desktop Support KPI’s  Cost per TicketCost Productivity Quality Call Handling  Technician Utilization  Customer satisfaction  First contact resolution rate (incidents) Technician  Technician Satisfaction Aggregate  Balanced scorecard TCO  % Resolved Level 1 Capable Service Level  Mean Time to Resolve © MetricNet, LLC, www.metricnet.com 29
  • 31. Cost and Quality: Nothing Else Matters! Lower Cost Cost per Ticket (Efficiency) CustomerSatisfaction (Effectiveness) Top Quartile Efficient and Effective Lower Quartile Middle Quartiles Effective but not Efficient Middle Quartiles Efficient but not Effective World-Class Desktop Support Peer Group Higher Cost Lower Quality Higher Quality © MetricNet, LLC, www.metricnet.com 30
  • 32. Desktop Support KPI’s: Cause-and-Effect Cost per Ticket Customer Satisfaction Technician Utilization FCR (Incidents) Technician Satisfaction Coaching Career Path Training Hours SL’s MTTR Work/ Travel Time Techs/ Total FTE’s Absenteeism/ Turnover % Resolved Level 1 Capable Scheduling Efficiency Service Levels: MTTR © MetricNet, LLC, www.metricnet.com 31
  • 33. 32© MetricNet, LLC, www.metricnet.com 1. Performance Measurement and Management as a Holistic Discipline 2. Annual Benchmarking – 1:1 Correspondence 3. Significant Investments in Technician Training 4. Understanding and Exploiting TCO and First Level Resolution 5. Selective Investments in Technology – Remote Control and Knowledge Management 6. Process Optimization (ITIL, ITSM) 7. Driving Accountability to Technician Level 8. Marketing Service and Support 9. The Widespread Adoption of ROI Analysis 10. Managing Service and Support as a Business Empirical Observations from the Best-in-Class
  • 34. Desktop Support KPI’s: Cause-and-Effect Cost per Ticket Customer Satisfaction Technician Utilization FCR (Incidents) Technician Satisfaction Coaching Career Path Training Hours SL’s MTTR Work/ Travel Time Techs/ Total FTE’s Absenteeism/ Turnover % Resolved Level 1 Capable Scheduling Efficiency Service Levels: MTTR © MetricNet, LLC, www.metricnet.com 33
  • 35. New Technician Training Hours vs. Technician Satisfaction 20% 30% 40% 50% 60% 70% 80% 90% 100% 0.0 50.0 100.0 150.0 200.0 250.0 New Technician Training Hours TechnicianSatisfaction © MetricNet, LLC, www.metricnet.com 34
  • 36. Annual Training Hours vs. Technician Job Satisfaction 40% 50% 60% 70% 80% 90% 100% 0 20 40 60 80 100 120 140 Annual Technician Training Hours TechnicianSatisfaction © MetricNet, LLC, www.metricnet.com 35
  • 37. 36© MetricNet, LLC, www.metricnet.com Empirical Observations from the Best-in-Class 1. Performance Measurement and Management as a Holistic Discipline 2. Annual Benchmarking – 1:1 Correspondence 3. Significant Investments in Technician Training 4. Understanding and Exploiting TCO and First Level Resolution 5. Selective Investments in Technology – Remote Control and Knowledge Management 6. Process Optimization (ITIL, ITSM) 7. Driving Accountability to Technician Level 8. Marketing Service and Support 9. The Widespread Adoption of ROI Analysis 10. Managing Service and Support as a Business
  • 38. Cost of Resolution: North American Averages Support Level Cost per Ticket Vendor Level 2: Desktop Support Field Support Level 3 IT (apps, networking, NOC, etc.) Level 1: Service Desk $471 $196 $85 $62 $22 © MetricNet, LLC, www.metricnet.com 37
  • 39. © MetricNet, LLC, www.metricnet.com Cost of Resolution: North American Averages 38
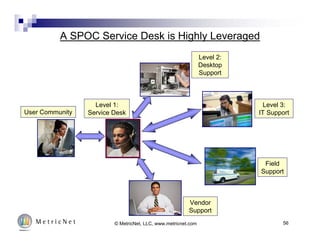
  • 40. 39© MetricNet, LLC, www.metricnet.com The Tao of SPOC (Single Point of Contact) User Community Level 1 Service Desk Desktop Support Field Support Level 2 IT Support Vendor Support 39
  • 41. 40© MetricNet, LLC, www.metricnet.com Key SPOC Principles Key SPOC Principles  Enterprise takes an end-to-end view of user support  User/Customer has a single point of contact for all IT-related incidents, questions, problems, and work requests  The Level 1 Service Desk is the SPOC  Level 1 is responsible for:  Ticket triage  Resolution at Level 1 if possible  Effective handoffs to n level support  Resolution coordination and facilitation  Ticket closure  Desktop “Drive-bys”, “Fly-bys”, and “Snags” are strongly discouraged
  • 42. 41© MetricNet, LLC, www.metricnet.com SPOC Support Reduces Total Cost of Ownership 0% 5% 10% 15% 20% 25% 30% 35% 40% %ResolvedLevel1Capable % Resolved Level 1 Capable with SPOC % Resolved Level 1 Capable without SPOC Average = 22.8% Average = 15.3%
  • 43. 42© MetricNet, LLC, www.metricnet.com Empirical Observations from the Best-in-Class 1. Performance Measurement and Management as a Holistic Discipline 2. Annual Benchmarking – 1:1 Correspondence 3. Significant Investments in Technician Training 4. Understanding and Exploiting TCO and First Level Resolution 5. Selective Investments in Technology – Remote Control and Knowledge Management 6. Process Optimization (ITIL, ITSM) 7. Driving Accountability to Technician Level 8. Marketing Service and Support 9. The Widespread Adoption of ROI Analysis 10. Managing Service and Support as a Business
  • 44. 43© MetricNet, LLC, www.metricnet.com Two Metrics You Should Know % Resolved Level 1 Capable (PRLC) The percentage of tickets resolved by desktop support that could have been resolved at level 1 support. First Level Resolution Rate (FLR) The number of tickets resolved at level 1 divided by all tickets that can potentially be resolved at level 1.
  • 45. 44© MetricNet, LLC, www.metricnet.com POLLING QUESTION
  • 46. 45© MetricNet, LLC, www.metricnet.com POLLING QUESTION
  • 47. 46© MetricNet, LLC, www.metricnet.com 0.0% 10.0% 20.0% 30.0% 40.0% 50.0% 60.0% 70.0% 80.0% 90.0% 100.0% NetFirstLevelResolution Remote Diagnostic Software No Remote Diagnostic Software The Effect of Remote Control Software on FLR Average = 77.8% FLR Average = 61.4% FLR
  • 48. 47© MetricNet, LLC, www.metricnet.com The Effect of a Mature Knowledge Base on FLR 0.0% 10.0% 20.0% 30.0% 40.0% 50.0% 60.0% 70.0% 80.0% 90.0% 100.0% 0 1 2 3 4 5 6 KBase Maturity NetFirstLevelResolution
  • 49. 48© MetricNet, LLC, www.metricnet.com 1. Performance Measurement and Management as a Holistic Discipline 2. Annual Benchmarking – 1:1 Correspondence 3. Significant Investments in Technician Training 4. Understanding and Exploiting TCO and First Level Resolution 5. Selective Investments in Technology – Remote Control and Knowledge Management 6. Process Optimization (ITIL, ITSM) 7. Driving Accountability to Technician Level 8. Marketing Service and Support 9. The Widespread Adoption of ROI Analysis 10. Managing Service and Support as a Business Empirical Observations from the Best-in-Class
  • 50. 49© MetricNet, LLC, www.metricnet.com Driving Individual Accountability: The Technician Scorecard Step 1 Eight critical performance metrics have been selected for the scorecard Step 2 Each metric has been weighted according to its relative importance Step 3 For each performance metric, the highest and lowest performance levels in the benchmark are recorded Step 4 Your actual performance for each metric is recorded in this column Step 5 Your score for each metric is then calculated: (worst case – actual performance) / (worst case –best case) X 100 Step 6 Your balanced score for each metric is calculated: metric score X weighting 49 Worst Case Best Case Customer Satisfaction 20.0% 67.0% 94.0% 83.0% 59.3% 11.9% First Contact Resolution Rate (Incidents) 20.0% 38.0% 84.0% 61.0% 50.0% 10.0% Incidents Closed this Month 15.0% 19.9 76.9 59.8 69.9% 10.5% Service Requests Closed This Month 15.0% 15.6 42.2 28.5 48.6% 7.3% Unplanned Absenteeism 7.5% 0.0% 22.0% 19.0% 86.4% 6.5% Teamwork 7.5% 0.0 5.0 3.5 69.9% 5.2% Initiative 7.5% 0.0 5.0 5.0 100.0% 7.5% Mentoring 7.5% 0.0 5.0 4.5 90.0% 6.7% Total 100.0% N/A N/A N/A N/A 43.7% Balanced Score Your Actual Performance Metric Score Performance RangeMetric WeightingPerformance Metric
  • 51. 50© MetricNet, LLC, www.metricnet.com Monthly Technician Performance Postings Sep Aug Jul Jun May Apr 11 1 95.8% 98.0% 97.1% 95.7% 98.3% 97.3% 97.0% 32 2 92.8% 92.1% 90.3% 89.3% 84.6% 92.2% 90.2% 21 3 91.5% 88.5% 83.2% 94.0% 93.7% 93.5% 90.7% 35 4 91.0% 86.8% 85.2% 78.5% 80.5% 68.2% 81.7% 14 5 89.5% 89.1% 90.0% 90.1% 92.3% 92.1% 90.5% 26 6 83.8% 84.4% 90.2% 86.5% 77.8% 63.9% 81.1% 25 7 83.0% 73.6% 81.9% 72.1% 84.8% 87.9% 80.5% 15 8 70.4% 66.6% 53.3% 56.3% 56.6% 39.0% 57.0% 20 9 64.9% 66.5% 70.1% 56.9% 40.9% 72.7% 62.0% 31 10 62.3% 47.4% 22.7% 38.4% 26.0% 93.0% 48.3% 16 11 61.0% 62.8% 54.5% 45.9% 41.7% 62.7% 54.8% 17 12 57.9% 42.1% 32.3% 71.6% 60.3% 60.3% 54.1% 33 13 56.8% 75.5% 64.8% 80.3% 79.7% 73.5% 71.8% 13 14 52.2% 34.9% 61.0% 52.8% 58.9% 48.7% 51.4% 24 15 48.9% 66.7% 86.9% 87.7% 83.6% 74.5% 74.7% 28 16 46.4% 45.5% 19.3% 40.3% 28.8% 32.4% 35.4% 27 17 43.7% 26.5% 31.5% 24.3% 22.2% 17.2% 27.6% 19 18 41.5% 28.4% 50.1% 48.1% 71.1% 81.0% 53.4% 23 19 39.1% 52.3% 57.1% 86.4% 87.7% 88.9% 68.6% 22 20 36.8% 18.7% 19.3% 52.9% 66.4% 64.3% 43.1% 12 21 36.6% 43.2% 33.1% 65.7% 69.0% 86.0% 55.6% 30 22 36.3% 22.6% 23.5% 85.8% 81.5% 70.3% 53.3% 29 23 34.1% 44.9% 50.2% 28.3% 48.9% 36.9% 40.5% 34 24 33.4% 37.9% 23.1% 21.7% 29.7% 22.6% 28.0% 18 25 32.6% 68.4% 80.4% 88.4% 83.8% 91.6% 74.2% 59.3% 58.5% 58.0% 65.5% 66.0% 68.4% 62.6% Monthly Ranking Monthly Average Technician Number Monthly Scorecard Performance Six Month Average
  • 52. 51© MetricNet, LLC, www.metricnet.com 1. Performance Measurement and Management as a Holistic Discipline 2. Annual Benchmarking – 1:1 Correspondence 3. Significant Investments in Technician Training 4. Understanding and Exploiting TCO and First Level Resolution 5. Selective Investments in Technology – Remote Control and Knowledge Management 6. Process Optimization (ITIL, ITSM) 7. Driving Accountability to Technician Level 8. Marketing Service and Support 9. The Widespread Adoption of ROI Analysis 10. Managing Service and Support as a Business Empirical Observations from the Best-in-Class
  • 53. 52© MetricNet, LLC, www.metricnet.com Perception vs. Reality in Service and Support LOWER COST HIGHERACTUAL VALUE PERCEIVED VALUE HIGHER LOWER Perceived Value > Actual Value Perceived Value < Actual Value Perceived Value = Actual Value
  • 54. 53 Where Does Your Desktop Support Operate? LOWER COST HIGHERACTUAL VALUE PERCEIVED VALUE HIGHER LOWER Perceived Value > Actual Value Perceived Value < Actual Value Perceived Value = Actual Value A Common (but Dangerous) Operating Position © MetricNet, LLC, www.metricnet.com
  • 55. 54 Operational Effectiveness First! LOWER COST HIGHERACTUAL VALUE PERCEIVED VALUE HIGHER LOWER Perceived Value > Actual Value Perceived Value < Actual Value Perceived Value = Actual Value #1 Operational Effectiveness #2Brand Management © MetricNet, LLC, www.metricnet.com
  • 56. 55 Closing the Perception vs. Reality Gap LOWER COST HIGHERACTUAL VALUE PERCEIVED VALUE HIGHER LOWER Perceived Value > Actual Value Perceived Value < Actual Value Perceived Value = Actual Value Closing the Perception Gap Where you Should Be Where you Are © MetricNet, LLC, www.metricnet.com
  • 57. 56© MetricNet, LLC, www.metricnet.com Image Management: The Five W’s 1. Who – Who are the Key Stakeholder Groups? 2. What – What are the Key Messages? 3. When – When are You Going to Communicate Them? 4. Where/How – Where/How do You Reach the Stakeholders? 5. Why – Why are We Doing This?
  • 58. 57© MetricNet, LLC, www.metricnet.com Key Success Factors in Desktop Image Management MessagesTiming Channels Timing Frequent Contact • New employee orientation • At log-in • During training • During the incident • At scheduled sessions Messages Multiple Messages • Services • Major initiatives • Performance Levels • FAQ’s • Success Stories Channels Use All Available • User liaisons • Newsletters • Reference Guides • Surveys • Log-in messages
  • 59. 58© MetricNet, LLC, www.metricnet.com Why are We Doing This? We’ve all heard the expression… “Expectations Not Set… are Expectations Not Met! So, let’s get serious about proactively managing expectations!
  • 60. 59© MetricNet, LLC, www.metricnet.com 59© MetricNet, LLC, www.metricnet.com 59
  • 61. 60© MetricNet, LLC, www.metricnet.com Marketing Summary  Managing the gap between perception and reality is fairly straightforward  It doesn’t take a lot of time, or cost a lot of money  But it is critically important  The success of Level 1 and Desktop Support depends as much on your image, as it does on your actual performance!  The Benefits of effective Image Management Include:  Customer loyalty and positive word-of-mouth referrals  Credibility, which leverages your ability to Get Things Done!  A Positive Image for IT overall  High levels of Customer Satisfaction
  • 62. 61© MetricNet, LLC, www.metricnet.com 1. Performance Measurement and Management as a Holistic Discipline 2. Annual Benchmarking – 1:1 Correspondence 3. Significant Investments in Technician Training 4. Understanding and Exploiting TCO and First Level Resolution 5. Selective Investments in Technology – Remote Control and Knowledge Management 6. Process Optimization (ITIL, ITSM) 7. Driving Accountability to Technician Level 8. Marketing Service and Support 9. The Widespread Adoption of ROI Analysis 10. Managing Service and Support as a Business Empirical Observations from the Best-in-Class
  • 63. 62© MetricNet, LLC, www.metricnet.com 62 The Paradox of IT Support  Less than 5% of all IT spending is allocated to end-user support  Service desk, desktop support, field support  This leads many to erroneously assume that there is little upside opportunity in IT support  The result is that most support organizations are managed with the goal of minimizing costs  But the most effective support strategies focus on maximizing valueCorporate IT Spending Breakdown 4% 96%: Non support functions End-User Support  Application Development  Application Maintenance  Network Operations  Mainframe and midrange Computing  Desktop Computing  Contract Services (e.g., disaster recovery)
  • 64. 63© MetricNet, LLC, www.metricnet.com Support Level Cost per Ticket Vendor Level 2: Desktop Support Field Support Level 3 IT (apps, networking, NOC, etc.) Level 1: Service Desk $471 $196 $85 $62 $22 Support Has an Opportunity to Minimize TCO
  • 65. © MetricNet, LLC, www.metricnet.com Cost of Resolution: North American Averages 64
  • 66. 65© MetricNet, LLC, www.metricnet.com 0 10 20 30 40 50 60 70 0 1 2 3 4 5 ProductiveHoursLostperEmployeeperYear Quality of Support Drives End-User Productivity 1 (top) 2 3 4 (bottom) Customer Satisfaction 93.5% 84.5% 76.1% 69.3% First Contact Resolution Rate 90.1% 83.0% 72.7% 66.4% Mean Time to Resolve (hours) 0.8 1.2 3.6 5.0 Customer Satisfaction 94.4% 89.2% 79.0% 71.7% First Contact Resolution Rate 89.3% 85.6% 80.9% 74.5% Mean Time to Resolve (hours) 2.9 4.8 9.4 12.3 Service Desk Desktop Support Performance Quartile Support Function Key Performance Indicator 37.4 46.9Average Productive Hours Lost per Employee per Year 17.1 25.9 Performance Quartile n = 60
  • 67. 84% 47% 31% 29% 22% 19% 8% 0% 10% 20% 30% 40% 50% 60% 70% 80% 90% Service Desk Desktop Support Network Outages VPN Training Enterprise Applications Desktop Software Factors Contributing to IT Customer Satisfaction %SayingVeryImportant  n = 1,044  Global large cap companies  Survey type: multiple choice  3 responses allowed per survey  84% cited the service desk as a very important factor in their overall satisfaction with corporate IT  47% cited desktop support as a very important factor in their overall satisfaction with corporate IT 66© MetricNet, LLC, www.metricnet.com Desktop Support Drives Customer Satisfaction for All of IT
  • 68. What We Learned from Benchmark 2014  Desktop Support is now being managed as a strategic asset within the enterprise  One that can reduce the overall cost of IT  Dramatically improve the productivity of end-users  And drive a positive view of IT  World-Class Desktop Support organizations have a number of success factors in common 1. Part of an end-to-end support process 2. An understanding of the economics of TCO for user support 3. Active efforts to maximize First Contact, and First Level resolution rates 4. Use performance metrics diagnostically and prescriptively 5. Invest in technician training, coaching, and career pathing 6. Have active internal marketing efforts 7. And aggressively promote and communicate the value delivered by Desktop Support 67© MetricNet, LLC, www.metricnet.com
  • 69. A Call to Action: Your Opportunity to Excel! 68
  • 70. 69© MetricNet, LLC, www.metricnet.com Five Ideas to Get You Started! 4 3 2 1 Customer Enthusiasm Measure Diagnose Prescribe Implement 4. Browse MetricNet’s Resource Library 1. Visit Our Website and Become a Free Member 2. Connect with MetricNet on Social Media 5. Participate in a MetricNet IT Support Benchmark 3. Register for Future MetricNet Webcasts Five Opportunities to Get Started!
  • 71. Visit MetricNet’s Resource Library at www.metricnet.com © MetricNet, LLC, www.metricnet.com 70 70
  • 72. Become a Member: It’s Free! © MetricNet, LLC, www.metricnet.com 71
  • 73. 72© MetricNet, LLC, www.metricnet.com Connect With MetricNet on Social Media Company Page Best Practices in Call Centers - Group Best Practices in Customer Satisfaction - Group Best Practices in Desktop Support - Group Best Practices in Service Desks - Group Company PageBest Practices in Service Desks - Community Best Practices in Desktop Support - Community Best Practices in Customer Satisfaction - Community Best Practices in Call Centers - Community
  • 74. 73© MetricNet, LLC, www.metricnet.com MetricNet on Social Media  Like us on Facebook:  http://www.facebook.com/metricnet | Mention us using @MetricNet  Follow us on Twitter:  http://www.twitter.com/metricnet | Mention us using @MetricNet or #MetricNet  Follow our LinkedIn Company Page:  http://www.linkedin.com/company/metricnet  Become a Member of our MetricNet Certified LinkedIn Groups:  http://www.linkedin.com/groups/Best-Practices-in-Call-Centers-1801665  http://www.linkedin.com/groups/Best-Practices-in-Customer-Satisfaction-1825753  http://www.linkedin.com/groups/Best-Practices-in-Desktop-Support-4034463  http://www.linkedin.com/groups/Best-Practices-in-Service-Desks-1801657  Subscribe to YouTube:  http://www.youtube.com/metricnet  Follow our Google+ Company Page:  http://plus.google.com/u/0/b/111056508365533897358/111056508365533897358/posts Mention us using +MetricNet  Become a Member of our Google+ Communities:  http://plus.google.com/u/0/b/111056508365533897358/communities/111509357790346291238  http://plus.google.com/u/0/b/111056508365533897358/communities/117245911462171588332  http://plus.google.com/u/0/b/111056508365533897358/communities/114421701803292354205  http://plus.google.com/u/0/b/111056508365533897358/communities/109121315816446874775
  • 75. 74© MetricNet, LLC, www.metricnet.com© MetricNet, LLC, www.metricnet.com Upcoming MetricNet Webcasts  June 2015  Call Center Key Performance Indicators  June 2015  The Role of IT Leadership in Service and Support  July 2015  Service Desk Best Practices  September 2015  Benchmarking Roundup: Summary of 2015 Service and Support Benchmarks  October 2015  The Zen of Support For more information on Industry Best Practices, please register for MetricNet’s FREE upcoming webcasts © MetricNet, LLC, www.metricnet.com 74 Register at www.metricnet.com
  • 76. 75© MetricNet, LLC, www.metricnet.com Download Free Content from Our Resource Library Download at www.metricnet.com © MetricNet, LLC, www.metricnet.com 75
  • 77. MetricNet Benchmarks MetricNet Benchmarks Peer Group Benchmarks Industry Benchmarks Benchmarking Data Files © MetricNet, LLC, www.metricnet.com 76  Custom Benchmark  Unique Peer Group  Diagnostic  Industry Benchmarking Reports by geography  Custom Benchmarking Data in Excel format  Unique Peer Group
  • 78. © MetricNet, LLC, www.metricnet.com 77 Learn more at metricnet.com/path-to-world-class-performance Did you know? Industry data shows that organizations that conduct benchmarking at least once a year are far more likely to achieve world-class performance. In fact, there is a virtual 1:1 correspondence between organizations that perform benchmarking on an annual basis, and those that achieve world-class performance. “
  • 79. 78© MetricNet, LLC, www.metricnet.com You Can Reach MetricNet… By Phone… 703-992-7559 On Our Website… www.metricnet.com Or E-mail us… info@metricnet.com
  • 83. 82 Your Speaker: Jeff Rumburg © MetricNet, LLC, www.metricnet.com  Co Founder and Managing Partner, MetricNet, LLC  Winner of the 2014 Ron Muns Lifetime Achievement Award  Former CEO, The Verity Group  Former Vice President, Gartner  Founder of the Service Desk Benchmarking Consortium  Author of A Hands-On Guide to Competitive Benchmarking  Harvard MBA, Stanford MS
  • 84. 83© MetricNet, LLC, www.metricnet.com Benchmarking is MetricNet’s Core Business Call Centers Telecom Information Technology Satisfaction  Customer Service  Technical Support  Telemarketing/Telesales  Collections  Service Desk  Desktop Support  Field Support  Price Benchmarking  Customer Satisfaction  Employee Satisfaction
  • 85. 84© MetricNet, LLC, www.metricnet.com 27 Years of IT Service and Support Benchmarking Data More than 3,000 IT Service and Support Benchmarks Global Database 70+ Key Performance Indicators More than 120 Industry Best Practices
  • 86. 85© MetricNet, LLC, www.metricnet.com Meet a Sampling of Our Clients MetricNet Conducts benchmarking for IT Service and Support organizations worldwide, and across virtually every industry sector.
  • 87. 86© MetricNet, LLC, www.metricnet.com You Can Reach MetricNet… By Phone… 703-992-7559 On Our Website… www.metricnet.com Or E-mail us… info@metricnet.com