SlideShare a Scribd company logo
The Responsible Trader Lessons 
The Responsible Trader’s - POV 
The Responsible Trader Lessons 
Module 5 – Volume and Open Interest
The Responsible Trader Lessons 
The Responsible Trader’s - POV 
• The Responsible Trader's POV (Point of View). 
• These are my notes, my own additional research and studies on the 
Topic that I posted, and my personal observations and opinions that I 
am sharing to further enhance our knowledge and understanding. 
• Some of these were previously posted on “The Responsible Trader” 
thread, Stock Market Pilipinas (www.stockmarketpilipinas.com). This 
is the latest version of previous posts I made. 
• Some of these plus further explanations and discussions will be 
appearing in my forthcoming book “The Responsible Trader.” 
The Responsible Trader Lessons
The Responsible Trader Lessons 
Quick Review – In Economics 101, what do you call the Blue Line and the Orange Line? 
RED FOR RESISTANCE 
GREEN FOR SUPPORT 
The Responsible Trader Lessons
The Responsible Trader Lessons 
Quick Review – In Economics 101, what do you call the Blue Line and the Orange Line? 
RED FOR RESISTANCE 
GREEN FOR SUPPORT 
Blue – Demand Line 
Orange – Supply Line 
The Responsible Trader Lessons
The Responsible Trader Lessons 
Quick Review: 
When Bears Attack what are 
the probable Bulls Defenses?
The Responsible Trader Lessons 
Support against the downtrend 
NEUTRAL 
Just maintain a certain price level 
The Responsible Trader Lessons 
Bears Attack and Bulls Defenses 
ACTIVE 
PASSIVE 
Keeping with the downtrend
The Responsible Trader Lessons 
Let us now go to Module 5 – Volume and Open Interest 
Open Interest applies to Futures and Options only. I will limit our discussion to 
Volume so as not to complicate matters. 
Technical Analysis is based on two factors. These are Price and Volume. 
Our discussions so far have been about price movements, although we have 
acknowledged the importance of volume in confirming or denying what prices 
seem to be telling us. Price is certainly the most important. Volume is used 
primarily to confirm what the price is indicating. 
Of all the data in Technical Analysis, Volume is most often overlooked and 
taken for granted. 
The Responsible Trader Lessons
The Responsible Trader Lessons 
Volume is simply the number of shares traded over a given period of time. On some charting 
softwares, Volume is already integrated on the chart. On some trading platforms, it could be 
presented separately. 
Chart with Volume Integrated Chart with Volume Presented Separately 
The Responsible Trader Lessons 
Charts courtesy of Amibroker Charting Software 
C
The Responsible Trader Lessons 
Use of Volume in Determining Trend and Role of Volume during 
Formation of Patterns. 
Volume when properly understood and applied is one of the best ways of determining 
direction of the trend. Usually, volume increases in the direction of the trend. 
Volume also plays an important role in the formation and resolution of price patterns. Each of 
the price patterns discussed previously has its own volume pattern. As a rule, volume tends 
to diminish as price patterns form. The subsequent breakout that resolves the pattern takes 
on added significance if the price break-out is accompanied by heavier volume. Heavier 
volume accompanying the breaking of trendlines and support or resistance levels lends 
greater weight to price activity. 
The Responsible Trader Lessons
The Responsible Trader Lessons 
Volume increases in the direction of the trend. It is the best way of determining whether a 
resistance break is a Real Break out or just a Fake out. This is often overlooked by new traders. 
Real Breakout - accompanied with High Volume Fake-out – accompanied with Low Volume 
The Responsible Trader Lessons 
Charts courtesy of Amibroker Charting Software 
C
The Responsible Trader Lessons 
Volume also plays an important role in the formation and resolution of price patterns. Each of the price patterns 
discussed previously has its own volume pattern. As a rule, volume tends to diminish as price patterns form. The 
subsequent breakout that resolves the pattern takes on added significance if the price break-out is accompanied 
by heavier volume. Heavier volume accompanying the breaking of trendlines and support or resistance levels 
lends greater weight to price activity. 
The Responsible Trader Lessons 
Chart courtesy of Amibroker Charting Software
The Responsible Trader Lessons 
The first indicator used to measure Volume is On Balance Volume or OBV. 
Because of limitations of the OBV, another indicator, Chaikin, is used. 
The Responsible Trader Lessons 
Chart courtesy of Amibroker Charting Software
The Responsible Trader Lessons 
A Gap is break between prices on a chart that occurs when the price of a stock makes a sharp move up or down 
with no trading occurring in between. Gaps can be created by factors such as regular buying or selling pressure, 
earnings announcements, a change in an analyst's outlook or any other type of news release. 
There are 3 types: Breakaway, Runaway and Exhaustion. 
The Responsible Trader Lessons 
Chart courtesy of Amibroker Charting Software
The Responsible Trader Lessons 
Reversal Days also called blowoffs and selling climaxes are dramatic market actions. The two 
terms are opposites. Blowoffs happen at market tops, and selling climaxes occur at bottoms. 
The Responsible Trader Lessons 
Chart courtesy of Amibroker Charting Software
The Responsible Trader Lessons 
1. Volume is an extremely useful tool and, as we have seen, there are many ways to use it. 
2. There are basic guidelines that can be used to assess market strength or weakness, as well as 
to check if volume is confirming a price move or signaling a reversal. Indicators can be used to 
help in the decision process. In short, volume is a not a precise entry and exit tool, however, 
with the help of indicators, entry and exit signals can be created by looking at price action, 
volume and a volume indicator. 
3. Volume should increase in the direction of the current trend, for it to be sustained. 
4. Volume often precedes price, so a reducing volume in an uptrend may precede a reversal. 
5. Divergences between volume indicators and the price chart suggest trouble. 
The Responsible Trader Lessons 
SUMMARY
The Responsible Trader Lessons 
Do you want to know more about my Advocacy, Responsible Trading? 
Please visit, like and share: 
My Blog:http://www.theresponsibletrader.com– where I write and share lessons on trading and my 
thoughts about trading in particular and life in general 
My Facebook Page: https://www.facebook.com/theresponsibletrader – where I share what’s on my 
mind and make posts to groups where I am a member of 
My YouTube Channel: https://www.youtube.com/theresponsibletrader – where you can view and 
download my TRT-POV (The Responsible Trader’s Point of View) and other videos I intend to make 
My Slideshare: http://www.slideshare.net/TheResponsibleTrader – where you can view and 
download copy of the Powerpoint Presentation of my TRT-POV (The Responsible Trader’s Point of 
View) and other presentations I intend to make

More Related Content

PPTX
Module 8 - Further Charting
PPTX
Trt pov module 12 building a trading system
PPTX
Module 4 - Reversal and Continuation Patterns
PPTX
Module 2 - Charting Basics
PDF
Rsi pro forex trading system cash back forex rebaitess ( pdf drive ) (2)
PPSX
Successful Currency Trading Basics
PPTX
Technical analysis vmt
PDF
Profit from trapped traders with 2 simple setups
Module 8 - Further Charting
Trt pov module 12 building a trading system
Module 4 - Reversal and Continuation Patterns
Module 2 - Charting Basics
Rsi pro forex trading system cash back forex rebaitess ( pdf drive ) (2)
Successful Currency Trading Basics
Technical analysis vmt
Profit from trapped traders with 2 simple setups

What's hot (20)

PDF
My Personal Forex Trading Plan
PDF
What are Key Chart Levels and How to Trade Them
PDF
Profit From Pullback Trading
PPTX
Star ticker
PDF
Trading plan
PPTX
Forex trading strategy
PDF
mastering-candlestick-charts-part-i
PDF
Ai1 october 30 17
PDF
The Most Profitable Forex and Stock Chart Patterns
PDF
How to Become a Professional Trader
PDF
The 3 duck's trading system.
PDF
Situations When you Shouldn't Trade Forex
DOCX
Stock trading
PPTX
May 20 I Session 1 I GBIH
PPTX
Lesson 1 - Introduction Philosophy
PPTX
Lesson 4 - Momentum
PDF
PPT
Doji Candlestick Trading
PDF
Why FOMO can obliterate your trading profits
My Personal Forex Trading Plan
What are Key Chart Levels and How to Trade Them
Profit From Pullback Trading
Star ticker
Trading plan
Forex trading strategy
mastering-candlestick-charts-part-i
Ai1 october 30 17
The Most Profitable Forex and Stock Chart Patterns
How to Become a Professional Trader
The 3 duck's trading system.
Situations When you Shouldn't Trade Forex
Stock trading
May 20 I Session 1 I GBIH
Lesson 1 - Introduction Philosophy
Lesson 4 - Momentum
Doji Candlestick Trading
Why FOMO can obliterate your trading profits
Ad

Similar to Module 5 - Volume and Open Interest (20)

PDF
Trading Volume Explained by CIFDAQ- Secret Of Market Trends
PDF
Week 5 what are good trading shares chart indicators volume the price vol...
PPT
Bhavishya- Technical Analysis
PPTX
Module 9 - Elliott Waves and Cycles of Time
PDF
Section 2 - Chapter 10 - Volume Analysis.pdf
PDF
Cmt learning objective 7 volume ,open interest & breadth Part-3
PDF
Cmt learning objective 7 volume ,open interest & breadth Part 2
PDF
Cmt learning objective 7 volume ,open interest & breadth Part-3
PDF
Cmt learning objective 7 volume ,open interest & breadth Part 1
PPT
Technical Analysis
PPTX
Basic Technical Analysis
PPTX
Volume Indicators for Trading Bitcoin
PDF
Identifying Good Volume Breakouts
PPTX
Section 3 - Chapter 5 - Volume , Open Interest & Price
PDF
Technical Analysis of the Stock market- Traders Mantra
PPTX
PDF
Master the market.pdf
PDF
mtm_251058.pdf
PDF
TAI LIEU NGHIEN CUU VSA
PPTX
Technically speaking
Trading Volume Explained by CIFDAQ- Secret Of Market Trends
Week 5 what are good trading shares chart indicators volume the price vol...
Bhavishya- Technical Analysis
Module 9 - Elliott Waves and Cycles of Time
Section 2 - Chapter 10 - Volume Analysis.pdf
Cmt learning objective 7 volume ,open interest & breadth Part-3
Cmt learning objective 7 volume ,open interest & breadth Part 2
Cmt learning objective 7 volume ,open interest & breadth Part-3
Cmt learning objective 7 volume ,open interest & breadth Part 1
Technical Analysis
Basic Technical Analysis
Volume Indicators for Trading Bitcoin
Identifying Good Volume Breakouts
Section 3 - Chapter 5 - Volume , Open Interest & Price
Technical Analysis of the Stock market- Traders Mantra
Master the market.pdf
mtm_251058.pdf
TAI LIEU NGHIEN CUU VSA
Technically speaking
Ad

Recently uploaded (20)

PPTX
master seminar digital applications in india
PPTX
Cell Structure & Organelles in detailed.
PDF
Module 4: Burden of Disease Tutorial Slides S2 2025
PPTX
Pharma ospi slides which help in ospi learning
PDF
Microbial disease of the cardiovascular and lymphatic systems
PDF
Computing-Curriculum for Schools in Ghana
PDF
ANTIBIOTICS.pptx.pdf………………… xxxxxxxxxxxxx
PDF
grade 11-chemistry_fetena_net_5883.pdf teacher guide for all student
PDF
STATICS OF THE RIGID BODIES Hibbelers.pdf
PDF
RMMM.pdf make it easy to upload and study
PDF
Chapter 2 Heredity, Prenatal Development, and Birth.pdf
PDF
VCE English Exam - Section C Student Revision Booklet
PPTX
Pharmacology of Heart Failure /Pharmacotherapy of CHF
PDF
2.FourierTransform-ShortQuestionswithAnswers.pdf
PDF
O7-L3 Supply Chain Operations - ICLT Program
PDF
102 student loan defaulters named and shamed – Is someone you know on the list?
PPTX
Final Presentation General Medicine 03-08-2024.pptx
PDF
A GUIDE TO GENETICS FOR UNDERGRADUATE MEDICAL STUDENTS
PPTX
Cell Types and Its function , kingdom of life
PPTX
human mycosis Human fungal infections are called human mycosis..pptx
master seminar digital applications in india
Cell Structure & Organelles in detailed.
Module 4: Burden of Disease Tutorial Slides S2 2025
Pharma ospi slides which help in ospi learning
Microbial disease of the cardiovascular and lymphatic systems
Computing-Curriculum for Schools in Ghana
ANTIBIOTICS.pptx.pdf………………… xxxxxxxxxxxxx
grade 11-chemistry_fetena_net_5883.pdf teacher guide for all student
STATICS OF THE RIGID BODIES Hibbelers.pdf
RMMM.pdf make it easy to upload and study
Chapter 2 Heredity, Prenatal Development, and Birth.pdf
VCE English Exam - Section C Student Revision Booklet
Pharmacology of Heart Failure /Pharmacotherapy of CHF
2.FourierTransform-ShortQuestionswithAnswers.pdf
O7-L3 Supply Chain Operations - ICLT Program
102 student loan defaulters named and shamed – Is someone you know on the list?
Final Presentation General Medicine 03-08-2024.pptx
A GUIDE TO GENETICS FOR UNDERGRADUATE MEDICAL STUDENTS
Cell Types and Its function , kingdom of life
human mycosis Human fungal infections are called human mycosis..pptx

Module 5 - Volume and Open Interest

  • 1. The Responsible Trader Lessons The Responsible Trader’s - POV The Responsible Trader Lessons Module 5 – Volume and Open Interest
  • 2. The Responsible Trader Lessons The Responsible Trader’s - POV • The Responsible Trader's POV (Point of View). • These are my notes, my own additional research and studies on the Topic that I posted, and my personal observations and opinions that I am sharing to further enhance our knowledge and understanding. • Some of these were previously posted on “The Responsible Trader” thread, Stock Market Pilipinas (www.stockmarketpilipinas.com). This is the latest version of previous posts I made. • Some of these plus further explanations and discussions will be appearing in my forthcoming book “The Responsible Trader.” The Responsible Trader Lessons
  • 3. The Responsible Trader Lessons Quick Review – In Economics 101, what do you call the Blue Line and the Orange Line? RED FOR RESISTANCE GREEN FOR SUPPORT The Responsible Trader Lessons
  • 4. The Responsible Trader Lessons Quick Review – In Economics 101, what do you call the Blue Line and the Orange Line? RED FOR RESISTANCE GREEN FOR SUPPORT Blue – Demand Line Orange – Supply Line The Responsible Trader Lessons
  • 5. The Responsible Trader Lessons The Responsible Trader Lessons Quick Review: When Bears Attack what are the probable Bulls Defenses?
  • 6. The Responsible Trader Lessons Support against the downtrend NEUTRAL Just maintain a certain price level The Responsible Trader Lessons Bears Attack and Bulls Defenses ACTIVE PASSIVE Keeping with the downtrend
  • 7. The Responsible Trader Lessons Let us now go to Module 5 – Volume and Open Interest Open Interest applies to Futures and Options only. I will limit our discussion to Volume so as not to complicate matters. Technical Analysis is based on two factors. These are Price and Volume. Our discussions so far have been about price movements, although we have acknowledged the importance of volume in confirming or denying what prices seem to be telling us. Price is certainly the most important. Volume is used primarily to confirm what the price is indicating. Of all the data in Technical Analysis, Volume is most often overlooked and taken for granted. The Responsible Trader Lessons
  • 8. The Responsible Trader Lessons Volume is simply the number of shares traded over a given period of time. On some charting softwares, Volume is already integrated on the chart. On some trading platforms, it could be presented separately. Chart with Volume Integrated Chart with Volume Presented Separately The Responsible Trader Lessons Charts courtesy of Amibroker Charting Software C
  • 9. The Responsible Trader Lessons Use of Volume in Determining Trend and Role of Volume during Formation of Patterns. Volume when properly understood and applied is one of the best ways of determining direction of the trend. Usually, volume increases in the direction of the trend. Volume also plays an important role in the formation and resolution of price patterns. Each of the price patterns discussed previously has its own volume pattern. As a rule, volume tends to diminish as price patterns form. The subsequent breakout that resolves the pattern takes on added significance if the price break-out is accompanied by heavier volume. Heavier volume accompanying the breaking of trendlines and support or resistance levels lends greater weight to price activity. The Responsible Trader Lessons
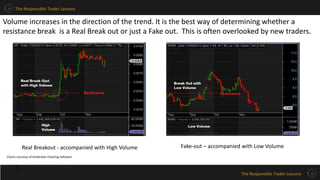
  • 10. The Responsible Trader Lessons Volume increases in the direction of the trend. It is the best way of determining whether a resistance break is a Real Break out or just a Fake out. This is often overlooked by new traders. Real Breakout - accompanied with High Volume Fake-out – accompanied with Low Volume The Responsible Trader Lessons Charts courtesy of Amibroker Charting Software C
  • 11. The Responsible Trader Lessons Volume also plays an important role in the formation and resolution of price patterns. Each of the price patterns discussed previously has its own volume pattern. As a rule, volume tends to diminish as price patterns form. The subsequent breakout that resolves the pattern takes on added significance if the price break-out is accompanied by heavier volume. Heavier volume accompanying the breaking of trendlines and support or resistance levels lends greater weight to price activity. The Responsible Trader Lessons Chart courtesy of Amibroker Charting Software
  • 12. The Responsible Trader Lessons The first indicator used to measure Volume is On Balance Volume or OBV. Because of limitations of the OBV, another indicator, Chaikin, is used. The Responsible Trader Lessons Chart courtesy of Amibroker Charting Software
  • 13. The Responsible Trader Lessons A Gap is break between prices on a chart that occurs when the price of a stock makes a sharp move up or down with no trading occurring in between. Gaps can be created by factors such as regular buying or selling pressure, earnings announcements, a change in an analyst's outlook or any other type of news release. There are 3 types: Breakaway, Runaway and Exhaustion. The Responsible Trader Lessons Chart courtesy of Amibroker Charting Software
  • 14. The Responsible Trader Lessons Reversal Days also called blowoffs and selling climaxes are dramatic market actions. The two terms are opposites. Blowoffs happen at market tops, and selling climaxes occur at bottoms. The Responsible Trader Lessons Chart courtesy of Amibroker Charting Software
  • 15. The Responsible Trader Lessons 1. Volume is an extremely useful tool and, as we have seen, there are many ways to use it. 2. There are basic guidelines that can be used to assess market strength or weakness, as well as to check if volume is confirming a price move or signaling a reversal. Indicators can be used to help in the decision process. In short, volume is a not a precise entry and exit tool, however, with the help of indicators, entry and exit signals can be created by looking at price action, volume and a volume indicator. 3. Volume should increase in the direction of the current trend, for it to be sustained. 4. Volume often precedes price, so a reducing volume in an uptrend may precede a reversal. 5. Divergences between volume indicators and the price chart suggest trouble. The Responsible Trader Lessons SUMMARY
  • 16. The Responsible Trader Lessons The Responsible Trader Lessons Do you want to know more about my Advocacy, Responsible Trading? Please visit, like and share: My Blog:http://www.theresponsibletrader.com– where I write and share lessons on trading and my thoughts about trading in particular and life in general My Facebook Page: https://www.facebook.com/theresponsibletrader – where I share what’s on my mind and make posts to groups where I am a member of My YouTube Channel: https://www.youtube.com/theresponsibletrader – where you can view and download my TRT-POV (The Responsible Trader’s Point of View) and other videos I intend to make My Slideshare: http://www.slideshare.net/TheResponsibleTrader – where you can view and download copy of the Powerpoint Presentation of my TRT-POV (The Responsible Trader’s Point of View) and other presentations I intend to make