SlideShare a Scribd company logo
Monitoring Microsoft SQL Server 2008 with Opsview


Tuesday, 07 August 2012   © Opsview Ltd. Commercial in Confidence   2
Introduction
• This blog post takes a deep-dive into monitoring
  Microsoft SQL Server 2008 with Opsview V4. In order to
  monitor MS SQL 2008 (known hereon as SQL2K8), we will
  have to leverage Opsview’s ability to support Nagios
  plugins which can be found on the Exchange.Nagios.org
  website.

• If you don’t already have Opsview installed, visit our
  website and download Opsview Core (free), Opsview
  Pro (30 day trial) or request a trial to Opsview
  Enterprise.

                                                                    3
Tuesday, 07 August 2012   © Opsview Ltd. Commercial in Confidence
Initial Setup
• First we will need to monitor a few services. To do this
  we can use the Opsview guide “Monitoring Windows
  Services”.
• The main 3 SQL services we may wish to monitor are:
• MSSQLSERVER – “SQL Service server”
• SQLSERVERAGENT – “SQL Server agent”
• SQLBrowser – “SQL Server Browser”


                                                                    4
Tuesday, 07 August 2012   © Opsview Ltd. Commercial in Confidence
Configuration
• Firstly login to Opsview and navigate to “SETTINGS >
  SERVICE CHECKS” and scroll down to “Database - MS SQL
  Server” where we can find a few pre-configured checks.
• We will need to modify these checks to include the
  correct service names (as above). For example, the
  service check for “MS SQL Server Service” should have
  arguments of:

“ -H $HOSTADDRESS$ -c nsc_checkservicestate -a 'ShowAll
MSSQLSERVER=started' ”


                                                                    5
Tuesday, 07 August 2012   © Opsview Ltd. Commercial in Confidence
Configuration
• Once these services have been created, we
  should have the following:
   Name                     Arguments
   MS SQL Agent Service     check_nrpe -H $HOSTADDRESS$ -c
                            nsc_checkservicestate -a 'ShowAll
                            SQLSERVERAGENT=started'

   MS SQL Browser           check_nrpe -H $HOSTADDRESS$ -c
                            nsc_checkservicestate -a 'ShowAll
                            SQLBrowser=started'

   MS SQL Server Listener   check_tcp -H $HOSTADDRESS$ -p 1433 -w 2 -c 5

   MS SQL Server Service    check_nrpe -H $HOSTADDRESS$ -c
                            nsc_checkservicestate -a 'ShowAll
                            MSSQLSERVER=started'


                                                                           6
Tuesday, 07 August 2012     © Opsview Ltd. Commercial in Confidence
Configuration
• Now we have the basic checks, lets add more “in-depth”
  monitoring.
• In order to do this, we are going to need a plugin from
  the Nagios Exchange called “Check MSSQL Database
  Stats”, from the link here.
• Download the .py script, and copy it to the folder
  /usr/local/nagios/libexec.
• Once there, do:
“chown nagios:nagios check_mssql_database.py”,


• then
                                                                    7
Tuesday, 07 August 2012   © Opsview Ltd. Commercial in Confidence
Configuration
“chmod 755 check_mssql_database.py”.


• This will now show up in our service checks as a plugin.
• In order to run the plugin on the platform, we will need
  to install a small plugin called “pymssql”. To do this,
  follow the instructions below:

UBUNTU/DEBIAN: sudo apt-get install python-pymssql RHEL:            yum
install pymssql (Some repos have it python-pymssql)


Once this plugin is installed, we can run a check on our MS
SQL server to make sure we can access it. To do this, run a
command similar to the one below, but with your
information added:
                                                                          8
Tuesday, 07 August 2012   © Opsview Ltd. Commercial in Confidence
Configuration
./check_mssql_database.py -H ipaddress -U username -P password -T
_Total -p 1433


• This command works as follows:
• “-H” is the ip address or hostname of the server on which
  the MS SQL Server 2008 install resides. Important: the
  username and password (-U and –P respectively) are
  the”SQL SERVER AUTHENTICATION” login details, and
  not the “Windows authentication” login details.


                                                                    9
Tuesday, 07 August 2012   © Opsview Ltd. Commercial in Confidence
Configuration
• Generally, the admin username will be “sa” for example.
  –T specifies the table name; with the operator “_Total”
  telling the query to look at all tables, and finally, -p
  specifies the port number – generally 1433.


                                                                    10
Tuesday, 07 August 2012   © Opsview Ltd. Commercial in Confidence
Configuration
• If the command works, you should see the following
  output:

OK:Time to connect is 0.004s|Time_to_connect=0.004s;;;;


• If not, you may need to review the login details, if you
  see something similar to the following:

CRITICAL:Unable to access SQL Server.


• As mentioned, the above output was obtained by using
  the AD credentials and not the SQL server credentials to
  try and access the box.
                                                                    11
Tuesday, 07 August 2012   © Opsview Ltd. Commercial in Confidence
Configuration
• Once we have the “OK..” message, we can begin to query
  the SQL server from within Opsview. So now we can login
  to Opsview again (if closed), and begin to create our
  service checks.
• To do this, go to “SETTINGS > SERVICE CHECKS” and click
  the plus sign in the top left corner.
• In this example, we are going to monitor the size of the
  database. To do this, use the plugin we just installed, and
  add the arguments, similar to those ran earlier, but with
  the “-H $HOSTADDRESS$” variable, and the
  %DATABASE% attribute, for scalability. We'll explain these
  later on in the guide.
                                                                    12
Tuesday, 07 August 2012   © Opsview Ltd. Commercial in Confidence
Configuration


• With the full arguments field reading:

-H $HOSTADDRESS$ -U sa -P password11! -T %DATABASE% -p 1433 -
-datasize -w 70000 -c 99000

                                                                    13
Tuesday, 07 August 2012   © Opsview Ltd. Commercial in Confidence
Configuration
• The key differentiator from hereon are the options after
  “-p 1433..”. We are specifying here we want to monitor “-
  -datasize” (so size of DB), and that we want to be warned
  if we go above 70000KB, (yellow alert in Opsview) and
  critical alert on 99000KB or more (Red in Opsview). For
  the full list of operators, see the bottom of this guide.
• Now we have created our service check (we can do the
  above for all the operators, where applicable), we now
  need to add them to our MS SQL host. But before we can
  do that, we need to add the attribute “%DATABASE%”
  first.
• To do this, go to “SETTINGS > Attributes” and click the
  plus sign

                                                                    14
Tuesday, 07 August 2012   © Opsview Ltd. Commercial in Confidence
Configuration
• In the “Name” box, enter “DATABASE”, and click “submit
  changes”, it is that simple!


• Next, we must create this host via “SETTINGS > HOST”
  and click the “plus” sign at the top left.
• Populate all the fields appropriately, using the IP address
  of the server on which the SQL DB is running on.
                                                                    15
Tuesday, 07 August 2012   © Opsview Ltd. Commercial in Confidence
Configuration
• Once done, click onto the “MONITORS” tab. Here is
  where we will assign our new service checks to our host,
  as below:


                                                                    16
Tuesday, 07 August 2012   © Opsview Ltd. Commercial in Confidence
Configuration
• Once we have added our monitors, click “ATTRIBUTES”,
  and select in the dropdown box our new attribute,
  “DATABASE”.
• In the value field, enter the name of your database - or if
  you want to monitor all, we can use the “_Total”
  operator.
• Finally, click submit, and now have our SQL Server 2008
  host created, with the attribute specified, and all our
  new service checks enabled.


                                                                    17
Tuesday, 07 August 2012   © Opsview Ltd. Commercial in Confidence
Configuration
• Now this is done, we just need to reload opsview due to
  the configuration changes using “SETTINGS -> APPLY
  CHANGES”


• And Opsview will reload, your new host will be available
  and will be monitoring your new service checks, as on
  the following slide (with a lot more service checks):

                                                                    18
Tuesday, 07 August 2012   © Opsview Ltd. Commercial in Confidence
Configuration


                                                                    19
Tuesday, 07 August 2012   © Opsview Ltd. Commercial in Confidence
Reference:
• On the following slide are the options which can be
  applied to the command, as per the output of the
  command ./check_mssql_database.py -h I have also
  added a “arguments” section.


                                                                    20
Tuesday, 07 August 2012   © Opsview Ltd. Commercial in Confidence
Reference
 Option                   Arguments                                             Notes
 --activetrans            -H $HOSTADDRESS$ -U sa -P password11!                Monitors # of active transactions,
                          -T %DATABASE% -p 1433 --activetrans -w                warns on over 5, and critical on
                          5 -c 10                                               over 10 transactions.
 --datasize               -H $HOSTADDRESS$ -U sa -P password11!                Monitors size of database, warns
                          -T %DATABASE% -p 1433 --datasize -w                   on over 70000kb, critical on
                          70000 -c 99000
                                                                                99000Kb
 --logcachehit            -H $HOSTADDRESS$ -U sa -P password11!                Monitors log cache hit in %. Less
                          -T %DATABASE% -p 1433 --logcachehit -w                than 50% gives us critical, less
                          75: -c 50:
                                                                                than 75% gives warning.
 --logwait                H $HOSTADDRESS$ -U sa -P password11! -               In .ms, how long it takes to
                          T %DATABASE% -p 1433 --logwait -w 30 -c               retrieve logs.
                          50

 --loggrowths             -H $HOSTADDRESS$ -U sa -P password11!                Check Log Growths
                          -T %DATABASE% -p 1433 --loggrowths -w 5
                          -c 10

 --time2connect           -H $HOSTADDRESS$ -U sa -P password11!                Time in .ms to connect to DB.
                          -T %DATABASE% -p 1433 --time2connect -w
                          0010 -c 0050

 --transpsec              -H $HOSTADDRESS$ -U sa -P
                          password11! -T %DATABASE% -p
                          1433 --transpsec -w 20 -c 30

                                                                                                                     21
Tuesday, 07 August 2012               © Opsview Ltd. Commercial in Confidence
About Opsview
Opsview delivers a single unified view of the health of all your distributed physical,
virtual and hybrid cloud systems.

We give DevOps staff all the tools they need to get their jobs done faster, easier and
for less.

•    Opsview Enterprise offers large enterprises (+100 devices) and MSPs a certified,
     professionally supported system with enhanced functionality such as dynamic
     dashboards and reports

•    SMEs looking for feature-rich dashboards to monitor the performance of their on-
     premise, virtualized or cloud apps choose Opsview Pro

•    Opsview Core is our free, open source monitoring tool - you can test and
     customize it how you want

www.opsview.com
                                                                                         22
Tuesday, 07 August 2012       © Opsview Ltd. Commercial in Confidence

More Related Content

PDF
MySQL Best Practices - OTN
PDF
MySQL8.0.22リリースノートをみてわいわい言う勉強会
PDF
Monitoring your technology stack with New Relic
PDF
MySQL Scalability Mistakes - OTN
PDF
MySQL Best Practices - OTN LAD Tour
PPT
Application_Performance_V1
PPT
Application_Performance_V1
PPT
Vs2010and Ne Tframework
MySQL Best Practices - OTN
MySQL8.0.22リリースノートをみてわいわい言う勉強会
Monitoring your technology stack with New Relic
MySQL Scalability Mistakes - OTN
MySQL Best Practices - OTN LAD Tour
Application_Performance_V1
Vs2010and Ne Tframework

Similar to Monitoring Microsoft SQL Server 2008 with Opsview (20)

PPTX
Monitoring Oracle Databases with Opsview
PDF
ITS Forefront Management Server Infrastructure Build
PDF
OSMC 2010 | NSClient++ - what's new? And what's coming! by Michael Medin
PPTX
Sql server 2012 dba online training
PPTX
MSSQL SERVER
PPTX
Geek Sync | Taking Control of Your Organization’s SQL Server Sprawl
PPTX
End to End Monitoring using Nested Keywords
PPTX
Kåre Rude Andersen - Be a hero – optimize scom and present your services
PDF
SQLSaturday#290_Kiev_AdHocMaintenancePlansForBeginners
DOCX
Trainmesfottech - Sql Server DBA Training Course Content
PDF
New Server in an Hour #sqlsat121
PPT
Leveraging Open Source to Manage SAN Performance
PPT
MySQL Features & Implementation
PDF
MySQL Enterprise Monitor
PPTX
Sql server 2012 dba online training
PDF
Back2 Basic Tools
PDF
Back 2 basics - SSMS Tips (IDf)
PDF
Sql Server Security Best Practices
PDF
7 steps to effective SQL Server monitoring
PDF
Financial, Retail And Shopping Domains
Monitoring Oracle Databases with Opsview
ITS Forefront Management Server Infrastructure Build
OSMC 2010 | NSClient++ - what's new? And what's coming! by Michael Medin
Sql server 2012 dba online training
MSSQL SERVER
Geek Sync | Taking Control of Your Organization’s SQL Server Sprawl
End to End Monitoring using Nested Keywords
Kåre Rude Andersen - Be a hero – optimize scom and present your services
SQLSaturday#290_Kiev_AdHocMaintenancePlansForBeginners
Trainmesfottech - Sql Server DBA Training Course Content
New Server in an Hour #sqlsat121
Leveraging Open Source to Manage SAN Performance
MySQL Features & Implementation
MySQL Enterprise Monitor
Sql server 2012 dba online training
Back2 Basic Tools
Back 2 basics - SSMS Tips (IDf)
Sql Server Security Best Practices
7 steps to effective SQL Server monitoring
Financial, Retail And Shopping Domains
Ad

More from Opsview (6)

PDF
Infographic: Managing Network Technologies and Network Monitoring
PDF
Infographic: Opsview Cloud, Virtualization & IaaS Survey
PPTX
Opsview Network Monitoring Survey
PDF
Monitoring Server Temperature with Opsview
PPTX
Advanced reporting with Opsview
PPTX
Creating Custom Notifications in Opsview
Infographic: Managing Network Technologies and Network Monitoring
Infographic: Opsview Cloud, Virtualization & IaaS Survey
Opsview Network Monitoring Survey
Monitoring Server Temperature with Opsview
Advanced reporting with Opsview
Creating Custom Notifications in Opsview
Ad

Recently uploaded (20)

PDF
Advanced methodologies resolving dimensionality complications for autism neur...
PDF
Encapsulation theory and applications.pdf
PDF
Agricultural_Statistics_at_a_Glance_2022_0.pdf
DOCX
The AUB Centre for AI in Media Proposal.docx
PDF
Blue Purple Modern Animated Computer Science Presentation.pdf.pdf
PPTX
Digital-Transformation-Roadmap-for-Companies.pptx
PDF
NewMind AI Weekly Chronicles - August'25-Week II
PPTX
Machine Learning_overview_presentation.pptx
PPTX
A Presentation on Artificial Intelligence
PDF
Architecting across the Boundaries of two Complex Domains - Healthcare & Tech...
PDF
cuic standard and advanced reporting.pdf
PDF
Building Integrated photovoltaic BIPV_UPV.pdf
PPTX
VMware vSphere Foundation How to Sell Presentation-Ver1.4-2-14-2024.pptx
PDF
Network Security Unit 5.pdf for BCA BBA.
PDF
7 ChatGPT Prompts to Help You Define Your Ideal Customer Profile.pdf
PPTX
20250228 LYD VKU AI Blended-Learning.pptx
PDF
Assigned Numbers - 2025 - Bluetooth® Document
PPTX
KOM of Painting work and Equipment Insulation REV00 update 25-dec.pptx
PDF
Optimiser vos workloads AI/ML sur Amazon EC2 et AWS Graviton
PPTX
ACSFv1EN-58255 AWS Academy Cloud Security Foundations.pptx
Advanced methodologies resolving dimensionality complications for autism neur...
Encapsulation theory and applications.pdf
Agricultural_Statistics_at_a_Glance_2022_0.pdf
The AUB Centre for AI in Media Proposal.docx
Blue Purple Modern Animated Computer Science Presentation.pdf.pdf
Digital-Transformation-Roadmap-for-Companies.pptx
NewMind AI Weekly Chronicles - August'25-Week II
Machine Learning_overview_presentation.pptx
A Presentation on Artificial Intelligence
Architecting across the Boundaries of two Complex Domains - Healthcare & Tech...
cuic standard and advanced reporting.pdf
Building Integrated photovoltaic BIPV_UPV.pdf
VMware vSphere Foundation How to Sell Presentation-Ver1.4-2-14-2024.pptx
Network Security Unit 5.pdf for BCA BBA.
7 ChatGPT Prompts to Help You Define Your Ideal Customer Profile.pdf
20250228 LYD VKU AI Blended-Learning.pptx
Assigned Numbers - 2025 - Bluetooth® Document
KOM of Painting work and Equipment Insulation REV00 update 25-dec.pptx
Optimiser vos workloads AI/ML sur Amazon EC2 et AWS Graviton
ACSFv1EN-58255 AWS Academy Cloud Security Foundations.pptx

Monitoring Microsoft SQL Server 2008 with Opsview

  • 2. Monitoring Microsoft SQL Server 2008 with Opsview Tuesday, 07 August 2012 © Opsview Ltd. Commercial in Confidence 2
  • 3. Introduction • This blog post takes a deep-dive into monitoring Microsoft SQL Server 2008 with Opsview V4. In order to monitor MS SQL 2008 (known hereon as SQL2K8), we will have to leverage Opsview’s ability to support Nagios plugins which can be found on the Exchange.Nagios.org website. • If you don’t already have Opsview installed, visit our website and download Opsview Core (free), Opsview Pro (30 day trial) or request a trial to Opsview Enterprise. 3 Tuesday, 07 August 2012 © Opsview Ltd. Commercial in Confidence
  • 4. Initial Setup • First we will need to monitor a few services. To do this we can use the Opsview guide “Monitoring Windows Services”. • The main 3 SQL services we may wish to monitor are: • MSSQLSERVER – “SQL Service server” • SQLSERVERAGENT – “SQL Server agent” • SQLBrowser – “SQL Server Browser” 4 Tuesday, 07 August 2012 © Opsview Ltd. Commercial in Confidence
  • 5. Configuration • Firstly login to Opsview and navigate to “SETTINGS > SERVICE CHECKS” and scroll down to “Database - MS SQL Server” where we can find a few pre-configured checks. • We will need to modify these checks to include the correct service names (as above). For example, the service check for “MS SQL Server Service” should have arguments of: “ -H $HOSTADDRESS$ -c nsc_checkservicestate -a 'ShowAll MSSQLSERVER=started' ” 5 Tuesday, 07 August 2012 © Opsview Ltd. Commercial in Confidence
  • 6. Configuration • Once these services have been created, we should have the following: Name Arguments MS SQL Agent Service check_nrpe -H $HOSTADDRESS$ -c nsc_checkservicestate -a 'ShowAll SQLSERVERAGENT=started' MS SQL Browser check_nrpe -H $HOSTADDRESS$ -c nsc_checkservicestate -a 'ShowAll SQLBrowser=started' MS SQL Server Listener check_tcp -H $HOSTADDRESS$ -p 1433 -w 2 -c 5 MS SQL Server Service check_nrpe -H $HOSTADDRESS$ -c nsc_checkservicestate -a 'ShowAll MSSQLSERVER=started' 6 Tuesday, 07 August 2012 © Opsview Ltd. Commercial in Confidence
  • 7. Configuration • Now we have the basic checks, lets add more “in-depth” monitoring. • In order to do this, we are going to need a plugin from the Nagios Exchange called “Check MSSQL Database Stats”, from the link here. • Download the .py script, and copy it to the folder /usr/local/nagios/libexec. • Once there, do: “chown nagios:nagios check_mssql_database.py”, • then 7 Tuesday, 07 August 2012 © Opsview Ltd. Commercial in Confidence
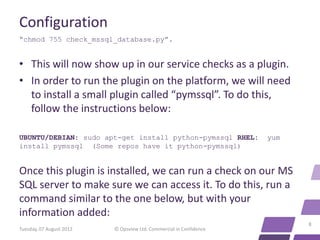
  • 8. Configuration “chmod 755 check_mssql_database.py”. • This will now show up in our service checks as a plugin. • In order to run the plugin on the platform, we will need to install a small plugin called “pymssql”. To do this, follow the instructions below: UBUNTU/DEBIAN: sudo apt-get install python-pymssql RHEL: yum install pymssql (Some repos have it python-pymssql) Once this plugin is installed, we can run a check on our MS SQL server to make sure we can access it. To do this, run a command similar to the one below, but with your information added: 8 Tuesday, 07 August 2012 © Opsview Ltd. Commercial in Confidence
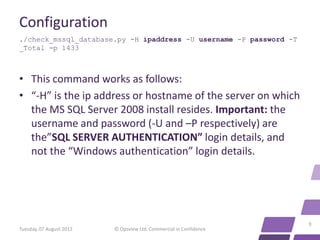
  • 9. Configuration ./check_mssql_database.py -H ipaddress -U username -P password -T _Total -p 1433 • This command works as follows: • “-H” is the ip address or hostname of the server on which the MS SQL Server 2008 install resides. Important: the username and password (-U and –P respectively) are the”SQL SERVER AUTHENTICATION” login details, and not the “Windows authentication” login details. 9 Tuesday, 07 August 2012 © Opsview Ltd. Commercial in Confidence
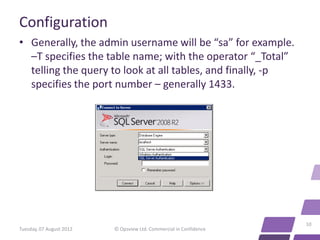
  • 10. Configuration • Generally, the admin username will be “sa” for example. –T specifies the table name; with the operator “_Total” telling the query to look at all tables, and finally, -p specifies the port number – generally 1433. 10 Tuesday, 07 August 2012 © Opsview Ltd. Commercial in Confidence
  • 11. Configuration • If the command works, you should see the following output: OK:Time to connect is 0.004s|Time_to_connect=0.004s;;;; • If not, you may need to review the login details, if you see something similar to the following: CRITICAL:Unable to access SQL Server. • As mentioned, the above output was obtained by using the AD credentials and not the SQL server credentials to try and access the box. 11 Tuesday, 07 August 2012 © Opsview Ltd. Commercial in Confidence
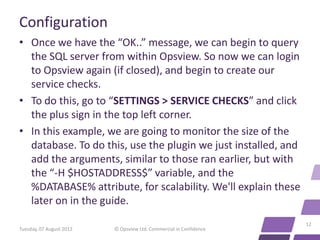
  • 12. Configuration • Once we have the “OK..” message, we can begin to query the SQL server from within Opsview. So now we can login to Opsview again (if closed), and begin to create our service checks. • To do this, go to “SETTINGS > SERVICE CHECKS” and click the plus sign in the top left corner. • In this example, we are going to monitor the size of the database. To do this, use the plugin we just installed, and add the arguments, similar to those ran earlier, but with the “-H $HOSTADDRESS$” variable, and the %DATABASE% attribute, for scalability. We'll explain these later on in the guide. 12 Tuesday, 07 August 2012 © Opsview Ltd. Commercial in Confidence
  • 13. Configuration • With the full arguments field reading: -H $HOSTADDRESS$ -U sa -P password11! -T %DATABASE% -p 1433 - -datasize -w 70000 -c 99000 13 Tuesday, 07 August 2012 © Opsview Ltd. Commercial in Confidence
  • 14. Configuration • The key differentiator from hereon are the options after “-p 1433..”. We are specifying here we want to monitor “- -datasize” (so size of DB), and that we want to be warned if we go above 70000KB, (yellow alert in Opsview) and critical alert on 99000KB or more (Red in Opsview). For the full list of operators, see the bottom of this guide. • Now we have created our service check (we can do the above for all the operators, where applicable), we now need to add them to our MS SQL host. But before we can do that, we need to add the attribute “%DATABASE%” first. • To do this, go to “SETTINGS > Attributes” and click the plus sign 14 Tuesday, 07 August 2012 © Opsview Ltd. Commercial in Confidence
  • 15. Configuration • In the “Name” box, enter “DATABASE”, and click “submit changes”, it is that simple! • Next, we must create this host via “SETTINGS > HOST” and click the “plus” sign at the top left. • Populate all the fields appropriately, using the IP address of the server on which the SQL DB is running on. 15 Tuesday, 07 August 2012 © Opsview Ltd. Commercial in Confidence
  • 16. Configuration • Once done, click onto the “MONITORS” tab. Here is where we will assign our new service checks to our host, as below: 16 Tuesday, 07 August 2012 © Opsview Ltd. Commercial in Confidence
  • 17. Configuration • Once we have added our monitors, click “ATTRIBUTES”, and select in the dropdown box our new attribute, “DATABASE”. • In the value field, enter the name of your database - or if you want to monitor all, we can use the “_Total” operator. • Finally, click submit, and now have our SQL Server 2008 host created, with the attribute specified, and all our new service checks enabled. 17 Tuesday, 07 August 2012 © Opsview Ltd. Commercial in Confidence
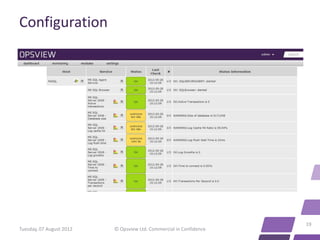
  • 18. Configuration • Now this is done, we just need to reload opsview due to the configuration changes using “SETTINGS -> APPLY CHANGES” • And Opsview will reload, your new host will be available and will be monitoring your new service checks, as on the following slide (with a lot more service checks): 18 Tuesday, 07 August 2012 © Opsview Ltd. Commercial in Confidence
  • 19. Configuration 19 Tuesday, 07 August 2012 © Opsview Ltd. Commercial in Confidence
  • 20. Reference: • On the following slide are the options which can be applied to the command, as per the output of the command ./check_mssql_database.py -h I have also added a “arguments” section. 20 Tuesday, 07 August 2012 © Opsview Ltd. Commercial in Confidence
  • 21. Reference Option Arguments Notes --activetrans -H $HOSTADDRESS$ -U sa -P password11! Monitors # of active transactions, -T %DATABASE% -p 1433 --activetrans -w warns on over 5, and critical on 5 -c 10 over 10 transactions. --datasize -H $HOSTADDRESS$ -U sa -P password11! Monitors size of database, warns -T %DATABASE% -p 1433 --datasize -w on over 70000kb, critical on 70000 -c 99000 99000Kb --logcachehit -H $HOSTADDRESS$ -U sa -P password11! Monitors log cache hit in %. Less -T %DATABASE% -p 1433 --logcachehit -w than 50% gives us critical, less 75: -c 50: than 75% gives warning. --logwait H $HOSTADDRESS$ -U sa -P password11! - In .ms, how long it takes to T %DATABASE% -p 1433 --logwait -w 30 -c retrieve logs. 50 --loggrowths -H $HOSTADDRESS$ -U sa -P password11! Check Log Growths -T %DATABASE% -p 1433 --loggrowths -w 5 -c 10 --time2connect -H $HOSTADDRESS$ -U sa -P password11! Time in .ms to connect to DB. -T %DATABASE% -p 1433 --time2connect -w 0010 -c 0050 --transpsec -H $HOSTADDRESS$ -U sa -P password11! -T %DATABASE% -p 1433 --transpsec -w 20 -c 30 21 Tuesday, 07 August 2012 © Opsview Ltd. Commercial in Confidence
  • 22. About Opsview Opsview delivers a single unified view of the health of all your distributed physical, virtual and hybrid cloud systems. We give DevOps staff all the tools they need to get their jobs done faster, easier and for less. • Opsview Enterprise offers large enterprises (+100 devices) and MSPs a certified, professionally supported system with enhanced functionality such as dynamic dashboards and reports • SMEs looking for feature-rich dashboards to monitor the performance of their on- premise, virtualized or cloud apps choose Opsview Pro • Opsview Core is our free, open source monitoring tool - you can test and customize it how you want www.opsview.com 22 Tuesday, 07 August 2012 © Opsview Ltd. Commercial in Confidence