


![Fundamental Relationships on
Efficiency:
Example: 100hp motor at 90% efficiency,
with perfect voltage condition.
a) What is the Input Power and the Output Power?
Efficiency = 100% - Losses[%]
Pout = 100hp
Pin = 100hp / 0.9 = 111hp
Efficiency = Output Power / Input Power
Ploss = 111hp – 100hp
Ploss = 11hp = rated losses
b) What are the losses?](https://image.slidesharecdn.com/mcsatsapart1-190108191355/85/Motor-Current-Signature-Analysis-R-K-Gupta-64-320.jpg)


Motor Current Signature Analysis R K Gupta
- 1. Predictive Maintenance of Induction Motors With MCSA & TSA Technology R K Gupta Principal Consulting Electrical Engineer (Power System) Reliability Engineer BE Electrical Protection, Automation, PLC & SCADA, Level 3 MCSA, Colorado USA
- 2. What is MCSA & TSA ? MCSA: stand for Motor Current Signature Analysis. The basis of MCSA is that the stator current contains current components which is directly linked to rotating magnetic flux components caused by electrical or mechanicals faults. These harmonics current components caused by fault can be used for early failure detection. TORQUE SIGNATURE: The acquisition of torque ripple and the analysis of the torque spectrum is a relatively new addition in the realm of condition based maintenance technology. By capturing the real components of the current and deriving the flux generated from voltage a signal equal to air gap torque is developed. Mechanical information buried in a complex modulated current signal can now be easily accessed and interpreted for electrical and mechanical conditions.
- 3. Amazing Fact World’s 30% - 40% produced electrical energy is consumed by electrical motors.
- 4. Dynamic Motor Testing A motor is only one part of a “Machine System” that includes: Power in, the Motor and the Load. Dynamic testing diagnoses issues for all three links.
- 5. Gives clarity to the Root Cause Analysis Power Quality, Motor, Load issues Helps to find Mechanical issues including: Bearing problems, Rotor Bar issues, Cavitation's and Eccentricities Electrical issues including: Oscillations, Transients and Harmonics (Distortion)
- 6. Benefits of Dynamic testing Helps separate Mechanical from Electrical issues Provides “early warning” information Provides “support” for other technologies Can be performed more often than static testing It is safe, fast and non-intrusive
- 7. Defining Dynamic Electric Motor Monitoring WHAT IS IT?: The ability to find Power Condition, Motor and Load Related issues while the motor is running under normal conditions. HOW?: We measure, analyze and trend the currents and voltages of the motor- load system (typically at the MCC).
- 8. Maintenance Program Types Corrective – Run to failure Preventative – Pre-planned periodic motor replacement or recondition regardless of condition, run time or history. Predictive – A complete program that includes static and dynamic motor testing, etc. All diagnosed and trended.
- 9. Cost Vs. Benefits Corrective $17 - $18 Per Hp Preventive $11 - $13 Per Hp Predictive $ 7 - $ 9 Per Hp 1983 EPRI Study of Maintenance Programs
- 10. Rotor 8% Bearing 44% Other 22% Stator 26% Bearing 41% Other 14% Rotor 9% Stator 36% Motor Failure Areas IEEE (early 1990’s) EPRI (Mid 1990’s)
- 11. What are we really after? Reduce unscheduled downtime by predicting imminent motor failures and identifying problem areas Determine root-cause of problem Ultimate goal: Save time & money
- 12. The Questions: Is the motor operating properly? Is the load operating properly? How is the motor reacting to the load? What is the condition of the power?
- 13. To Find the Answers: Observe voltages & currents supplying motor. Obtain motor speed. Obtain motor torque. Analyze data. Trend routinely.
- 14. How it Works ?
- 15. Motor MCC Load 1. frequency 2. speed 3. Torque4. Power 5. Voltage 6. Current Chain of Events
- 16. Here is how this thing works: The MCC tells the motor: ‘I am sending you 50Hz.’ Motor replies ‘Ok. Load, I would like to turn you at this speed ‘(1500rpm, say). Load says: ‘Ok, you want to do that, then give me this much torque’. Motor responds ‘Fine’. Turns around and says to the MCC: ‘I need this much power’ (remember, mechanical output power of the motor is speed times torque. Both of those parameters are set right now). MCC says ‘Well, I know that I am giving you this particular voltage here’. Then the motor says ‘All right, granted that you offer me this voltage, then give me this amount and type of current’. In short: If you find anything wrong with the torque, it m ust be caused by the load. If you find anything wrong with the voltage, it m ust be caused by the MCC. If you find anything wrong with the current, then it is the play of MCC, motor and load together. Action & Reaction
- 17. Note Torque related problems are caused by the load Power related problems come from “upstream” and effect the whole buss. If you find anything wrong with the current then it is the play of the MCC, motor and load together.
- 18. Motor MCC Load Breaker Safety First! NFPA 70 Yourcompany’s requirements Explorer Yourindustry’s requirements “Best Practices” Safety
- 21. Motor Load CTs Breaker Explorer PTs No physical connection to motor required. No transducers required to be installed on the motor Permanent installation available All values derived from voltage and current measurements only Connection for HV/HT Motors
- 22. Motor Load CTs Breaker PTs EP Explorer First Energy RC Pump 1 of 700+ EPs at Entergy Connection with EP
- 23. Speed – accuracy is critical
- 24. Accuracy of Speed Critical: Consider a 4 pole motor: Synchronous speed = 1800RPM Full Load Speed = 1780 RPM 1% Error in speed measurement = 18 RPM! Must be able to resolve shaft speed to the 1RPM level or better: 0.05% (0.05% = 1/1800*100%) Special signal processing techniques required: DFLL (Digital Frequency Locked Loop) – basically a form of correlation. FFT will not work due to very long observation times (60 seconds or more) to get enough frequency resolution to resolve 1 RPM.
- 25. Current Signature: FFT vs. DFLL Amplitude: 20dB Amplitude: 60dB Resolution: 0.13Hz Resolution: 0.005Hz FFT DFLL
- 26. FFT vs. DFLL
- 27. Determination of Motor Speed
- 28. Motor Speed Air gap changes as rotor rotates within the stator core because of excentricities, misalignments of rotor and stator, out of round rotors, etc. Current in stator changes (slightly) as a result of the changing gap distance. Change in current shows up as a peak in the current spectrum.
- 29. Torque Derivation Use “dq0” theory – also called two axis theory. Theory exists since 1929 R.H. Park, “Two-Reaction Theory of Synchronous Machines – Generalized Method of Analysis. Part 1”, AIEEE Transactions, Vol. 48, July 1929, pp. 717-717. Used in VFD’s since the 1980s E.C. Lee, “Review of Variable Speed Drive Technology”, www.powertecmotors.com/avsde4.pdf. T.A. Lipo, A.B. Plunkett, “A Novel Approach to Induction Motor Transfer Functions,” IEEE Transactions on Power Apparatus and Systems. Vol. PAS 93 pp. 1420-1419, 1979. A. B. Plunkett, “A Current Controlled PWN Transistor Inverter Drive,” IEEE/IAS 1979 Annual Meeting, pp 785-792. Well documented in motor control texts. P.C. Krause, O. Wasynczuk, S.D Sudhoff, “Analysis of Electric Machinery,” IEEE Press NY, ISBN 0-7803-1101-9, 1995.
- 30. Torque Shows What the Load is Doing Variations in torque indicates a problem with the smooth operation of the motor and or load. Intermittent load variations -> T(t) Repetitive load variations -> T(freq) To the right: Fan with a flapping belt causing excessive bearing wear on both motor and fan pillow blocks.
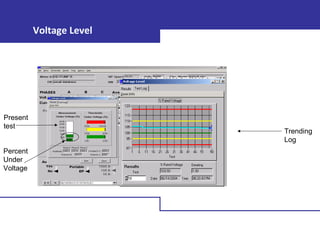
- 31. Power Quality Voltage level, voltage unbalance, harmonics distortion, total distortion, power, harmonics Machine Performance Payback period, effective service factor, load, operating condition, efficiency Current Current level, current unbalance Spectrum Rotor bar, V/I spectra, demodulated spectra Connections Waveforms, ABC/SYM components, phasors VFD details Torque and speed vs. time, frequency and voltage vs. time. Overall Check
- 32. Summary page – After each test
- 33. Power Quality Power level Voltage unbalance Harmonic distortion Total distortion Power Harmonics
- 35. Low Voltage High Voltage Over Currents (Over Heat) Low Power Factor Iron Saturation Ultimately Higher Losses Incoming Power - Voltage Issues
- 36. Over/Under Voltage Motors are designed to operate with +/- 10% of rated voltage Ideally, voltage supply deviation should be less than +/- 2% When operating over/under voltage a motors performance, efficiency, and power factor change
- 37. Over/Under Voltage Voltage deviations usually caused by Poorly performing or improperly adjusted transformers Undersized conductors Poor connections Low power factor sources in the distribution system
- 38. Acceptable System Voltage Ranges Nominal System Voltage Allowable Limits % Allowable Voltage Range 120V(L-N) +/- 5% 114V- 126V 240V(L-L) +/- 5% 228V- 252V 480V(L-L) +/- 5% 456V- 504V
- 39. Comparison of voltage level to average winding temp & motor efficiency* Voltage -10% (414V) Normal (460V) +10% (506V) HPFull Load Temp Eff Temp Eff Temp Eff 10 66 90.0 56 91.4 55 91.5 20 84 90.4 70 91.8 67 92.1 50 84 91.9 69 93.1 62 93.6 100 82 94.2 72 94.8 69 94.9 200 90 94.9 77 95.5 74 95.7
- 40. Over Voltage – Case study
- 41. 6.6kV 1000 hp Pump Motor at a Nuclear Power Plant Motor being overdriven. Operating at 7.7kV Plant engineering thought there should be no problem. Currents are below nameplate – so its ok, right? Wrong! Saturating the iron in the stator caused overheating Motor has burned up 3 times - $150,000 to repair. Thermal output of plant reduced to 50% during 3-4 weeks per repair. Lost $10,000,000 in electrical sales during each repair.
- 43. Voltage Unbalances When a voltage unbalance reaches 5 %, the phase currents can differ by as much as 40 %. Unbal = 100 Vmaxdev-V V Where: Unbalance = Voltage unbalance in % Vmaxdev = Line to line phase voltage deviating most from mean of 3 phases V = RMS voltage, mean line to line of 3 phases
- 44. Effects of Voltage Unbalance on Motor Losses
- 46. Voltage distortion: Torque Spectra NormalPeaksNormalPeaks 60Hz60Hz 120Hz120Hz 360Hz360Hz Harmful distortion Clear – no distortion
- 47. Voltage Distortion – Case study
- 48. Harmonics Can Damage Motors Shotton Paper (Flintshire, UK, Shaw Bowden, shaw.bowden@upm-kymmene.com) Large inverter fed motor on the same bus as a smaller induction motor. Harmonics from the VFD destroying smaller 660V, 550hp motor. Voltage THD = 11%, 9%, 8% (three phases) Voltage Imbalance = 3.6% NEMA de-rating = 60% Running at Effective Service Factor = 1.29 End result, motor running very hot. Time to get out the Baker Advanced Winding Analyzer to check for insulation damage.
- 49. Harmonics Can Damage Motors
- 51. Harmonics
- 52. Harmonics
- 53. Machine performance Effective Service Factor Load Operating Condition Efficiency Payback Period
- 54. Test station 300 hp 3570 rpm Eff. s.f. = % NEMA derating % Load
- 58. Temperature(C) FullLoad 1.15% 1.25% 49 64 77 56 75 91 75 102 128 64 80 94 69 89 106 Horsepower 10 20 50 100 200 * Courtesy U S Motors Motor Performance Percent Load vs Temperature
- 60. Operating Condition Goal: To compare machine’s operation with the past. Method: If past data exists at present torque & frequency level, then Is the voltage level similar to previous? Is the current level similar to previous? Is the phase angle similar to previous? Successes Flagged very early rotor bar deterioration Flagged high resistance connection on terminal box Issue Undiagnosed flags DO happen
- 61. Efficiency vs Load Level Percent Load Percent Efficiency
- 63. Money Savings/Efficiency Matters! Pin Pout =η Input Power Efficiency Output Power = Shaft Power Input Power = Electrical Power
- 64. Fundamental Relationships on Efficiency: Example: 100hp motor at 90% efficiency, with perfect voltage condition. a) What is the Input Power and the Output Power? Efficiency = 100% - Losses[%] Pout = 100hp Pin = 100hp / 0.9 = 111hp Efficiency = Output Power / Input Power Ploss = 111hp – 100hp Ploss = 11hp = rated losses b) What are the losses?
- 65. Fundamental Relationships on Efficiency: Example: 100hp motor at 90% efficiency, with 2% Voltage unbalance. c) What is the Input Power and the Output Power? Pout = 100hp Ploss = 11hp * 1.1 = 12.1hp Pin = Pout + Ploss = 112.1hp
- 67. Variability Study of Identical Motors Motor HP No. of Test Efficiency Max. Min. Ave. Average Losses Variation Losses (1) 200 10 96.6 96.0 96.3 5.722 +7.9% 75 6 93.9 92.8 93.2 4.06 +6.5% 40 7 91.0 90.0 90.6 3.085 +7.9% (1) MaximumPercent increase in Total Loss fromthe Average Loss
- 69. Payback Period At97.3%Load 95.6%Efficiency AnnualCostto operatethismotorat thisloadlevel $92,927.84
- 70. Current Over current Current unbalance
- 73. Current Issues Over Current Increased heat causing faster degradation in the insulation system Current Unbalance Can be caused by voltage unbalance Can indicate internal motor problems – or Connection problems
- 74. Spectrum Rotor Bar V/I Spectrum Demodulated Spectrum Harmonics
- 75. Rotor Bar
- 76. Symptoms Effect of Broken Bars Requires constant torque level or it will pulsate Next one breaks sooner Current increases Temperature increases Insulation life shortens Typically non-immediate death Symptoms of Broken/Degradation Rotor Bars High Rotor Impedance Increase in Rotor Current Heat/Temperature
- 77. Signature of a Good Rotor Bar Known good rotor bar
- 78. Broken Rotor Bars Vertical Line IdentifiesRotor Bar Frequency
- 79. Fan 1 hp 1740 rpm
- 80. Rotor Bar MCSA detects current components induced in the stator winding due to rotating flux components caused by problems such as broken rotor bars or high air gap eccentricity. It is true that broken rotor bars will result in a change to the vibration spectrum, but vibration is traditionally sensed at the bearings and for each motor there is a different mechanical stiffness between the electromagnetic forces caused by broken bars or air gap eccentricity and the position where the vibration is sensed. Consequently the vibration from electromagnetic forces is a second order effect compared to current components directly induced from the specific rotating flux waves. This is not the case with MCSA. With respect to detecting air gap eccentricity problems a similar reasoning applies. It has also been shown that the current spectrum changes due to mechanical misalignment and due to abnormal rotor drive dynamics.
- 81. DETECTION OF BROKEN BARS Primary Causes: Direct on-line (DOL) The starting duty cycles which the rotor cage winding was not designed to withstand. This causes high thermal and mechanical stresses since the starting currents are typically of the order of five times the full-load operating current. Pulsating Mechanical Load Pulsating Load arise when driving reciprocating compressors, ESP, Agitating Pumps etc which can subject the rotor cage to high mechanical stresses.
- 82. DETECTION OF BROKEN BARS Broken rotor bars result in current components being induced in the stator winding at frequencies given by Equation fsb = f1(1 ± 2s) Hz
- 83. CURRENT SIGNATURE DUE TO BROKEN BARS LOWE SIDEBAND f1 =SUPPLY FREQUENCY (50 Hz) Hz dB UPPER SIDEBAND
- 84. SIGNATURE PATTERN DUE TO BROKEN BARS TWICE SLIP FREQUENCY SIDEBANDS fsb = f1±2sf1 -2sf1 +2sf1 f1 dB Hz IDEALISED Current Spectrum – Due to Broken Rotor Bars
- 85. Case Study Vedanta Aluminum Extraction Plant, India Motor Details ID Fan V=6600 I=40 A HP=475.87 Speed=992
- 86. Air Gap Eccentricity Air Gap Eccentricity consists of two types : Static Dynamic Both air gap exists simultaneously in a real SCIM due to manufacturing tolerances & installation procedure ( in large motors).
- 87. Static eccentricity where the position of minimum radial air gap length is fixed in space. Causes of this include: Static Eccentricity Manufacturing tolerances on each component part. Stator core ovality. Out of tolerance spigots in the end frames that house the bearings. Incorrect installation of large HV motors.
- 88. Dynamic eccentricity where the minimum air gap revolves with the rotor and is a function of space and time. Causes include – Non-concentric rotor and shaft. Thermal bow of the rotor. Combination of high air gap eccentricity, consequential unbalanced magnetic pull (UMP), and a flexible rotor. Severe bearing wear. Rotor core lamination movement independent of the shaft. Dynamic Eccentricity
- 89. Dynamic Air Gap Eccentricity Minimum air gap revolves with the rotor and it is the function of space & time.
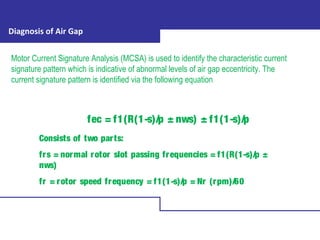
- 90. Diagnosis of Air Gap Motor Current Signature Analysis (MCSA) is used to identify the characteristic current signature pattern which is indicative of abnormal levels of air gap eccentricity. The current signature pattern is identified via the following equation fec = f1(R(1-s)/p ± nws) ± f1(1-s)/p Consists of two parts: frs = normal rotor slot passing frequencies = f1(R(1-s)/p ± nws) fr = rotor speed frequency = f1(1-s)/p = Nr (rpm)/60
- 91. High Air Gap Eccentricity Normal Air Gap Eccentricity Air Gap Eccentricity Graph
- 92. Case Study Vedanta Aluminum, India Motor Details Load : Pump V : 6600 I : 83.17 Speed : 2991 HP : 1072.39 Presence of Dynamic eccentricity
- 93. V/I Spectrum Voltage Current Demodulated Spectra
- 96. Demodulated Spectrum Analyzes the dynamic behaviour of Motor Load System It is the demodulated spectrum of Torque Signature With Channel Control, the demodulated spectrum can be changed from torque to current or voltage of any one phase
- 98. Torque Domain Torque Ripple Displays the instantaneous torque requirements of the load Torque Spectra Two tests are available in torque domain:
- 99. Torque Ripple Normal butHigh Rated Torque Torque Ripple shows the ripple vs rated torque
- 101. Case Study Vedanta Aluminum, India Motor Details Function: Coal crusher , Gear Attached V=6600 I=34.70 Speed=981 HP=375.34
- 102. Torque Spectrum Torque Spectrum Analysis helps to find issue related dynamic behaviour of motor load system. Bearing Issues ( Motor DE, Load End) Analyze Load health (Fan, Gear, Pump, Impeller etc) Shorted Turns Cavitations, Unbalance, Misalignment, Foundation Looseness etc
- 103. Torque Spectrum
- 104. Case Study Bearing Failure 5hp, 4 pole, Baldor Motor 24” Axial Fan Instrumented with Cognitive Systems CV395B Spectrum Analyzer Bentley Nevada ADRE 208P (Automated Diagnostics for Rotating Equipment) SWANTECH stress wave analysis system Air flow meters Accelerometers Laser tachometers Current meters Thermocouples Baker Explorer
- 105. SKF 6503 Deep Groove Bearing .062 deep, .062 wide grove in outer race. Vibration should show at the ball pass frequency in formula below:(n=#balls, f=rot freq, Bd=ball dia, Pd= path dia, beta=contact angle) BPFO=107Hz: )1( 2 )( βCos Pd Bd f n BPFORaceOuter −=
- 107. Vibration Spectrum Known Fault harm. * BPFO ± 2 * RPM
- 108. Known Good Bearing Known Outer Race Defect Torque Spectrum Electrical Frequencies Removed Electrical Frequencies RemovedMarking 1 * BPFOAdding Electrical Harmonic Sidebands BPFO Controlled Lab Test … how it works
- 109. Known Good Bearing
- 110. Outer Race Fault
- 111. BPFO 120Hz – BPFO 240Hz – BPFO 120Hz + BPFO
- 112. VFD Details Torque and Speed vs. Time Frequency and Voltage vs. Time
- 113. VFD: Typical issues Voltage spikes Non-sinusoidal sine wave Shaft voltages Bearing failures Voltage distortion Volts/Hertz ratio
- 114. Variable Frequency VFD: Conveyor Drive. 60 hp, 1200 rpm Frequency Voltage Torque Speed
- 115. VFD: What is going on? Conveyor Drive. 60 hp 1200 rpm • Oscillating • Flawed control loop design • Over rated • Breaking • Generator
- 116. Transient Analysis Captures voltage, current and torque vs time at startup
- 117. Voltage vs. time Torque vs. time Current vs. time Transient Analysis - Normal start-up
- 118. Transient Analysis-Case Study Using start-up transient analysis to adjust soft-starts and locate problem areas. In this case the customer had six new soft-starts installed; five were performing as expected but one was not. Result: New soft-start had to be replaced.
- 119. Proper Operation
- 120. Problem
- 121. Transient analysis: Common signatures
- 122. 3 Identical Vertical Pumps Feeding a Manifold 4160V, 1250hp, 254rpm Pumps designed to pull 32,000Nm from motor. Motor designed to provide 35,000Nm for full load. One Pump pulling only 28,000Nm from motor. Cavitations Case Study
- 123. Findings Problem found in the pump – not the motor: First pump would only run at 28,000Nm or 75% of capacity Pump showed fluctuating torque The utility wanted higher cooling capacity for summer months - pump pulled for repair Repair cost $180,000
- 124. Pump # 1 Typical - Pump # 2 & 3 Torque Signature
- 125. The Saga Continues The pump was repaired & put back on line. Power output of the entire 730MW plant was available…..until One of the other pumps sheared its shaft.
- 126. Second Pump Failed It has been speculated that the first pump’s turbulent water flow in the manifold overstressed the shaft of the second pump. The pump may have have been destined for failure regardless of the first pump’s performance. Torque ripple was higher on 2nd and 3rd pump when 1st pump was running at 75% with loose end bell. Didn’t think too much of this at the time. Plant now down to 2/3rd of it’s thermal output because 1/3rd of cooling capacity was lost. Repair of the second pump took 5 weeks During the 5 weeks, the first pump was able to provide 100% of its rated pumping capacity. Had it still been at 75% capacity, $4,000,000 in power sales would have been lost due to low cooling capacity. (E. Wiedenbrug, “Instantaneous Torque as Predictive Maintenance Tool for Variable Frequency Drives and Line Operated Motors,”)
- 127. Induced Imbalance 7.6 grams introduced at 2” from center of fan – 0.54ounce-inches of imbalance.
- 128. Imbalance Results Torque spectra showed a significant difference between the balanced and unbalanced signal at the 1 x shaft speed. Torque signal very usable in finding imbalances. Accelerometers mounted on the outside of the duct showed a 6.7% increase in amplitude at 1x shaft speed. Vibration does change, but it would be tough to be definitive.
- 129. Loose Fan Belt Case Study Mechanical Problem
- 130. Using “Torque Ripple” to locate mechanical issues. In this case, an air handler was having bearing failures and alignment problems. The torque ripple identified the very cyclic beat of a loose belt.
- 131. Air Handling Fan 125hp, 480V, 1780RPM motor driving an air handling fan – 6 ft between pulleys. Torque varying 25% + Can’t keep motor and fan aligned. Replace fan pillow block bearings every 35- 45 days. Replace motor bearings every 6 months. Use torque deviation to determine when to realign. No longer necessary to replace bearings so often.
Editor's Notes
- #3: IMP NOTES: Since the torque spectrum is not electrically modulated like the current spectrum it is not necessary to perform sideband analysis around the fundamental frequency. Instead, the spectrum is analyzed in the same way as a vibration spectrum.
- #12: Who of you thinks that you get primarily paid to avoid motors from breaking? Who of you thinks that you get paid to avoid downtime? Key difference: with MPM you can do much more than only avoid motors from burning, and finding the root cause for it. VFD: Who of you knows exactly what the VFD is doing? Do you know the speed at which it is running when; the rate of acceleration and the transient torque that it is requesting from the motor? If you don’t know what it is doing to your motors, how can you expect to be able to diagnose and repair conditions caused by the VFD that are tearing up your motor or the load it is driving? We will talk about all these issues during this presentations.
- #16: Chain of events. Why is the chain of events important? You need to know as a second nature the order of cause and response. That is what gives you the power of root cause analysis. How many of you know about motors that blow up every year or two? How many times are you planning on replacing them after they blow, and when do you want to fix what is happening? Right now you don’t have the tool that gives you the knowledge so that you can repair what you are responsible for. Here is how this thing works: The MCC tells the motor: ‘I am sending you 60Hz.’ Motor replies ‘Ok. Load, I would like to turn you at this speed ‘(1800rpm, say). Load says: ‘Ok, you want to do that, then give me this much torque’. Motor responds ‘Fine’. Turns around and says to the MCC: ‘I need this much power’ (remember, mechanical output power of the motor is speed times torque. Both of those parameters are set right now). MCC says ‘Well, I know that I am giving you this particular voltage here’. Then the motor says ‘All right, granted that you offer me this voltage, then give me this amount and type of current’. In short: If you find anything wrong with the torque, it must be caused by the load. If you find anything wrong with the voltage, it must be caused by the MCC. If you find anything wrong with the current, then it is the play of MCC, motor and load together.
- #22: Connection for medium and high voltage motors. Points to get across: a) This type of connection is for any voltage larger than 600V b) More than 9 out of 10 times you will be facing a 2PT and 3CT scenario, which is shown here. We could even do a 2CT and 2PT scenario. c) Typically, the voltage and the current cabinets are physically different cabinets d) There is no problem with an open delta, or floating delta configuration (shown here). It is ok to have 2 hot leads and one ground. Concept: You clip our current clamp ons the following way: one CT around each of the 3 secondaries of their CTs. Typically their CTs are 5 A rating. Use the 10A CT for this. You clip our voltage clips the following way: First, our ground clip to their cabinet ground. Then one of our clips to the first ‘hot’ of their cabinet. Their ‘hot’ is the secondary of their PT. It will be typically 120V. Then our second clip to their second hot. Then our third clip to ground. Don’t worry, it works!
- #36: Think about it: Steady state, three phase system. There can only be 3 things that are wrong with your voltage condition: Level, balance or distortion. Typically you will have a combo of these, with different grades of severity. Very important to have engrained: Pretty much all voltage issues come from up stream. And whatever problem you have with the voltage bus, it will affect the whole voltage bus. It is not only this one motor that you are testing, that is in trouble; it is all the motors connected to that bus (think about all the row of MCC at which you are standing, at a minimum. Walk upstream and find what causes the problem and fix it! If you can’t, make sure that all of your critical motors are derated properly, so that they are not running too hot.) Exception: VFDs create their own voltage condition downstream. Whatever happens downstream of the VFD is not caused by what is happening upstream of it. Think of the VFD as creating 100% of the voltage condition downstream.
- #37: Think about it: Steady state, three phase system. There can only be 3 things that are wrong with your voltage condition: Level, balance or distortion. Typically you will have a combo of these, with different grades of severity. Very important to have engrained: Pretty much all voltage issues come from up stream. And whatever problem you have with the voltage bus, it will affect the whole voltage bus. It is not only this one motor that you are testing, that is in trouble; it is all the motors connected to that bus (think about all the row of MCC at which you are standing, at a minimum. Walk upstream and find what causes the problem and fix it! If you can’t, make sure that all of your critical motors are derated properly, so that they are not running too hot.) Exception: VFDs create their own voltage condition downstream. Whatever happens downstream of the VFD is not caused by what is happening upstream of it. Think of the VFD as creating 100% of the voltage condition downstream.
- #38: Think about it: Steady state, three phase system. There can only be 3 things that are wrong with your voltage condition: Level, balance or distortion. Typically you will have a combo of these, with different grades of severity. Very important to have engrained: Pretty much all voltage issues come from up stream. And whatever problem you have with the voltage bus, it will affect the whole voltage bus. It is not only this one motor that you are testing, that is in trouble; it is all the motors connected to that bus (think about all the row of MCC at which you are standing, at a minimum. Walk upstream and find what causes the problem and fix it! If you can’t, make sure that all of your critical motors are derated properly, so that they are not running too hot.) Exception: VFDs create their own voltage condition downstream. Whatever happens downstream of the VFD is not caused by what is happening upstream of it. Think of the VFD as creating 100% of the voltage condition downstream.
- #44: Think about it: Steady state, three phase system. There can only be 3 things that are wrong with your voltage condition: Level, balance or distortion. Typically you will have a combo of these, with different grades of severity. Very important to have engrained: Pretty much all voltage issues come from up stream. And whatever problem you have with the voltage bus, it will affect the whole voltage bus. It is not only this one motor that you are testing, that is in trouble; it is all the motors connected to that bus (think about all the row of MCC at which you are standing, at a minimum. Walk upstream and find what causes the problem and fix it! If you can’t, make sure that all of your critical motors are derated properly, so that they are not running too hot.) Exception: VFDs create their own voltage condition downstream. Whatever happens downstream of the VFD is not caused by what is happening upstream of it. Think of the VFD as creating 100% of the voltage condition downstream.
- #45: Think about it: Steady state, three phase system. There can only be 3 things that are wrong with your voltage condition: Level, balance or distortion. Typically you will have a combo of these, with different grades of severity. Very important to have engrained: Pretty much all voltage issues come from up stream. And whatever problem you have with the voltage bus, it will affect the whole voltage bus. It is not only this one motor that you are testing, that is in trouble; it is all the motors connected to that bus (think about all the row of MCC at which you are standing, at a minimum. Walk upstream and find what causes the problem and fix it! If you can’t, make sure that all of your critical motors are derated properly, so that they are not running too hot.) Exception: VFDs create their own voltage condition downstream. Whatever happens downstream of the VFD is not caused by what is happening upstream of it. Think of the VFD as creating 100% of the voltage condition downstream.
- #59: Big question: I have a 100hp motor, that says that it is a 1.25 sf on the nameplate. How much power may I expect to run that motor with in steady state, without causing premature deterioration? Answer: 100hp only! The number of 125hp is a typical myth. Here is what the sf number tells you: You may run up to 125hp for short times only. This table tells you the story by looking at the temperatures that motors will run at, when running under a) rated conditions; b) 1.15sf and c) 1.25sf. The most drastic case is the 50hp motor. Lets say that you would wish that motor to last for 20 years, before you have to replace it. Now, the chart indicates that this motor will be running 50 degrees C hotter at 1.25sf than what it would be running at full load. This means that the first 10 degrees will take it from 20 years down to 10. The second 10 degrees take it from 10 years down to 5. 3rd goes from 5 down to 2.5. 4rth goes from 2.5 down to 1.75. And the last 10 degrees half that value into 0.875 years, (10 months).
- #77: Symptoms of broken bars depends on several factor like types of bar, no of rotor bars etc
- #85: In CSA, the pole pass frequency (FP) appears as sidebands surrounding the line frequency (FL) after performing a FFT on a captured signal. The synchronous magnetic pattern of the stator rotates faster than the rotor cage. This implies that any given rotor bar is passed by all of the magnetic poles in one rotation of the slip frequency. The rate at which this occurs is termed the FP. Often in vibration analysis the term for this is called the motor pole passing frequency (PPF). (PPF = motor slip X number of poles). The difference in amplitude between the FL and the FP is an indication of rotor health. Empirical research has shown that a difference of over 54 dB indicates a healthy rotor while less than 45 dB indicates a degraded (i.e., high resistance joints, cracked or broken bars) condition exists in the rotor.
- #91: UMP = Unbalanced magnetic Pull. Maximum limit is 10% in induction motor. Acts on rotor but it rotates at rotor speed. Excessive stress on Motor and can cause bearing wear. Radial magnetic force wave is caused by an eccentricity act on stator and rotor cage resulting winding damage. Where fec = frequency components (Hz) which are a function of air gap eccentricity, f1 = supply frequency (Hz), R = number of rotor slots, nws = eccentricity integer (1, 3, 5......) s = per unit slip, p = pole-pairs, Nr = actual rotor speed (rpm).
- #125: This sunken pump application is of a larger motor. 1250hp very slow turning application. The torque level of this pump in particular was lower than the sister pumps, which were same design, running in the same pit. Additionally, the torque band (ripple surrounding the average torque) was very large, and not even constant. The scenario is very clear. Torque is requested by the load, and the motor has to comply. That is why the torque signature is the very best method to stop the mechanical people from pointing at the electrical and vice versa. If you find something wrong with the torque signature, you know that one way or another it is mechanically induced and can typically be found easily. In this case, they stopped the pump, and pulled it. Pulling the pump costed 60,000U$ (just below 3 times the cost of the MPM Explorer). It was found that this pump had lost its endbell. The endbell is the part that is depicted to the right. Its function is to funnel the water into the pump itself, avoiding for the water to be circulating, and ensuring that it goes up into the pump. Having lost the endbell, and the endbell having fallen into the pit, there was a lot of water that was circulating in the pump, yet not being sucked in. That explains the lower torque level. Additionally, the amount of torque band was caused by the much higher cavitation that that circulating water caused in the pump. The fixed torque signature to the right again displays how obvious of a finding this is, once one has the right tools in hand.