


Pinebridge_2019 Q2
- 1. March 2019 2
- 3. I.
- 4. PAGE 3 MSCI ACWI S&P 500 ICE 600 MSCI MSCI 300 SENSEX MSCI BOVESPA MSCI RTSI - - - - - - Bloomberg 2019/3/8 10.4 6.7 8.5 6.4 1.7 5.3 9.2 21.5 7.3 6.7 5.2 9.7 7.8 9.4 8.6 1.9 1.6 8.2 5.4 2.8 4.9 8.3 15.0 5.6 5.0 -3.0 7.3 7.5 4.2 4.4 3 % % 5.5 2.6 3.2 2.8 4.7 3.3 3.9 4.9 4.4 5.8 5.0 2.4 1.5 0.7 6.2 3.5 4.1 3.8 4.5 4.0 4.2 5.4 4.6 3.7 4.1 2.7 2.5 1.9 - - 3 % %
- 5. PAGE 4 Bloomberg 2019/3/8 -0.5 4.3 -0.6 0.3 2.3 -1.0 1.0 -0.1 2.0 -1.4 -2.0 1.2 -1.9 0.1 1.9 1.0 2.3 0.1 0.6 -2.2 2.2 1.4 -1.2 0.8 3 % % 7.2 1.2 22.2 23.5 6.4 4.1 4.0 6.6 6.6 -1.9 LME CRB 3 % %
- 6. II.
- 7. PAGE 6 3.8 3.7 3.5 3.6 2.4 2.3 2.0 1.7 4.7 4.6 4.5 4.9 0.0 1.0 2.0 3.0 4.0 5.0 6.0 2017 2018 ( ) 2019 ( ) 2020 ( ) • IMF( ) • IMF 2019/1 ( %) (IMF )
- 8. PAGE 7 40 45 50 55 60 65 2016/7 2017/1 2017/7 2018/1 2018/7 2019/1 -1.0% 0.0% 1.0% 2.0% 3.0% 4.0% 5.0% 2010 2011 2012 2013 2014 2015 2016 2017 2018 2019 (GDP) (PMI) (CPI) GDP 2018 4 PMI 2019 2 CPI 2019 1 Bloomberg 2019/3/8 • 2.4% • 0.0% 0.5% 1.0% 1.5% 2.0% 2.5% 3.0% 3.5% 4.0% 2010 2011 2012 2013 2014 2015 2016 2017 2018 0% 2% 4% 6% 8% 10% 12% 2010 2011 2012 2013 2014 2015 2016 2017 2018 2019
- 9. PAGE 8 0.0% 0.5% 1.0% 1.5% 2.0% 2.5% 3.0% 2010 2011 2012 2013 2014 2015 2016 2017 2018 2019 • 12 2.25%~2.5% Bloomberg 2019/3/8 2019 2 2019 3 2019 4 (%) 2.5 2.5 2.5 (%) 2.6 2.7 2.8 0% 10% 20% 30% 40% 50% 60% 70% 80% 90% 100% 2018/10 2018/11 2018/12 2019/1 2019/2 2019/3
- 10. PAGE 9 -1.5% -1.0% -0.5% 0.0% 0.5% 1.0% 1.5% 2.0% 2.5% 3.0% 2010 2011 2012 2013 2014 2015 2016 2017 2018 46 48 50 52 54 56 58 60 62 2016/3 2016/9 2017/3 2017/9 2018/3 2018/9 (GDP) (PMI) -1.0% -0.5% 0.0% 0.5% 1.0% 1.5% 2.0% 2.5% 3.0% 3.5% 2010 2011 2012 2013 2014 2015 2016 2017 2018 2019 0% 2% 4% 6% 8% 10% 12% 14% 2010 2011 2012 2013 2014 2015 2016 2017 2018 2019 (CPI) GDP 2018 4 PMI CPI 2019 2 2019 1 Bloomberg 2019/3/8 • • 1.5%
- 11. PAGE 10 0.0% 0.2% 0.4% 0.6% 0.8% 1.0% 1.2% 1.4% 1.6% 2010 2012 2014 2016 2018 • • Bloomberg 2019/3/8 2019 2 2019 3 2019 4 (%) 0 0 0 (%) 0 0 0.05 0% 10% 20% 30% 40% 50% 60% 70% 80% 90% 100% 2019/1 2019/2 2019/3
- 12. PAGE 11 -2% -1% 0% 1% 2% 3% 4% 5% 6% 7% 2010 2011 2012 2013 2014 2015 2016 2017 2018 46 48 50 52 54 56 2016/3 2016/9 2017/3 2017/9 2018/3 2018/9 (GDP) (PMI) -2% -1% 0% 1% 2% 3% 4% 2010 2011 2012 2013 2014 2015 2016 2017 2018 2019 0% 1% 2% 3% 4% 5% 6% 2010 2011 2012 2013 2014 2015 2016 2017 2018 2019 (CPI) GDP 2018 4 PMI 2019 2 CPI 2019 1 Bloomberg 2019/3/8 • • 2019 1.1%
- 13. PAGE 12 -0.15% -0.10% -0.05% 0.00% 0.05% 0.10% 0.15% 2010 2011 2012 2013 2014 2015 2016 2017 2018 2019 • Bloomberg 2019/3/8 2019 2 2019 3 2019 4 (%) -0.1 -0.1 -0.1 (%) -0.1 -0.1 -0.1 0% 10% 20% 30% 40% 50% 60% 70% 80% 90% 100% 2019/1 2019/2 2019/3
- 14. PAGE 13 46 47 48 49 50 51 52 53 54 55 2016/3 2016/9 2017/3 2017/9 2018/3 2018/9 (GDP) (PMI) (CPI) GDP CPI 2018 4 PMI 2019 2 2018 3 Bloomberg 2019/3/8 • • 2% 3% 4% 5% 6% 7% 8% 9% 10% 2010 2011 2012 2013 2014 2015 2016 2017 2018 2% 3% 4% 5% 6% 7% 8% 2010 2011 2012 2013 2014 2015 2016 2017 2018 4.0% 4.5% 5.0% 5.5% 6.0% 6.5% 7.0% 2010 2011 2012 2013 2014 2015 2016 2017 2018
- 15. III.
- 16. PAGE 15 0.0% 0.5% 1.0% 1.5% 2.0% 2.5% 3.0% 3.5% 4.0% 4.5% 2010 2012 2014 2016 2018 • • 10 3.00% Bloomberg 2019/3/8 10 2 10 2019 2 2019 3 2019 4 (%) 2.91 2.99 3.03 2 2019 2 2019 3 2019 4 (%) 2.74 2.81 2.86
- 17. PAGE 16 -1.5% -1.0% -0.5% 0.0% 0.5% 1.0% 1.5% 2.0% 2.5% 3.0% 3.5% 4.0% 2010 2012 2014 2016 2018 • Bloomberg 2019/3/8 10 2 10 2019 2 2019 3 2019 4 (%) 0.48 0.59 0.71 2 2019 2 2019 3 2019 4 (%) -0.45 -0.36 -0.23
- 18. PAGE 17 • 5 Bloomberg 2019/3/8 50 bp 70 bp 90 bp 110 bp 130 bp 150 bp 170 bp 190 bp 210 bp 230 bp 2013 2014 2015 2016 2017 2018 2019 2.0 % 2.5 % 3.0 % 3.5 % 4.0 % 4.5 % 2013 2014 2015 2016 2017 2018 2019
- 19. PAGE 18 • • (CCC ) Bloomberg 2019/3/8 Bank of America Merrill Lynch 2019/2/28 200 bp 300 bp 400 bp 500 bp 600 bp 700 bp 800 bp 900 bp 2013 2014 2015 2016 2017 2018 2019 0% 1% 2% 3% 4% 5% 6% 7% 8% 2013 2014 2015 2016 2017 2018 2019
- 20. PAGE 19 • 5 6% • ( ) Bloomberg 2019/3/8 (EMBI) 200 bp 250 bp 300 bp 350 bp 400 bp 450 bp 500 bp 550 bp 2013 2014 2015 2016 2017 2018 2019 4.0% 4.5% 5.0% 5.5% 6.0% 6.5% 7.0% 7.5% 2013 2014 2015 2016 2017 2018 2019
- 21. PAGE 20 • • Bloomberg 2019/3/8 (CEMBI) Bank of America Merrill Lynch 2019/2/28 200 bp 250 bp 300 bp 350 bp 400 bp 450 bp 500 bp 550 bp 2013 2014 2015 2016 2017 2018 2019 0% 1% 2% 3% 4% 5% 6% 7% 8% 2013 2014 2015 2016 2017 2018 2019
- 22. PAGE 21 • Bloomberg 2019/3/8 (JACI) Bank of America Merrill Lynch 2019/2/28 150 bp 170 bp 190 bp 210 bp 230 bp 250 bp 270 bp 290 bp 310 bp 330 bp 350 bp 2013 2014 2015 2016 2017 2018 2019 0% 1% 2% 3% 4% 5% 6% 7% 8% 2013 2014 2015 2016 2017 2018 2019
- 23. IV.
- 24. PAGE 23 10 12 14 16 18 20 22 2013 2014 2015 2016 2017 2018 2019 • 2018 2019 10% 16.7 Bloomberg 2019/2/28 500 ( ) -5% 0% 5% 10% 15% 20% 25% 2011 2012 2013 2014 2015 2016 2017 2018 2019 2020
- 25. PAGE 24 • 2018 2019 2018 12 13.8 Bloomberg 2019/2/28 600 10 11 12 13 14 15 16 17 18 2013 2014 2015 2016 2017 2018 2019 ( ) -30% -20% -10% 0% 10% 20% 30% 40% 50% 60% 2011 2012 2013 2014 2015 2016 2017 2018 2019 2020
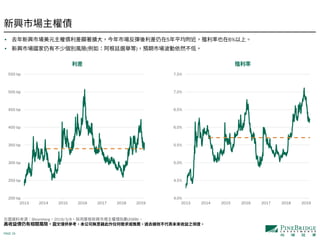
- 26. PAGE 25 • 2018 3% 2019 9 11.7 2018 Bloomberg 2019/2/28 300 5 7 9 11 13 15 17 19 21 2013 2014 2015 2016 2017 2018 2019 ( ) -10% -5% 0% 5% 10% 15% 20% 25% 2011 2012 2013 2014 2015 2016 2017 2018 2019 2020
- 27. PAGE 26 • 2018 2018 2019 Bloomberg 2019/2/28 MSCI 11 13 15 17 19 21 23 2013 2014 2015 2016 2017 2018 2019 ( ) -20% -15% -10% -5% 0% 5% 10% 15% 20% 25% 30% 2011 2012 2013 2014 2015 2016 2017 2018 2019 2020
- 28. PAGE 27 • Bolsonaro 2018 30% 2019 60% Bloomberg 2019/2/28 BOVESPA 8 9 10 11 12 13 14 15 16 17 2013 2014 2015 2016 2017 2018 2019 ( ) -100% -80% -60% -40% -20% 0% 20% 40% 60% 80% 100% -2,000 0 2,000 4,000 6,000 8,000 10,000 2011 2012 2013 2014 2015 2016 2017 2018 2019 2020
- 29. PAGE 28 -200 -100 0 100 200 300 400 • 2018 5.7% 2014 100 Bloomberg 2019/2/28 ICE 5 5.2 5.4 5.6 5.8 6 6.2 6.4 %
- 30. V.
- 31. PAGE 30 Bank of America Merrill Lynch 2019/2/12 ‘11/6 ‘12/1 ‘13/1 ‘14/1 ‘15/1 ‘16/1 ‘17/1 ‘18/1 美銀美林基金經理人調查最大尾端風險(Tail Risk) ‘19/1
- 32. PAGE 31 Barclays 2019/3/8 2019 4 • (4/10) • IMF (4/12~4/14) • (4/25) • (4/11~5/19) 2019 5 • FOMC (5/1) • (5/2) • (5/23~5/26) 2019 6 • (6/6) • FOMC (6/19) • (6/20) • (6/20) • OPEC (6/25~6/26) • G20 (6/28~6/29)
- 33. VI.
- 35. PAGE 34 2019Q2 (↓) 2018 2019 10% (↑) 2019 (↑) 2019 2018 2018 2019 2019 60% (↑) 2014 2019/3
- 37. PAGE 36 0 0.5 1 1.5 2 2.5 3 3.5 4 4.5 2016/1 2016/7 2017/1 2017/7 2018/1 2018/7 2019/1 2019/7 2020/1 2020/7 2016 6 ( 52% 48%) 2017 3 50 2018 11 2019 1 2019 3 2019 3 3 29 2020 12 ( ) → → BBC 2019/3/12 May ( )
- 38. PAGE 37 • 3 May • • • May • • • May • •
- 39. PAGE 38 • • ( ) • • → • → • • ECB • • • • → • → FED • • ( )( )
- 43. PAGE 42 -6% -5% -4% -3% -2% -1% 0% 1% 2% 3% 2018/1 2018/3 2018/5 2018/7 2018/9 2018/11 2019/1 Bloomberg, 2019/02/20 特別股指數2018年以來報酬率走勢(非基金報酬)2018 2018 4.34% (1) 10 9 10 0.23% (2) 4.56% 2019 2018 1 6.63%
- 44. PAGE 43 300 350 400 450 500 550 600 650 2010/1 2011/1 2012/1 2013/1 2014/1 2015/1 2016/1 2017/1 2018/1 2019/1 • 8 特別股指數走勢 Bloomberg, 2019/2/20 : ① 2010/03~2010/05 -6.05% 1.5 ② 2011/07~2011/08 -10.15% 2.5 ③ 2013/05~2013/08 -10.22% 8 ④ 2016/01~2016/02 -4.71% 1 ⑤ 2016/08~2016/11 -5.98% 3.5 ⑥ 2018/09~2018/12 -6.78% 1 -7.32% 2.8 ② ① ③ ④ ⑤ ⑥
- 45. PAGE 44 Bloomberg, 2019/01/31 : 2010年以來特別股指數累積利息與總報酬率走勢(非基金報酬) 57.6% 84.0% • 利息收益才是長期投資特別股的主要報酬來源,故在特別股發行企業的基本面依然強勁的背景下,短期市 場的震盪不應畏懼。 0% 10% 20% 30% 40% 50% 60% 70% 80% 90% 2010 2011 2012 2013 2014 2015 2016 2017 2018 2019
- 46. PAGE 45 Bloomberg, 2019/02/20 2018 1) 5.77% 5 2) 3) 2018 12.3% 特別股殖利率水準與未來報酬表現相關性高 (非基金報酬) -6% -2% 2% 6% 10% 14% 18% 4 4.5 5 5.5 6 6.5 2014/1 2015/1 2016/1 2017/1 2018/1 2019/1 ( ) (%)
- 47. PAGE 46 2004-2006年升息循環結束後特別股大漲 0% 5% 10% 15% 20% 25% 0 1 2 3 4 5 6 2004/06 2004/09 2004/12 2005/03 2005/06 2005/09 2005/12 2006/03 2006/06 2006/09 2006/12 2007/03 2007/06 ( %) ( ) Bloomberg 2004/6/30~2007/06/30 2004 (6/30) 8.84% 11.0% • • 2004 8.84% 11.0%
- 48. PAGE 47 2014 特別股年度總報酬及價格報酬(非基金報酬) * Bloomberg 1999/1/1~2018/12/31 13.7% 4.1% 13.6% -3.7% 15.4% 7.6% 2.3% 10.6% -4.3% 5.8% -3.0% 6.2% -9.7% 8.4% 1.2% -3.5% 4.5% -9.6% -15% -10% -5% 0% 5% 10% 15% 20% 2010 2011 2012 2013 2014 2015 2016 2017 2018 • 2018 2013 2018 • 2018 2013 2018 2013 2014
- 49. PAGE 48 • 5.77% 2016 5.52% Bloomberg, 2019/02/20 特別股指數與殖利率歷史走勢(非基金報酬) 480 500 520 540 560 580 600 620 5 5.2 5.4 5.6 5.8 6 6.2 6.4 2016/1 2016/7 2017/1 2017/7 2018/1 2018/7 2019/1 2016
- 50. PAGE 49 TR108056 PineBridge Investments IP Holding Company Limited • • • ( ) • 108 001 104 144 10 (02)2516-7883 407 386 12 8 (04)2217-8168 802 6 17 1(A5 ) (07)335-5898