SlideShare a Scribd company logo
Barcelona Python Meetup


Plotting data with python and
            pylab
        Giovanni M. Dall'Olio
Problem statement
   Let's say we have a table of data like this:
     name        country     apples      pears
     Giovanni    Italy       31          13
     Mario       Italy       23          33
     Luigi       Italy       0           5
     Margaret    England     22          13
     Albert      Germany     15          6

   How to read it in python?
   How to do some basic plotting?
Alternatives for plotting
          data in python
   Pylab (enthought)→ Matlab/Octave approach
   Enthought → extended version of Pylab (free for 
     academic use)
   rpy/rpy2 → allows to run R commands within 
      python
   Sage → interfaces python with Matlab, R, octave, 
      mathematica, ...
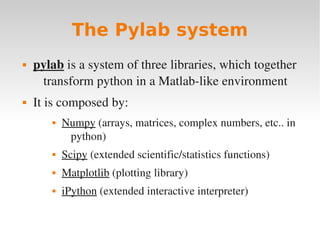
The Pylab system
   pylab is a system of three libraries, which together 
     transform python in a Matlab­like environment
   It is composed by:
          Numpy (arrays, matrices, complex numbers, etc.. in 
            python)
          Scipy (extended scientific/statistics functions)
          Matplotlib (plotting library)
          iPython (extended interactive interpreter)
How to install pylab
   There are many alternatives to install PyLab:
          use the package manager of your linux distro 
          use enthought's distribution (
             http://www.enthought.com/products/epd.php) (free 
             for academic use)
          compile and google for help!
   Numpy and scipy contains some Fortran libraries, 
     therefore easy_install doesn't work well with 
     them
ipython -pylab
   Ipython is an extended version of the standard 
      python interpreter
   It has a modality especially designed for pylab
   The standard python interpreter doesn't support 
     very well plotting (not multi­threading)
   So if you want an interactive interpreter, use 
     ipython with the pylab option:

           $: alias pylab=”ipython -pylab”
           $: pylab

        In [1]:
Why the python interpreter
is not the best for plotting


     Gets blocked when you create a plot
How to read a CSV file with
         python
   To read a file like this in pylab:
      name        country     apples     pears
      Giovanni    Italy       31         13
      Mario       Italy       23         33
      Luigi       Italy       0          5
      Margaret    England     22         13
      Albert      Germany     15         6

   → Use the function 'matplotlib.mlab.csv2rec'
         >>> data = csv2rec('exampledata.txt',
           delimiter='t')
Numpy - record arrays
   csv2rec stores data in a numpy recarray object, where 
      you can access columns and rows easily:
     >>> print data['name']
     ['Giovanni' 'Mario' 'Luigi' 'Margaret'
      'Albert']

     >>> data['apples']
     array([31, 23, 0, 22, 15])

     >>> data[1]
     ('Mario', 'Italy', 23, 33)
Alternative to csv2rec
   numpy.genfromtxt (new in 2009)
   More options than csv2rec, included in numpy
   Tricky default parameters: need to specify dtype=None

      >>> data = numpy.genfromtxt('datafile.txt',
     dtype=None)
      >>> data
      array....
Barchart
>>> data = csv2rec('exampledata.txt', delimiter='t')

>>> bar(arange(len(data)), data['apples'], color='red',
width=0.1, label='apples')

>>> bar(arange(len(data))+0.1, data['pears'],
color='blue', width=0.1, label='pears')

>>> xticks(range(len(data)), data['name'], )

>>> legend()

>>> grid('.')
Barchart
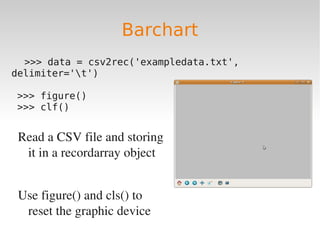
  >>> data = csv2rec('exampledata.txt',
delimiter='t')

>>> figure()
>>> clf()


 Read a CSV file and storing 
  it in a recordarray object


 Use figure() and cls() to 
  reset the graphic device
Barchart
>>> data = csv2rec('exampledata.txt',
delimiter='t')

>>> bar(x=arange(len(data)), y=data['apples'],
color='red', width=0.1, label='apples')

   The bar function creates a 
     barchart
Barchart
>>> data = csv2rec('exampledata.txt',
delimiter='t')

>>> bar(x=arange(len(data)), y=data['apples'],
color='red', width=0.1, label='apples')

>>> bar(arange(len(data))+0.1, data['pears'],
color='blue', width=0.1, label='pears')


   This is the second barchart
Barchart
>>> data = csv2rec('exampledata.txt',
delimiter='t')

>>> bar(x=arange(len(data)), y=data['apples'],
color='red', width=0.1, label='apples')

>>> bar(arange(len(data))+0.1, data['pears'],
color='blue', width=0.1, label='pears')


>>> xticks(range(len(data)), data['name'], )


   Re­defining the labels in the X axis 
     (xticks)
Barchart
>>> data = csv2rec('exampledata.txt',
delimiter='t')

>>> bar(x=arange(len(data)), y=data['apples'],
color='red', width=0.1, label='apples')

>>> bar(arange(len(data))+0.1, data['pears'],
color='blue', width=0.1, label='pears')

>>> xticks(range(len(data)), data['name'], )

>>> legend()
>>> grid('.')
>>> title('apples and pears by person')

   Adding legend, grid, title
Barchart (result)
Pie Chart
>>> pie(data['pears'], labels=data['name'])
>>> pie(data['pears'], labels=['%sn(%s
  pears)' % (i,j) for (i, j) in
  zip(data['name'], data['pears'])] )
Pie chart (result)
A plot chart
>>> x = linspace(1,10, 10)
>>> y = randn(10)
>>> plot(x,y, 'r.', ms=15)
 
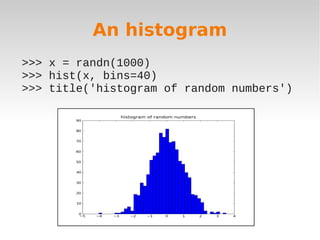
An histogram
>>> x = randn(1000)
>>> hist(x, bins=40)
>>> title('histogram of random numbers')
 
Matplotlib gallery
Scipy Cookbook
Thanks for the attention!!
   PyLab ­ http://www.scipy.org/PyLab 
   matplotlib ­ http://matplotlib.sourceforge.net/ 
   scipy ­ http://www.scipy.org/ 
   numpy ­ http://numpy.scipy.org/ 
   ipython ­ http://ipython.scipy.org/moin/ 


   These slides: http://bioinfoblog.it 

More Related Content

PPTX
PYTHON-Chapter 4-Plotting and Data Science PyLab - MAULIK BORSANIYA
PDF
Introduction to TensorFlow 2.0
PDF
Data visualization
PPTX
Data Analysis with Python Pandas
PDF
Data visualization in Python
PDF
An introduction to Machine Learning
PPTX
Logistic Regression | Logistic Regression In Python | Machine Learning Algori...
PDF
1-5 ADS Notes.pdf
PYTHON-Chapter 4-Plotting and Data Science PyLab - MAULIK BORSANIYA
Introduction to TensorFlow 2.0
Data visualization
Data Analysis with Python Pandas
Data visualization in Python
An introduction to Machine Learning
Logistic Regression | Logistic Regression In Python | Machine Learning Algori...
1-5 ADS Notes.pdf

What's hot (20)

PPTX
Introduction to data science.pptx
PPTX
Supervised and unsupervised learning
PPTX
Python Seaborn Data Visualization
PPTX
Classification and Regression
PPTX
Data Science Training | Data Science For Beginners | Data Science With Python...
PPTX
Dimensionality Reduction and feature extraction.pptx
PDF
Python Matplotlib Tutorial | Matplotlib Tutorial | Python Tutorial | Python T...
PDF
Python For Data Analysis | Python Pandas Tutorial | Learn Python | Python Tra...
PPTX
Python Scipy Numpy
PPTX
What is TensorFlow? | Introduction to TensorFlow | TensorFlow Tutorial For Be...
PPTX
Introduction to Grad-CAM (complete version)
PDF
Data Science Training | Data Science Tutorial for Beginners | Data Science wi...
PDF
Graph Databases - RedisGraph and RedisInsight
PDF
Data Visualization(s) Using Python
PPTX
Data Science With Python | Python For Data Science | Python Data Science Cour...
PPT
Deep learning ppt
PPT
Machine Learning presentation.
PDF
Ai lab manual
PDF
Data Visualization in Data Science
PPT
Decision tree
Introduction to data science.pptx
Supervised and unsupervised learning
Python Seaborn Data Visualization
Classification and Regression
Data Science Training | Data Science For Beginners | Data Science With Python...
Dimensionality Reduction and feature extraction.pptx
Python Matplotlib Tutorial | Matplotlib Tutorial | Python Tutorial | Python T...
Python For Data Analysis | Python Pandas Tutorial | Learn Python | Python Tra...
Python Scipy Numpy
What is TensorFlow? | Introduction to TensorFlow | TensorFlow Tutorial For Be...
Introduction to Grad-CAM (complete version)
Data Science Training | Data Science Tutorial for Beginners | Data Science wi...
Graph Databases - RedisGraph and RedisInsight
Data Visualization(s) Using Python
Data Science With Python | Python For Data Science | Python Data Science Cour...
Deep learning ppt
Machine Learning presentation.
Ai lab manual
Data Visualization in Data Science
Decision tree
Ad

Similar to Plotting data with python and pylab (20)

PDF
A Gentle Introduction to Coding ... with Python
PPTX
Introduction to Python 01-08-2023.pon by everyone else. . Hence, they must be...
PPTX
funadamentals of python programming language (right from scratch)
PDF
Astronomy_python_data_Analysis_made_easy.pdf
PDF
Python For Scientists
PPTX
iPython
PDF
Scientific Python
PDF
Biopython: Overview, State of the Art and Outlook
PPTX
Lecture 5 – Computing with Numbers (Math Lib).pptx
PPTX
Lecture 5 – Computing with Numbers (Math Lib).pptx
PDF
python lab programs.pdf
PPTX
Introduction to Pylab and Matploitlib.
PPTX
Basic of python for data analysis
PPTX
Chapter1 python introduction syntax general
PPTX
Project gnuplot
PDF
bv-python-einfuehrung aplication learn.pdf
PDF
Python Interview Questions PDF By ScholarHat.pdf
PPTX
Lecture 9.pptx
PPTX
PPT on Data Science Using Python
PPTX
Python Interview Questions | Python Interview Questions And Answers | Python ...
A Gentle Introduction to Coding ... with Python
Introduction to Python 01-08-2023.pon by everyone else. . Hence, they must be...
funadamentals of python programming language (right from scratch)
Astronomy_python_data_Analysis_made_easy.pdf
Python For Scientists
iPython
Scientific Python
Biopython: Overview, State of the Art and Outlook
Lecture 5 – Computing with Numbers (Math Lib).pptx
python lab programs.pdf
Introduction to Pylab and Matploitlib.
Basic of python for data analysis
Chapter1 python introduction syntax general
Project gnuplot
bv-python-einfuehrung aplication learn.pdf
Python Interview Questions PDF By ScholarHat.pdf
Lecture 9.pptx
PPT on Data Science Using Python
Python Interview Questions | Python Interview Questions And Answers | Python ...
Ad

More from Giovanni Marco Dall'Olio (20)

PPTX
Applicazioni di chatGPT e altri LLMs per la ricerca di farmaci
PDF
Fehrman Nat Gen 2014 - Journal Club
PDF
Thesis defence of Dall'Olio Giovanni Marco. Applications of network theory to...
PDF
PDF
Version control
PDF
Linux intro 5 extra: awk
PDF
Linux intro 5 extra: makefiles
PDF
Linux intro 4 awk + makefile
PDF
Linux intro 3 grep + Unix piping
PDF
Linux intro 2 basic terminal
PDF
Linux intro 1 definitions
PDF
Wagner chapter 5
PDF
Wagner chapter 4
PDF
Wagner chapter 3
PDF
Wagner chapter 2
PDF
Wagner chapter 1
PDF
Hg for bioinformatics, second part
PDF
Hg version control bioinformaticians
PDF
The true story behind the annotation of a pathway
Applicazioni di chatGPT e altri LLMs per la ricerca di farmaci
Fehrman Nat Gen 2014 - Journal Club
Thesis defence of Dall'Olio Giovanni Marco. Applications of network theory to...
Version control
Linux intro 5 extra: awk
Linux intro 5 extra: makefiles
Linux intro 4 awk + makefile
Linux intro 3 grep + Unix piping
Linux intro 2 basic terminal
Linux intro 1 definitions
Wagner chapter 5
Wagner chapter 4
Wagner chapter 3
Wagner chapter 2
Wagner chapter 1
Hg for bioinformatics, second part
Hg version control bioinformaticians
The true story behind the annotation of a pathway

Recently uploaded (20)

PDF
Dropbox Q2 2025 Financial Results & Investor Presentation
PDF
Spectral efficient network and resource selection model in 5G networks
PPT
Teaching material agriculture food technology
PDF
Review of recent advances in non-invasive hemoglobin estimation
PDF
Encapsulation theory and applications.pdf
PDF
How UI/UX Design Impacts User Retention in Mobile Apps.pdf
PPTX
Understanding_Digital_Forensics_Presentation.pptx
PPTX
Effective Security Operations Center (SOC) A Modern, Strategic, and Threat-In...
PPTX
MYSQL Presentation for SQL database connectivity
PDF
Empathic Computing: Creating Shared Understanding
PPTX
Big Data Technologies - Introduction.pptx
PDF
TokAI - TikTok AI Agent : The First AI Application That Analyzes 10,000+ Vira...
PDF
Shreyas Phanse Resume: Experienced Backend Engineer | Java • Spring Boot • Ka...
PDF
Diabetes mellitus diagnosis method based random forest with bat algorithm
PDF
Approach and Philosophy of On baking technology
PPTX
Detection-First SIEM: Rule Types, Dashboards, and Threat-Informed Strategy
PDF
Encapsulation_ Review paper, used for researhc scholars
PDF
Mobile App Security Testing_ A Comprehensive Guide.pdf
PDF
Chapter 3 Spatial Domain Image Processing.pdf
PDF
The Rise and Fall of 3GPP – Time for a Sabbatical?
Dropbox Q2 2025 Financial Results & Investor Presentation
Spectral efficient network and resource selection model in 5G networks
Teaching material agriculture food technology
Review of recent advances in non-invasive hemoglobin estimation
Encapsulation theory and applications.pdf
How UI/UX Design Impacts User Retention in Mobile Apps.pdf
Understanding_Digital_Forensics_Presentation.pptx
Effective Security Operations Center (SOC) A Modern, Strategic, and Threat-In...
MYSQL Presentation for SQL database connectivity
Empathic Computing: Creating Shared Understanding
Big Data Technologies - Introduction.pptx
TokAI - TikTok AI Agent : The First AI Application That Analyzes 10,000+ Vira...
Shreyas Phanse Resume: Experienced Backend Engineer | Java • Spring Boot • Ka...
Diabetes mellitus diagnosis method based random forest with bat algorithm
Approach and Philosophy of On baking technology
Detection-First SIEM: Rule Types, Dashboards, and Threat-Informed Strategy
Encapsulation_ Review paper, used for researhc scholars
Mobile App Security Testing_ A Comprehensive Guide.pdf
Chapter 3 Spatial Domain Image Processing.pdf
The Rise and Fall of 3GPP – Time for a Sabbatical?

Plotting data with python and pylab

  • 1. Barcelona Python Meetup Plotting data with python and pylab Giovanni M. Dall'Olio
  • 2. Problem statement  Let's say we have a table of data like this: name country apples pears Giovanni Italy 31 13 Mario Italy 23 33 Luigi Italy 0 5 Margaret England 22 13 Albert Germany 15 6  How to read it in python?  How to do some basic plotting?
  • 3. Alternatives for plotting data in python  Pylab (enthought)→ Matlab/Octave approach  Enthought → extended version of Pylab (free for  academic use)  rpy/rpy2 → allows to run R commands within  python  Sage → interfaces python with Matlab, R, octave,  mathematica, ...
  • 4. The Pylab system  pylab is a system of three libraries, which together  transform python in a Matlab­like environment  It is composed by:  Numpy (arrays, matrices, complex numbers, etc.. in  python)  Scipy (extended scientific/statistics functions)  Matplotlib (plotting library)  iPython (extended interactive interpreter)
  • 5. How to install pylab  There are many alternatives to install PyLab:  use the package manager of your linux distro   use enthought's distribution ( http://www.enthought.com/products/epd.php) (free  for academic use)  compile and google for help!  Numpy and scipy contains some Fortran libraries,  therefore easy_install doesn't work well with  them
  • 6. ipython -pylab  Ipython is an extended version of the standard  python interpreter  It has a modality especially designed for pylab  The standard python interpreter doesn't support  very well plotting (not multi­threading)  So if you want an interactive interpreter, use  ipython with the pylab option:      $: alias pylab=”ipython -pylab” $: pylab In [1]:
  • 7. Why the python interpreter is not the best for plotting Gets blocked when you create a plot
  • 8. How to read a CSV file with python  To read a file like this in pylab: name country apples pears Giovanni Italy 31 13 Mario Italy 23 33 Luigi Italy 0 5 Margaret England 22 13 Albert Germany 15 6  → Use the function 'matplotlib.mlab.csv2rec' >>> data = csv2rec('exampledata.txt', delimiter='t')
  • 9. Numpy - record arrays  csv2rec stores data in a numpy recarray object, where  you can access columns and rows easily: >>> print data['name'] ['Giovanni' 'Mario' 'Luigi' 'Margaret' 'Albert'] >>> data['apples'] array([31, 23, 0, 22, 15]) >>> data[1] ('Mario', 'Italy', 23, 33)
  • 10. Alternative to csv2rec  numpy.genfromtxt (new in 2009)  More options than csv2rec, included in numpy  Tricky default parameters: need to specify dtype=None >>> data = numpy.genfromtxt('datafile.txt', dtype=None) >>> data array....
  • 11. Barchart >>> data = csv2rec('exampledata.txt', delimiter='t') >>> bar(arange(len(data)), data['apples'], color='red', width=0.1, label='apples') >>> bar(arange(len(data))+0.1, data['pears'], color='blue', width=0.1, label='pears') >>> xticks(range(len(data)), data['name'], ) >>> legend() >>> grid('.')
  • 12. Barchart >>> data = csv2rec('exampledata.txt', delimiter='t') >>> figure() >>> clf() Read a CSV file and storing  it in a recordarray object Use figure() and cls() to  reset the graphic device
  • 13. Barchart >>> data = csv2rec('exampledata.txt', delimiter='t') >>> bar(x=arange(len(data)), y=data['apples'], color='red', width=0.1, label='apples')  The bar function creates a  barchart
  • 14. Barchart >>> data = csv2rec('exampledata.txt', delimiter='t') >>> bar(x=arange(len(data)), y=data['apples'], color='red', width=0.1, label='apples') >>> bar(arange(len(data))+0.1, data['pears'], color='blue', width=0.1, label='pears')  This is the second barchart
  • 15. Barchart >>> data = csv2rec('exampledata.txt', delimiter='t') >>> bar(x=arange(len(data)), y=data['apples'], color='red', width=0.1, label='apples') >>> bar(arange(len(data))+0.1, data['pears'], color='blue', width=0.1, label='pears') >>> xticks(range(len(data)), data['name'], )  Re­defining the labels in the X axis  (xticks)
  • 16. Barchart >>> data = csv2rec('exampledata.txt', delimiter='t') >>> bar(x=arange(len(data)), y=data['apples'], color='red', width=0.1, label='apples') >>> bar(arange(len(data))+0.1, data['pears'], color='blue', width=0.1, label='pears') >>> xticks(range(len(data)), data['name'], ) >>> legend() >>> grid('.') >>> title('apples and pears by person')  Adding legend, grid, title
  • 18. Pie Chart >>> pie(data['pears'], labels=data['name']) >>> pie(data['pears'], labels=['%sn(%s pears)' % (i,j) for (i, j) in zip(data['name'], data['pears'])] )
  • 20. A plot chart >>> x = linspace(1,10, 10) >>> y = randn(10) >>> plot(x,y, 'r.', ms=15)  
  • 21. An histogram >>> x = randn(1000) >>> hist(x, bins=40) >>> title('histogram of random numbers')  
  • 24. Thanks for the attention!!  PyLab ­ http://www.scipy.org/PyLab   matplotlib ­ http://matplotlib.sourceforge.net/   scipy ­ http://www.scipy.org/   numpy ­ http://numpy.scipy.org/   ipython ­ http://ipython.scipy.org/moin/   These slides: http://bioinfoblog.it