Risk and Return
Download as PPT, PDF3 likes4,528 views

The document discusses rates of return, including holding-period return and dividend yield, and methods for calculating these such as arithmetic and geometric averages. It explains the distinction between systematic and unsystematic risk, detailing various sources of risk associated with investments, particularly in foreign securities. The document also emphasizes the importance of standard deviation as a measure of risk and provides examples of average returns and associated risks for different asset classes.
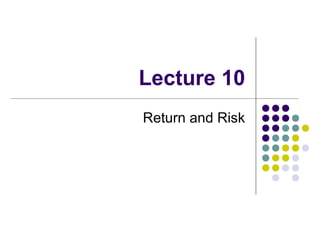


![Geometric Average
nth root of the product of returns for n years
Geometric mean = (1+R1)x(1+R2)x(1+R3)1/n
– 1
= [(1+10%) x (1+ 25%) x(1+(-20%))] 1/3
– 1
[(1.1) x (1.25) x (.8)] 1/3
– 1
(1.1) 1/3
– 1
1.03-1
.03 or 3%](https://image.slidesharecdn.com/riskandreturn-140504113935-phpapp02/85/Risk-and-Return-6-320.jpg)


![Equation for calculating
returns from foregin stocks
= [(P1/Po)x(C1/Co)] – 1
[(310/300)x(78/60)] – 1
[(1.03) x (1.3)] – 1
1.339 – 1
0.339 or 34%
P1 = Ending share price
Po = Beginning share price
C1 = Ending value of domestic currency
Co = Beginning value of domestic currency](https://image.slidesharecdn.com/riskandreturn-140504113935-phpapp02/85/Risk-and-Return-11-320.jpg)


![Measuring Risk
The most commonly used measure of risk
for securities is standard deviation
SD measure the total risk of a security or a
portfolio
It measure deviations of each observation
from the arithmetic mean
1
]R-[R
1
2
_
i
−
=
∑=
n
n
i
σ
Measuring Risk](https://image.slidesharecdn.com/riskandreturn-140504113935-phpapp02/85/Risk-and-Return-17-320.jpg)
![Standard Deviation
89.5
4
139
15
139
==
−
1
]R-[R
1
2
_
i
−
∑=
n
n
i](https://image.slidesharecdn.com/riskandreturn-140504113935-phpapp02/85/Risk-and-Return-18-320.jpg)


Risk and Return
- 1. Lecture 10 Return and Risk
- 2. Rates of Return A key measure of investors’ success is the rate at which their funds have grown Holding-period return (HPR) of shares is composed of capital gain and dividend RH = (C)+ (PE-PB) /PB This definition assumes end of period returns and ignores re-investment of income
- 3. Return Relative It is a different way to calculate return. This method is used when a cumulative wealth index or a geometric mean has to be calculated. Return Relative (RR)= C+PE/PB Rates of Return
- 4. Rates of Return Dividend Yield = Percentage return from dividends i.e. (D/PB)x100 To calculate HPR over a period of time, we can use: Arithmetic average Geometric average Dollar weighted return
- 5. Arithmetic Average It is the sum of periodic return divided by number of periods Arithmetic Average = 15/3 = 5% Period 1 10% Period 2 25% Period 3 -20% Sum 15%
- 6. Geometric Average nth root of the product of returns for n years Geometric mean = (1+R1)x(1+R2)x(1+R3)1/n – 1 = [(1+10%) x (1+ 25%) x(1+(-20%))] 1/3 – 1 [(1.1) x (1.25) x (.8)] 1/3 – 1 (1.1) 1/3 – 1 1.03-1 .03 or 3%
- 7. Problem with Arithmetic average Suppose the following: Calculating arithmetic mean gives false value of 25% return = (100%-50%)/2 And geometric = (1+1)x(1-.5)1/2 - 1 =1-1 = 0% Year Begin value Ending value HPR 2007 50 100 100% 2008 100 50 -50%
- 8. Geometric Vs Arithmetic In highly volatile security prices, arithmetic mean is biased upward and we should use geometric mean If rates of returns are the same for all years, geometric and arithmetic averages gives same results
- 9. Taking a Global When investors buy or sell securities in other countries, they also take exchange rate risk or currency risk Fluctuation in currency value can be either a source of loss or profit If the foreign currency strengthens, your returns will increase or vice versa
- 10. An Example Suppose you purchased 100 shares of IBM at NYSE for $300 each. The dollar-rupee parity was 60 rupees a dollar at the that time. So your total investment in rupees was 100x$300 = $30000 x 60 =Rs.1800,000 At the end of the year, IBM share price was $310, giving you $10 profit per share, your profit is = 100 x 10 = $1000x60 = Rs.60000 But the dollar-rupee parity had jumped to 78 rupee a dollar, now your total investment is =100x310 = $31000 x 78 = Rs.2418000 And your profit is 2,418,000-180,0000 = Rs.618,000 Or in percentage = 618,000/1800,000 = .343 or 34%
- 11. Equation for calculating returns from foregin stocks = [(P1/Po)x(C1/Co)] – 1 [(310/300)x(78/60)] – 1 [(1.03) x (1.3)] – 1 1.339 – 1 0.339 or 34% P1 = Ending share price Po = Beginning share price C1 = Ending value of domestic currency Co = Beginning value of domestic currency
- 12. Risk Any investment involves some degree of uncertainty about future returns Risk arises out of variability in returns If an asset has no variability in returns, the assets is considered to be risk free like one year T-bills
- 13. Type of Risk Systematic Risk (Not diversifiable) Market Risk Interest Rate Risk Purchasing Power Risk Unsystematic Risks (Diversifiable) Business Risk Financial risk
- 14. Sources of Risk Market risk : variability in returns due to fluctuations in aggregate market Recession, wars etc Interest Rate Risk Interest risk refers to variability of total returns, particularly on fixed income securities due fluctuation in Interest rates. Purchas Power or Inflation risk when purchasing power declines. Inflation also leads to hike in interest rates because lenders demand more to compensate themselves for loss in purchasing power
- 15. Exchange risk = for international investors, a source of risk come from exchange rate fluctuation Country Risk = For international investors, economic and political stability, law and order situation are important consideration in the investment decision Sources of Risk
- 16. Interest rates and returns 1. Increase in interest rates increases the required rate of return RRR= Rf + Risk premium which reduces the prices of the securities (intrinsic value) 2. It increases cost of borrowing and hence cost of capital 3. It reduces money supply which lower demand for securities and resultantly prices fall. RRR Cashflow alueIntrinsicV + = 1
- 17. Measuring Risk The most commonly used measure of risk for securities is standard deviation SD measure the total risk of a security or a portfolio It measure deviations of each observation from the arithmetic mean 1 ]R-[R 1 2 _ i − = ∑= n n i σ Measuring Risk
- 19. Interpretation The 5.89 SD means that the security return can fluctuate between +/-5.89 from the mean value of 16% More specifically, the return can fluctuate between 16 - 5.89 = 10.11 or 16 + 5.89 = 21.89 Your return could fall to as low as 10.11% or could rise to 21.89 %
- 20. Realized Returns and risk from Investing Class of assets Average SD S&P 500 Composite 9.21% 19.75% S&P Industrial 9.66 21.57 S&P Utility 8.47 20.54 Small Cap Stock (S&P 600) 14.82 37.23 AAA 20-year Corp Bond 3.87 10.05 US 15-year Bond 3.25 10.22 T-Bills 1.569 4.65