SlideShare a Scribd company logo
Season 4 [Free OpManager training] Part2- Monitoring Server Performance
Welcome to a free OpManager training session
Can you hear me? Can you see the
presentation?
Please confirm by commenting in the webinar chat panel
Trainer
Sharath Babu
Techinal Support Engineer
Training schedule
Week Module Date Schedule Status
1st Discovery and
classification
July 11th 06:30am GMT Completed
2nd Server performance
monitoring
Jul 18th 06:30am GMT In progress
3rd Network
performance
monitoring
Jul 25th 06:30am GMT Upcoming
4th Effective fault
management and IT
automation
Aug 1st 06:30am GMT Upcoming
5th Network maps;
reports and best
practices
Aug 8th 06:30am GMT Upcoming
www.opmanager.com/training.html
Week 2
Server performance monitoring
Agenda
 Monitoring device availability
 Monitoring server performance
 Monitoring virtual server performance
 Creating custom WMI monitor
 Script monitoring
 Troubleshooting tips
Monitor Protocol Status Color-code/Severity
Device ICMP/TCP port check Availability, response time,
and packet loss
Attention (1 poll)
Trouble (3 polls)
Critical (5 polls)
Interface SNMP Up/down Interface down
Service TCP port check Up/down Service down
Windows NT
service
WMI Up/down Service down
Process WMI/SNMP/SSH/Telnet Up/down Process down
File/Folder WMI Availability
URL HTTP /HTTPS Availability, response time
Service down
• ICMP/TCP
• Configuring thresholds for packet loss and response time
• Configuring uplink dependency
• Polling Interval
Monitoring Availability
UP Down
On maintenance On hold
Dependent unavailable
Not
monitored
Outage historyAvailability statistics
Status
Monitoring Services
TCP service
Windows
service
Monitoring Processes
• Processes up/down status
• Configure threshold for critical process
• Process template
Hard disk usage
- Free disk space
- Used disk space
- Disk utilization
- Disk speed per sec
- Disk queue length
CPU usage
- CPU utilization
- % Privileged time
- Top processes
by CPU usage
Memory usage
- Memory utilization
- Pages per second
(faults, reads, and
writes)
- Top process by
memory usage
Server reports
- Server health
report
- Disk forecast by
usage etc
Monitoring Server performance
Performance metrics
- CPU ready time
- CPU wait time
- Memory balloon
- Network
- Disk
- Datastore monitors
Harware metrics
- Sensor
- power
- temperature
- voltage, etc
Protocol
- VMware API
Supported vendors
- Dell
- HP
Inventory changes
- vMotion
- Host connections
- VMs connections
- VMs powered on/off
- VMs orphaned
- Scheduled task removed
etc
Reports
- Identify under-utlized
and over-provisioned
resources
- VM sprawl dashboard
- Virtual maps
Hardware metricsPerformance metrics VMware events Virtual Reports
VMware vCenter Server/ESX Host
MSSQL
- SQL services
- Batch request per sec
- Current database size
- Session request
- SQL cache memory
- Average lock wait time
- Lazy writes per sec
MS Exchange
- Exchange services
- Active user count
- Messages sent per
second
- Messages queued for
delivery per second
- I/O database
reads/writes per second
MS Active Directory
- Active Directory services
- LDAP bind time
- LDAP searches
- LDAP authentications
- Replication objects
remaining
- Kerberos
authentications
- NTLM authentications
Monitoring Application performance
Creating custom WMI monitors
• Windows server with
access details
• WMI class
• Custom dial for
performance monitors
• Write a script to monitor a specific performance metric for which you
can't find in a standard SNMP or WMI monitor
• Any script language that runs on a shell or prompt is supported
o VB script
o Power shell script
o Perl script
o Shell script
o Python script
• Export/import existing script templates
o Download one from ManageEngine
(https://resources.manageengine.com/resources/forum/opmanager/custom-script-
templates)
Script monitor
Monitoring website URL
• Monitor URL availability of both intranet and internet web
applications
• Configuring threshold for URL response time
• Configuring match content
• Configure proxy details for URLs behind a proxy
o Settings > Basic settings > Proxy server settings
File and folder monitoring
• Monitor the availability of files and folders
• Configure thresholds for folder size and
get notified whenever that size is
exceeded
• Configure filters based on file extensions
to monitor only the required files
• Configure thresholds for file size, age, or
count and set an alert to get notified when
those values exceed the threshold value
• Perform automatic checks on files and
folders that triggers alerts when any
https://pitstop.manageengine.com/portal/kb/articles/wmi-credentials-does-not-pass-
with-error-rpc-server-unavailable
Troubleshooting : WMI monitor not collecting data
Errors
• Access denied
• RPC server unavailable
Possible reason for the failure
• Wrong password/ Credential not associated
• WMI account used in OpManager might have
limited privilege
• WMI ports blocked by firewall
Troubleshooting
• Windows management instrumentation tester
- device namerootcimv2
- credential used in OpManager
Query WMI class
youtube.com/opmanagertechvideos
help.opmanager.com
eval-itom@manageengine.com
opmanager-support@manageengine.com
+1 888 720 9500 / +1 408 916 9400
More help?
forums.manageengine.com/opmanager
Gartner's recognition for its
Network Performance Monitoring
and Diagnostics (NPMD) magic
quadrant 2018
Network performance monitoring | July 25th
06:30am GMT| Asia,Australia,Middle-East and Europe
Next training schedule
Questions?
www.manageengine.com
THANK YOU
Sharath Babu
sharathbabu.r@zohocorp.com

More Related Content

PDF
Season 4 [Free OpManager training] Part3 - Monitoring Network Performance
PPTX
[Season - 3 Free OpManager Training] Monitoring Server Performance
PPTX
Season 3 [free OpManager training]_Part1- Discovery and classification
PPTX
Free OpManager training Part1- Discovery and classification
PPTX
Free OpManager training Part 2- Monitoring Server Performance
PPTX
Free OpManager training Part3- Network performance monitoring
PPTX
Free OpManager training Part1- Discovery and classification season#3
PPTX
[Season - 3 OpManager Training] Monitoring Network Performance
Season 4 [Free OpManager training] Part3 - Monitoring Network Performance
[Season - 3 Free OpManager Training] Monitoring Server Performance
Season 3 [free OpManager training]_Part1- Discovery and classification
Free OpManager training Part1- Discovery and classification
Free OpManager training Part 2- Monitoring Server Performance
Free OpManager training Part3- Network performance monitoring
Free OpManager training Part1- Discovery and classification season#3
[Season - 3 OpManager Training] Monitoring Network Performance

What's hot (20)

PPTX
Free OpManager training Part 2 Monitoring Server Performance- season#3
PPTX
Free OpManager training Part 4 - Monitoring Network Performance and Network Maps
PPTX
Free OpManager training Part 3 - Monitoring Network Performance and Network Maps
PDF
[Season - 3] OpManager Training - Network Maps,Reports and Best Practices
PPTX
Opmanager Workshop - Middle East
PPSX
Theory Review II (pps)
PPTX
data communication protocol
PDF
Feed The Reef - Final architecture presentation
PPTX
Real time network monitoring
PPTX
F5 tcpdump
PPTX
Iot protocols tr 069
PPS
Iuwne10 S02 L04
PPTX
Ncm Middle East Workshop
PPTX
Network Configuration Manager Training - [Season 7] Part 1 - Configuration ba...
PDF
Honeywell alarmnet-internet-connectivity-test
PPTX
Advanced Internet of Things firmware engineering with Thingsquare and Contiki...
PPT
Universal IP Overview 2009
PPS
Iuwne10 S02 L07
PDF
5 initial access to palo alto using cli
PPS
Iuwne10 S01 L09
Free OpManager training Part 2 Monitoring Server Performance- season#3
Free OpManager training Part 4 - Monitoring Network Performance and Network Maps
Free OpManager training Part 3 - Monitoring Network Performance and Network Maps
[Season - 3] OpManager Training - Network Maps,Reports and Best Practices
Opmanager Workshop - Middle East
Theory Review II (pps)
data communication protocol
Feed The Reef - Final architecture presentation
Real time network monitoring
F5 tcpdump
Iot protocols tr 069
Iuwne10 S02 L04
Ncm Middle East Workshop
Network Configuration Manager Training - [Season 7] Part 1 - Configuration ba...
Honeywell alarmnet-internet-connectivity-test
Advanced Internet of Things firmware engineering with Thingsquare and Contiki...
Universal IP Overview 2009
Iuwne10 S02 L07
5 initial access to palo alto using cli
Iuwne10 S01 L09
Ad

Similar to Season 4 [Free OpManager training] Part2- Monitoring Server Performance (20)

PPTX
Free OpManager training_ Part 2-server monitoring
PPTX
Network and server performance monitoring training
PPT
Microsoft Infrastructure Monitoring using OpManager
PPTX
Network fault management and IT automation training
PPT
Proof of Concept Guide for ManageEngine OpManager
PPTX
Free OpManager training_Part 1- Discovery & classification
PPT
Op Manager
PPTX
Opmanager technical overview
PPTX
Season 4 [Free OpManager training] Part1- Discovery and classification
PPTX
OpManager Technical Overview
PPTX
Overview OpManager
PPTX
Opmanagertechnicaloverview 160128123947
PPTX
OpManager - Technical overview
PPT
Op Manager7
PPTX
New OpManager v12
PPTX
Server monitoring made easy with Applications Manager
PPT
Vincent Haynes(Cis516 Assignment Week 9)
PPTX
Flagler college replaces microsoft SCOM with opmanager to manage 3300 interf...
PDF
OpManager-Overview-30-9-14.pdf
PPTX
Monitoring network performance- Part 3_Free OpManager training
Free OpManager training_ Part 2-server monitoring
Network and server performance monitoring training
Microsoft Infrastructure Monitoring using OpManager
Network fault management and IT automation training
Proof of Concept Guide for ManageEngine OpManager
Free OpManager training_Part 1- Discovery & classification
Op Manager
Opmanager technical overview
Season 4 [Free OpManager training] Part1- Discovery and classification
OpManager Technical Overview
Overview OpManager
Opmanagertechnicaloverview 160128123947
OpManager - Technical overview
Op Manager7
New OpManager v12
Server monitoring made easy with Applications Manager
Vincent Haynes(Cis516 Assignment Week 9)
Flagler college replaces microsoft SCOM with opmanager to manage 3300 interf...
OpManager-Overview-30-9-14.pdf
Monitoring network performance- Part 3_Free OpManager training
Ad

More from ManageEngine, Zoho Corporation (20)

PPTX
Create seamless customer experiences
PDF
From web interface to database: Monitor what matters
PDF
NetFlow Analyzer Free Training Series Part I - May 2020
PDF
Overcome real-time server and VM monitoring challenges
PPTX
Modernizing Cloud and Hyperconverged Infrastructure monitoring
PPTX
Deliver seamless digital experience
PDF
Free NetFlow Analyzer training Season 1 Part 2 - Feb 2020
PPTX
From web interface to the database:Monitor all that matters
PDF
NetFlow Analyzer Training Season 1 Part 1 - Feb 2020 - EST
PDF
NetFlow Analyzer Training Season 1 Part 1 - Feb 2020 - GMT
PDF
NetFlow Analyzer Product Overview
PPTX
Monitoring cloud applications and hyperconverged infrastructure
PPTX
Building the right website monitoring strategy
PPTX
Unlock the value of your big data infrastructure
PPTX
Key to optimal end user experience
PPTX
Monitoring cloud applications and containers
PPTX
implementing the right website monitoring strategy
PPTX
Big data and non relational database
PPTX
Visibility-from web application interface to the database
PPTX
OpUtils Free training
Create seamless customer experiences
From web interface to database: Monitor what matters
NetFlow Analyzer Free Training Series Part I - May 2020
Overcome real-time server and VM monitoring challenges
Modernizing Cloud and Hyperconverged Infrastructure monitoring
Deliver seamless digital experience
Free NetFlow Analyzer training Season 1 Part 2 - Feb 2020
From web interface to the database:Monitor all that matters
NetFlow Analyzer Training Season 1 Part 1 - Feb 2020 - EST
NetFlow Analyzer Training Season 1 Part 1 - Feb 2020 - GMT
NetFlow Analyzer Product Overview
Monitoring cloud applications and hyperconverged infrastructure
Building the right website monitoring strategy
Unlock the value of your big data infrastructure
Key to optimal end user experience
Monitoring cloud applications and containers
implementing the right website monitoring strategy
Big data and non relational database
Visibility-from web application interface to the database
OpUtils Free training

Recently uploaded (20)

PPTX
MicrosoftCybserSecurityReferenceArchitecture-April-2025.pptx
PDF
1 - Historical Antecedents, Social Consideration.pdf
PDF
NewMind AI Weekly Chronicles – August ’25 Week III
PDF
WOOl fibre morphology and structure.pdf for textiles
PPTX
Group 1 Presentation -Planning and Decision Making .pptx
PDF
DASA ADMISSION 2024_FirstRound_FirstRank_LastRank.pdf
PDF
Getting Started with Data Integration: FME Form 101
PDF
Zenith AI: Advanced Artificial Intelligence
PPTX
1. Introduction to Computer Programming.pptx
PDF
From MVP to Full-Scale Product A Startup’s Software Journey.pdf
PDF
DP Operators-handbook-extract for the Mautical Institute
PPT
Module 1.ppt Iot fundamentals and Architecture
PPT
What is a Computer? Input Devices /output devices
PDF
Video forgery: An extensive analysis of inter-and intra-frame manipulation al...
PPTX
O2C Customer Invoices to Receipt V15A.pptx
PDF
Microsoft Solutions Partner Drive Digital Transformation with D365.pdf
PDF
project resource management chapter-09.pdf
PDF
STKI Israel Market Study 2025 version august
PDF
2021 HotChips TSMC Packaging Technologies for Chiplets and 3D_0819 publish_pu...
PPTX
Programs and apps: productivity, graphics, security and other tools
MicrosoftCybserSecurityReferenceArchitecture-April-2025.pptx
1 - Historical Antecedents, Social Consideration.pdf
NewMind AI Weekly Chronicles – August ’25 Week III
WOOl fibre morphology and structure.pdf for textiles
Group 1 Presentation -Planning and Decision Making .pptx
DASA ADMISSION 2024_FirstRound_FirstRank_LastRank.pdf
Getting Started with Data Integration: FME Form 101
Zenith AI: Advanced Artificial Intelligence
1. Introduction to Computer Programming.pptx
From MVP to Full-Scale Product A Startup’s Software Journey.pdf
DP Operators-handbook-extract for the Mautical Institute
Module 1.ppt Iot fundamentals and Architecture
What is a Computer? Input Devices /output devices
Video forgery: An extensive analysis of inter-and intra-frame manipulation al...
O2C Customer Invoices to Receipt V15A.pptx
Microsoft Solutions Partner Drive Digital Transformation with D365.pdf
project resource management chapter-09.pdf
STKI Israel Market Study 2025 version august
2021 HotChips TSMC Packaging Technologies for Chiplets and 3D_0819 publish_pu...
Programs and apps: productivity, graphics, security and other tools

Season 4 [Free OpManager training] Part2- Monitoring Server Performance

  • 2. Welcome to a free OpManager training session
  • 3. Can you hear me? Can you see the presentation? Please confirm by commenting in the webinar chat panel
  • 5. Training schedule Week Module Date Schedule Status 1st Discovery and classification July 11th 06:30am GMT Completed 2nd Server performance monitoring Jul 18th 06:30am GMT In progress 3rd Network performance monitoring Jul 25th 06:30am GMT Upcoming 4th Effective fault management and IT automation Aug 1st 06:30am GMT Upcoming 5th Network maps; reports and best practices Aug 8th 06:30am GMT Upcoming www.opmanager.com/training.html
  • 7. Agenda  Monitoring device availability  Monitoring server performance  Monitoring virtual server performance  Creating custom WMI monitor  Script monitoring  Troubleshooting tips
  • 8. Monitor Protocol Status Color-code/Severity Device ICMP/TCP port check Availability, response time, and packet loss Attention (1 poll) Trouble (3 polls) Critical (5 polls) Interface SNMP Up/down Interface down Service TCP port check Up/down Service down Windows NT service WMI Up/down Service down Process WMI/SNMP/SSH/Telnet Up/down Process down File/Folder WMI Availability URL HTTP /HTTPS Availability, response time Service down
  • 9. • ICMP/TCP • Configuring thresholds for packet loss and response time • Configuring uplink dependency • Polling Interval Monitoring Availability
  • 10. UP Down On maintenance On hold Dependent unavailable Not monitored Outage historyAvailability statistics Status
  • 12. Monitoring Processes • Processes up/down status • Configure threshold for critical process • Process template
  • 13. Hard disk usage - Free disk space - Used disk space - Disk utilization - Disk speed per sec - Disk queue length CPU usage - CPU utilization - % Privileged time - Top processes by CPU usage Memory usage - Memory utilization - Pages per second (faults, reads, and writes) - Top process by memory usage Server reports - Server health report - Disk forecast by usage etc Monitoring Server performance
  • 14. Performance metrics - CPU ready time - CPU wait time - Memory balloon - Network - Disk - Datastore monitors Harware metrics - Sensor - power - temperature - voltage, etc Protocol - VMware API Supported vendors - Dell - HP Inventory changes - vMotion - Host connections - VMs connections - VMs powered on/off - VMs orphaned - Scheduled task removed etc Reports - Identify under-utlized and over-provisioned resources - VM sprawl dashboard - Virtual maps Hardware metricsPerformance metrics VMware events Virtual Reports VMware vCenter Server/ESX Host
  • 15. MSSQL - SQL services - Batch request per sec - Current database size - Session request - SQL cache memory - Average lock wait time - Lazy writes per sec MS Exchange - Exchange services - Active user count - Messages sent per second - Messages queued for delivery per second - I/O database reads/writes per second MS Active Directory - Active Directory services - LDAP bind time - LDAP searches - LDAP authentications - Replication objects remaining - Kerberos authentications - NTLM authentications Monitoring Application performance
  • 16. Creating custom WMI monitors • Windows server with access details • WMI class • Custom dial for performance monitors
  • 17. • Write a script to monitor a specific performance metric for which you can't find in a standard SNMP or WMI monitor • Any script language that runs on a shell or prompt is supported o VB script o Power shell script o Perl script o Shell script o Python script • Export/import existing script templates o Download one from ManageEngine (https://resources.manageengine.com/resources/forum/opmanager/custom-script- templates) Script monitor
  • 18. Monitoring website URL • Monitor URL availability of both intranet and internet web applications • Configuring threshold for URL response time • Configuring match content • Configure proxy details for URLs behind a proxy o Settings > Basic settings > Proxy server settings
  • 19. File and folder monitoring • Monitor the availability of files and folders • Configure thresholds for folder size and get notified whenever that size is exceeded • Configure filters based on file extensions to monitor only the required files • Configure thresholds for file size, age, or count and set an alert to get notified when those values exceed the threshold value • Perform automatic checks on files and folders that triggers alerts when any
  • 20. https://pitstop.manageengine.com/portal/kb/articles/wmi-credentials-does-not-pass- with-error-rpc-server-unavailable Troubleshooting : WMI monitor not collecting data Errors • Access denied • RPC server unavailable Possible reason for the failure • Wrong password/ Credential not associated • WMI account used in OpManager might have limited privilege • WMI ports blocked by firewall Troubleshooting • Windows management instrumentation tester - device namerootcimv2 - credential used in OpManager Query WMI class
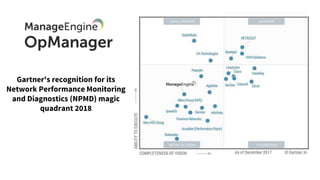
  • 22. Gartner's recognition for its Network Performance Monitoring and Diagnostics (NPMD) magic quadrant 2018
  • 23. Network performance monitoring | July 25th 06:30am GMT| Asia,Australia,Middle-East and Europe Next training schedule