SlideShare a Scribd company logo
UNIVERSITY OF MYSORE
SUBJECT: Fundamentals of Information Technology
SEMINOR ON : Spreadsheet
presented by,
Rashmi N.
DOS in LIS
Manasagangotri
Mysuru
CONTENTS
• Introduction
• Basics of spread sheet
• Types of data
• Formulas and function
• Tools
• Useful features
• Uses of spread sheet
INTRODUCTION
A spread sheet is a software that permits numerical data to
be used and to perform automatic calculation on numbers
contained in a table.
Numerous spread sheets have been produced by the
main software companies. The main spread sheets are;
Microsoft excel, in the microsoft office suite
Sun star office calc.
Open calc.
IBM
.
In addition ,spread sheet can also easily produce graphic
representation of the data entered.
Histograms
Curves
Sector charts
micro soft excel has initial release in sept.30 1985 ; 30
years ago
.
Microsoft excel is a spreadsheet developed by
Microsoft for windows, Android. It features calculation,
graphing tools, pivot tables, and a macro programming
language called visual basic for applications. it has been a
very widely applied spreadsheet for these platforms,
especially since version 5 in 1993, and it has replaced
lotus 1-2-3 as the industry standard for spreadsheets.
Excel is a part of microsoft office.
.
• Excel is a spreadsheet, a grid made from columns and
rows. It is a software program that can make number
manipulation easy and somewhat painless.
• The nice thing about using a computer and spreadsheet
is that you can experiment with numbers without having
to RE-DO all the calculations.
BASICS OF A SPREADSHEET
• Spreadsheets are made up of
• Columns
• Rows
• and their intersections are called cells
WHAT IS A COLUMN ?
• In a spreadsheet the
COLUMN is defined
as the vertical space
that is going up and
down the window.
Letters are used to
designate each
COLUMN'S location.
• COLUMN labeled D
is highlighted.
WHAT IS A ROW?
• In a spreadsheet the
ROW is defined as
the horizontal space
that is going across
the window. Numbers
are used to designate
each ROW'S location.
• ROW labeled 4 is
highlighted.
WHAT IS A CELL ?
• A CELL is the space
where a row and
column intersect.
Each CELL is
assigned a name
according to its
COLUMN letter and
ROW number.
• In the above diagram
the CELL labeled C2
is highlighted.
NUMBER OF ROWS AND COLUMNS
• Version of excel up to 7.0 (16384 rows )
• Version of excel 8.0-11.0 (65536 rows and 256columns).
• Version of excel 12.0(1048576 rows and 16384 columns
TYPES OF DATA
• In each cell there may be the following data types:
• Labels -- (text with no numerical value)
• Number data (constant values)
• Formulas (mathematical equation used to calculate)
Data Types Examples Descriptions
LABEL
Name or Wage or
Days
anything that is
just text
CONSTANT 5 or 3.75 or -7.4 any number
FORMULA =5+3 or = 8*5+3 math equation
LABELS
• Labels are text entries
• Labels help identify what we are talking about
• Labels do not have a value associated with them
• Sometimes called ‘headers’
CONSTANTS
• Constants are FIXED
number data
• Constants may refer
to dollars,
percentages, or
number of items (in
this case number of
hours worked within a
certain pay period).
FORMULAS
• Formulas are math equations
that CALCULATE a value to be
displayed.
• DO NOT type in the numbers;
type in the equation.
• It is BEST to Reference as
much data as possible as
opposed to typing data into
equations. That way when
OTHER information changes,
we DO-NOT have to change
the equations or type in
information again.
BASIC FORMULAS &
FUNCTIONS
EXCEL 2010
BASIC MATH FUNCTIONS
• Math functions built into them. Of the most basic
operations are the standard multiply, divide, add and
subtract.
SUM FUNCTION
Definition:
• Probably the most popular
function in any spreadsheet
is the SUM function. The
Sum function takes all of the
values in each of the
specified cells and totals
their values.
• The syntax is: =SUM(first
value, second value, etc)
Tips:
• Blank cells will return a
value of zero to be added
to the total.
• Text cells can not be
added to a number and
will produce an error.
SUM FUNCTION
AVERAGE FUNCTION
• The average function
finds the average of
the specified data.
(Simplifies adding all
of the indicated cells
together and dividing
by the total number of
cells.)
MAX & MIN FUNCTIONS
• The Max function will return the
largest (max) value in the selected
range of cells. The Min function will
display the smallest value in a
selected set of cells.
COUNT FUNCTION
• The Count function will return the number of entries
(actually counts each cell that contains NUMBER
DATA) in the selected range of cells.
• Remember: cell that are blank or contain text will not
be counted.
IF FUNCTION
Definition:
• The IF function will check
the logical condition of a
statement and return one
value if true and a
different value if false.
• The syntax is:
=IF (condition, value-if-
true, value-if-false)
Tips:
• Until you are used to
writing them, test them
out on multiple cells.
• There are multiple ways
to write an IF statement
to get the same result
IF FUNCTION
• IF Functions are like
programing - they provide
multiple answers based
on certain conditions.
DATA TOOLS
EXCEL 2010
TEXT TO COLUMNS
• Text to Columns – delineate via special characters or
fixed width
REMOVING DUPLICATE VALUES
• Removing duplicate values – check for and delete
specific cells with duplicate values
USEFUL FEATURES
EXCEL 2010
• Show all formulas and the general number
format of cells
• Saves you time because you don’t have to
move the cell pointer to check each formula
one-by-one.
INSTANTLY REVEAL FORMULAS AND GENERAL
NUMBER FORMAT OF ALL CELLS
KEYBOARD SHORT CUT TO
INSTANTLY REVEAL FORMULAS
• To do this, just press
the Ctrl key and the
tilde key at the same
time. The tilde is the
squiggly line that is
directly above the tab
key in the upper left
corner of your
keyboard. To change
your worksheet back to
the normal view, just
press the Ctrl and tilde
keys again.
COMPARING 2 OR MORE EXCEL SPREADSHEETS
SIMULTANEOUSLY
• You can open two instances of
Excel INSTEAD of multiple
files on top of each other in the
same Excel application.
• To do this, simply open Excel
by double clicking the icon on
your desktop and open the first
Excel file you want to use.
Minimize this window and
move it to the right screen.
Then go back to the desktop,
double click the Excel icon
once more, another separate
Excel window will open.
SORTING
• Arranging data so it’s easy to analyze
• You can sort the data alphabetically, from highest to
lowest, or by a number of additional criteria (such as cell
color)
FILTERS
• The Filter is a quick and easy way to find and work with
a subset of data in a range of cells.
TABLES
• To make managing and analyzing a group of related data
easier, you can turn a range of cells into a Microsoft
Office Excel table (previously known as an Excel list). A
table typically contains related data in a series of
worksheet rows and columns that have been formatted
as a table. By using the table features, you can then
manage the data in the table rows and columns
independently from the data in other rows and columns
on the worksheet.
ELEMENTS OF AN EXCEL TABLE
• Header row By default, a table has a header row.
Every table column has filtering enabled in the header
row so that you can filter or sort your table data quickly.
ELEMENTS OF AN EXCEL TABLE
• Total row You can add
a total row to your table
that provides access to
summary functions (such
as the AVERAGE,
COUNT, or SUM
function). A drop-down list
appears in each total row
cell so that you can
quickly calculate the totals
that you want.
CREATING A TABLE
PIVOT TABLE
• A Pivot table lets your arrange, sort, and filter a set of
data on the fly so you can analyze it from different
perspectives with minimum effort.
• Start with a data list with a few columns
• Make sure each of the rows have a value of each one of the
columns
USE OF SPREADSHEET
• Spreadsheet software is very versatile and can be used
for both very simple and very complete tasks. Lists such
as vocabulary, project can be easily composed in a
spreadsheet.
• Adding or deleting items from a list like is also simple.
• It is also used in management of more complex data
such has earnings, expenses,budget and other
accounting.
• Spreadsheet program used to colcutate complicated
maths includs from basic + and – to %,taxes and
multisteps program.
CONT….
• Spreadsheet is essential for business, self employed
individuals.
• Spreadsheet programs also include software that creats
graphs and charts from the data provided within the
table.
• This is good for presentation such as business meeting
and research projects.
THANK YOU

More Related Content

PDF
Introduction to spreadsheets
PPTX
Spreadsheet basics ppt
PPT
Introduction to Spreadsheets.ppt
PPTX
Introduction to MS excel
PPT
Spread sheet tools presentation
PPT
MS EXCEL.ppt
PPT
Excel Lecture Notes.ppt
PPTX
MS Excel 2013
Introduction to spreadsheets
Spreadsheet basics ppt
Introduction to Spreadsheets.ppt
Introduction to MS excel
Spread sheet tools presentation
MS EXCEL.ppt
Excel Lecture Notes.ppt
MS Excel 2013

What's hot (20)

PPTX
Microsoft word
PPTX
Introduction to computers
PPT
Introduction to Excel
PPTX
Introduction to MS Word
PPT
Microsoft word basics ppt
PPTX
ODP
MS Word Basics
PPTX
Microsoft Word
PPTX
Word processing
PPTX
Types of computer
PPT
Word processing
PPTX
Introduction to ms office
PPTX
PPTX
Ms office introduction
PPTX
Ms excel ppt
PPTX
Input and output devices
PPTX
PPTX
PPTX
MS Excel Basics
Microsoft word
Introduction to computers
Introduction to Excel
Introduction to MS Word
Microsoft word basics ppt
MS Word Basics
Microsoft Word
Word processing
Types of computer
Word processing
Introduction to ms office
Ms office introduction
Ms excel ppt
Input and output devices
MS Excel Basics
Ad

Viewers also liked (20)

PPTX
Ako pracovať s nástrojom „piktochart
PPTX
Q3 evaluation
PDF
PDF
Presentació de la nostra web a les Jornades TAC
PPTX
Soal dan bahasan Pascal
PDF
Etude facebook-content-marketing-insights-
PPTX
3Com 1720-610-777-1.00
PDF
Let’s swap our european recipe
DOCX
IMPORTANCIA DEL SUDEBAN
PPTX
Estrategias para una industria diversificada
PPTX
Wikipedia
PPTX
Storyboard
PDF
Jugendphänomene im Sprachunterricht nutzen
PPSX
Mechanical Testing of Materials
PDF
Agenda Arquidiocesana Nª 322
PDF
The Power of All-Way Brand Alignment
PPTX
Spreadsheet Errors
PPTX
10 Business Lessons you can learn from The Hunger Games
PPTX
Graphs presentation
PPT
Excel spread sheets and graphs pp
Ako pracovať s nástrojom „piktochart
Q3 evaluation
Presentació de la nostra web a les Jornades TAC
Soal dan bahasan Pascal
Etude facebook-content-marketing-insights-
3Com 1720-610-777-1.00
Let’s swap our european recipe
IMPORTANCIA DEL SUDEBAN
Estrategias para una industria diversificada
Wikipedia
Storyboard
Jugendphänomene im Sprachunterricht nutzen
Mechanical Testing of Materials
Agenda Arquidiocesana Nª 322
The Power of All-Way Brand Alignment
Spreadsheet Errors
10 Business Lessons you can learn from The Hunger Games
Graphs presentation
Excel spread sheets and graphs pp
Ad

Similar to 'Spreadsheet' (20)

PPTX
An introduction to spreadsheet application.pptx
PPTX
Excel
PPTX
Data Visualisation using Spreadsheet.pptx
PPTX
ch 9, Electronic Spreadsheet,Basic Information Technology-Uzair Javed
PPTX
PDF
Tutorial Excel how to work with excel Tutorial Excel how to work with excel
PPTX
MS excel and their functions keys and their usage
PPTX
Spreadsheet note on data processing for anyone
PDF
ITB - UNIT 4.pdf
PDF
Getting Started with Microsoft Excel PPT.pdf
PPTX
Microsoft Excel Core Points Training.pptx
PPTX
ADVANCED SPREADSHEET SKILLS ETECH I.pptx
PPTX
UNIT 1 (3).pptx....................................
PPTX
IPT Preliminary Spreadsheets
PDF
Excel notes by satish kumar avunoori
PPTX
Lesson 6.pptx
PPT
Microsoft Excel Training
PDF
Microsoft Excel- basics
PPTX
LESSON-4-HOW-DO-I-USE-ADVANCED-EXCEL-TOOLS-TO-PROCESS-AND-PRESENTDATA.pptx
PPTX
UNIT 1-Introduction to Data Science.pptx
An introduction to spreadsheet application.pptx
Excel
Data Visualisation using Spreadsheet.pptx
ch 9, Electronic Spreadsheet,Basic Information Technology-Uzair Javed
Tutorial Excel how to work with excel Tutorial Excel how to work with excel
MS excel and their functions keys and their usage
Spreadsheet note on data processing for anyone
ITB - UNIT 4.pdf
Getting Started with Microsoft Excel PPT.pdf
Microsoft Excel Core Points Training.pptx
ADVANCED SPREADSHEET SKILLS ETECH I.pptx
UNIT 1 (3).pptx....................................
IPT Preliminary Spreadsheets
Excel notes by satish kumar avunoori
Lesson 6.pptx
Microsoft Excel Training
Microsoft Excel- basics
LESSON-4-HOW-DO-I-USE-ADVANCED-EXCEL-TOOLS-TO-PROCESS-AND-PRESENTDATA.pptx
UNIT 1-Introduction to Data Science.pptx

Recently uploaded (20)

PDF
Abdominal Access Techniques with Prof. Dr. R K Mishra
PPTX
BOWEL ELIMINATION FACTORS AFFECTING AND TYPES
PDF
O7-L3 Supply Chain Operations - ICLT Program
PPTX
Introduction_to_Human_Anatomy_and_Physiology_for_B.Pharm.pptx
PPTX
Microbial diseases, their pathogenesis and prophylaxis
PDF
Module 4: Burden of Disease Tutorial Slides S2 2025
PPTX
Pharma ospi slides which help in ospi learning
PDF
FourierSeries-QuestionsWithAnswers(Part-A).pdf
PDF
3rd Neelam Sanjeevareddy Memorial Lecture.pdf
PDF
Microbial disease of the cardiovascular and lymphatic systems
PPTX
master seminar digital applications in india
PPTX
school management -TNTEU- B.Ed., Semester II Unit 1.pptx
PDF
VCE English Exam - Section C Student Revision Booklet
PPTX
human mycosis Human fungal infections are called human mycosis..pptx
PDF
Supply Chain Operations Speaking Notes -ICLT Program
PDF
01-Introduction-to-Information-Management.pdf
PPTX
Pharmacology of Heart Failure /Pharmacotherapy of CHF
PDF
Mark Klimek Lecture Notes_240423 revision books _173037.pdf
PPTX
PPT- ENG7_QUARTER1_LESSON1_WEEK1. IMAGERY -DESCRIPTIONS pptx.pptx
PPTX
Cell Structure & Organelles in detailed.
Abdominal Access Techniques with Prof. Dr. R K Mishra
BOWEL ELIMINATION FACTORS AFFECTING AND TYPES
O7-L3 Supply Chain Operations - ICLT Program
Introduction_to_Human_Anatomy_and_Physiology_for_B.Pharm.pptx
Microbial diseases, their pathogenesis and prophylaxis
Module 4: Burden of Disease Tutorial Slides S2 2025
Pharma ospi slides which help in ospi learning
FourierSeries-QuestionsWithAnswers(Part-A).pdf
3rd Neelam Sanjeevareddy Memorial Lecture.pdf
Microbial disease of the cardiovascular and lymphatic systems
master seminar digital applications in india
school management -TNTEU- B.Ed., Semester II Unit 1.pptx
VCE English Exam - Section C Student Revision Booklet
human mycosis Human fungal infections are called human mycosis..pptx
Supply Chain Operations Speaking Notes -ICLT Program
01-Introduction-to-Information-Management.pdf
Pharmacology of Heart Failure /Pharmacotherapy of CHF
Mark Klimek Lecture Notes_240423 revision books _173037.pdf
PPT- ENG7_QUARTER1_LESSON1_WEEK1. IMAGERY -DESCRIPTIONS pptx.pptx
Cell Structure & Organelles in detailed.

'Spreadsheet'

  • 1. UNIVERSITY OF MYSORE SUBJECT: Fundamentals of Information Technology SEMINOR ON : Spreadsheet presented by, Rashmi N. DOS in LIS Manasagangotri Mysuru
  • 2. CONTENTS • Introduction • Basics of spread sheet • Types of data • Formulas and function • Tools • Useful features • Uses of spread sheet
  • 3. INTRODUCTION A spread sheet is a software that permits numerical data to be used and to perform automatic calculation on numbers contained in a table. Numerous spread sheets have been produced by the main software companies. The main spread sheets are; Microsoft excel, in the microsoft office suite Sun star office calc. Open calc. IBM
  • 4. . In addition ,spread sheet can also easily produce graphic representation of the data entered. Histograms Curves Sector charts micro soft excel has initial release in sept.30 1985 ; 30 years ago
  • 5. . Microsoft excel is a spreadsheet developed by Microsoft for windows, Android. It features calculation, graphing tools, pivot tables, and a macro programming language called visual basic for applications. it has been a very widely applied spreadsheet for these platforms, especially since version 5 in 1993, and it has replaced lotus 1-2-3 as the industry standard for spreadsheets. Excel is a part of microsoft office.
  • 6. . • Excel is a spreadsheet, a grid made from columns and rows. It is a software program that can make number manipulation easy and somewhat painless. • The nice thing about using a computer and spreadsheet is that you can experiment with numbers without having to RE-DO all the calculations.
  • 7. BASICS OF A SPREADSHEET • Spreadsheets are made up of • Columns • Rows • and their intersections are called cells
  • 8. WHAT IS A COLUMN ? • In a spreadsheet the COLUMN is defined as the vertical space that is going up and down the window. Letters are used to designate each COLUMN'S location. • COLUMN labeled D is highlighted.
  • 9. WHAT IS A ROW? • In a spreadsheet the ROW is defined as the horizontal space that is going across the window. Numbers are used to designate each ROW'S location. • ROW labeled 4 is highlighted.
  • 10. WHAT IS A CELL ? • A CELL is the space where a row and column intersect. Each CELL is assigned a name according to its COLUMN letter and ROW number. • In the above diagram the CELL labeled C2 is highlighted.
  • 11. NUMBER OF ROWS AND COLUMNS • Version of excel up to 7.0 (16384 rows ) • Version of excel 8.0-11.0 (65536 rows and 256columns). • Version of excel 12.0(1048576 rows and 16384 columns
  • 12. TYPES OF DATA • In each cell there may be the following data types: • Labels -- (text with no numerical value) • Number data (constant values) • Formulas (mathematical equation used to calculate) Data Types Examples Descriptions LABEL Name or Wage or Days anything that is just text CONSTANT 5 or 3.75 or -7.4 any number FORMULA =5+3 or = 8*5+3 math equation
  • 13. LABELS • Labels are text entries • Labels help identify what we are talking about • Labels do not have a value associated with them • Sometimes called ‘headers’
  • 14. CONSTANTS • Constants are FIXED number data • Constants may refer to dollars, percentages, or number of items (in this case number of hours worked within a certain pay period).
  • 15. FORMULAS • Formulas are math equations that CALCULATE a value to be displayed. • DO NOT type in the numbers; type in the equation. • It is BEST to Reference as much data as possible as opposed to typing data into equations. That way when OTHER information changes, we DO-NOT have to change the equations or type in information again.
  • 17. BASIC MATH FUNCTIONS • Math functions built into them. Of the most basic operations are the standard multiply, divide, add and subtract.
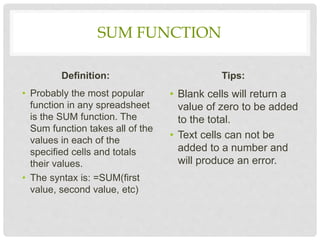
  • 18. SUM FUNCTION Definition: • Probably the most popular function in any spreadsheet is the SUM function. The Sum function takes all of the values in each of the specified cells and totals their values. • The syntax is: =SUM(first value, second value, etc) Tips: • Blank cells will return a value of zero to be added to the total. • Text cells can not be added to a number and will produce an error.
  • 20. AVERAGE FUNCTION • The average function finds the average of the specified data. (Simplifies adding all of the indicated cells together and dividing by the total number of cells.)
  • 21. MAX & MIN FUNCTIONS • The Max function will return the largest (max) value in the selected range of cells. The Min function will display the smallest value in a selected set of cells.
  • 22. COUNT FUNCTION • The Count function will return the number of entries (actually counts each cell that contains NUMBER DATA) in the selected range of cells. • Remember: cell that are blank or contain text will not be counted.
  • 23. IF FUNCTION Definition: • The IF function will check the logical condition of a statement and return one value if true and a different value if false. • The syntax is: =IF (condition, value-if- true, value-if-false) Tips: • Until you are used to writing them, test them out on multiple cells. • There are multiple ways to write an IF statement to get the same result
  • 24. IF FUNCTION • IF Functions are like programing - they provide multiple answers based on certain conditions.
  • 26. TEXT TO COLUMNS • Text to Columns – delineate via special characters or fixed width
  • 27. REMOVING DUPLICATE VALUES • Removing duplicate values – check for and delete specific cells with duplicate values
  • 29. • Show all formulas and the general number format of cells • Saves you time because you don’t have to move the cell pointer to check each formula one-by-one. INSTANTLY REVEAL FORMULAS AND GENERAL NUMBER FORMAT OF ALL CELLS
  • 30. KEYBOARD SHORT CUT TO INSTANTLY REVEAL FORMULAS • To do this, just press the Ctrl key and the tilde key at the same time. The tilde is the squiggly line that is directly above the tab key in the upper left corner of your keyboard. To change your worksheet back to the normal view, just press the Ctrl and tilde keys again.
  • 31. COMPARING 2 OR MORE EXCEL SPREADSHEETS SIMULTANEOUSLY • You can open two instances of Excel INSTEAD of multiple files on top of each other in the same Excel application. • To do this, simply open Excel by double clicking the icon on your desktop and open the first Excel file you want to use. Minimize this window and move it to the right screen. Then go back to the desktop, double click the Excel icon once more, another separate Excel window will open.
  • 32. SORTING • Arranging data so it’s easy to analyze • You can sort the data alphabetically, from highest to lowest, or by a number of additional criteria (such as cell color)
  • 33. FILTERS • The Filter is a quick and easy way to find and work with a subset of data in a range of cells.
  • 34. TABLES • To make managing and analyzing a group of related data easier, you can turn a range of cells into a Microsoft Office Excel table (previously known as an Excel list). A table typically contains related data in a series of worksheet rows and columns that have been formatted as a table. By using the table features, you can then manage the data in the table rows and columns independently from the data in other rows and columns on the worksheet.
  • 35. ELEMENTS OF AN EXCEL TABLE • Header row By default, a table has a header row. Every table column has filtering enabled in the header row so that you can filter or sort your table data quickly.
  • 36. ELEMENTS OF AN EXCEL TABLE • Total row You can add a total row to your table that provides access to summary functions (such as the AVERAGE, COUNT, or SUM function). A drop-down list appears in each total row cell so that you can quickly calculate the totals that you want.
  • 38. PIVOT TABLE • A Pivot table lets your arrange, sort, and filter a set of data on the fly so you can analyze it from different perspectives with minimum effort. • Start with a data list with a few columns • Make sure each of the rows have a value of each one of the columns
  • 39. USE OF SPREADSHEET • Spreadsheet software is very versatile and can be used for both very simple and very complete tasks. Lists such as vocabulary, project can be easily composed in a spreadsheet. • Adding or deleting items from a list like is also simple. • It is also used in management of more complex data such has earnings, expenses,budget and other accounting. • Spreadsheet program used to colcutate complicated maths includs from basic + and – to %,taxes and multisteps program.
  • 40. CONT…. • Spreadsheet is essential for business, self employed individuals. • Spreadsheet programs also include software that creats graphs and charts from the data provided within the table. • This is good for presentation such as business meeting and research projects.

Editor's Notes

  • #7: Source: http://people.usd.edu/~bwjames/tut/excel/1.html
  • #24: IF Functions are like programing, THEY provide multiple answers based on certain conditions. Until you are used to writing them, test them out on multiple cells. There are multiple ways to write an IF statement to get the same result