SlideShare a Scribd company logo
2
Most read
3
Most read
4
Most read
X Chapter 1 Problem Solving and Algorithm Designing.pdf
CHAPTER # 01
PROBLEM SOLVING AND ALGORITHM DESIGNING
Q1.Define Problem and Problem Solving. Describe the steps involved in problem solving.
PROBLEM:
A problem is a situation preventing something from being achieved.
PROBLEM SOLVING:
Problem-solving is the sequential process of analyzing information related to a given situation and
generating appropriate response options.
STEPS INVOLVED IN PROBLEM SOLVING:
There are four basics steps involved in finding a solution for a problem as given below:
⚫ Define the problem
⚫ Generate alternative solutions
⚫ Evaluate and select an alternative
⚫ Implement and follow up on the solution
⚫ DEFINE THE PROBLEM:
Determining what you already know (input: provided data) and what you wish to get (output:
the outcome) defines the work of problem definition. Understanding the problem as explained during
this step is crucial.
⚫ GENERATE ALTERNATIVE SOLUTIONS:
To get the desired results, many different solutions to the problem should be developed.
Multiple alternatives can improve the value of the ideal solution. To determine which solution is best
for a given issue, it is wise to compile a list of all potential options.
⚫ EVALUATE AND SELECT AN ALTERNATIVE:
When choosing the optimal option, a good problem-solving method uses several factors. The
best option will be chosen after evaluating all potential solutions to the goal standard. Without
creating additional unexpected issues, a specific solution will fix the issue.
⚫ IMPLEMENT AND FOLLOW UP ON THE SOLUTION:
Planning for what will happen if something goes wrong with the chosen solution is part of
implementing the optimal solution. At every level of implementation, it's crucial to monitor the
progress of the solution and its effects.
Q2.What are the advantages of developing algorithms?
ADVANTAGES OF DEVELOPING ALGORITHMS:
There are many advantages of developing an algorithm which is listed below:
⚫ Easy To Understand:
It is easy to understand.
⚫ Step-Wise Representation:
An algorithm is a step-wise representation of a solution to a given problem.
⚫ Break Down The Problem:
In an Algorithm, the problem is broken down into smaller pieces or steps hence, it is easier
for the programmer to convert it into an actual program.
Q3.List any three advantages of designing flowcharts.
ADVANTAGES OF DESIGNING FLOWCHARTS: There are many advantages of designing flowcharts
which are listed below:
⚫ Better Way Of Communication: Flowcharts are a better way of communicating the logic of the
system.
⚫ Guide For Blueprint: Flowcharts act as a guide for blueprint during program design.
⚫ Debugging Process: Flowcharts help in the debugging process.
⚫ Easily Analyze: With the help of flowcharts programs can be easily analyzed.
⚫ Provides Better Documentation: It provides better documentation.
Q4.What is the difference between tree and graph data structure?
PARAMETERS TREE GRAPH
Definition A data structure that simulates a
hierarchical tree structure, with a root
value and sub-trees of children with a
parent node.
A data structure that consists of a group
or vertices connected through edges.
Root Node There is a unique node called the
root(parent) node in trees.
There is no unique node called root in
the graph.
Types of Edges They are always directed. They can be directed or undirected.
Loop Formation There are no 1oops. There can be loops.
Representation Represents data in the form of a tree
structure in a hierarchical manner.
Represents data similar to a network.
Q5.What is the difference between queue and stack data structures?
PARAMETERS QUEUE STACK
Definition A linear data structure with an ordered
collection of elements that are inserted
and deleted from the same end is called
a top.
A linear data structure with an ordered
collection of elements that are inserted
at one end called the rear and deleted
from the other end called the front.
Structure Same end is used to insert and delete. Elements that are inserted at one end
are called rear and deleted from the
other end called front.
Working Principle It works on the LIFO principle. It works on the FIFO principle.
Real-Life
Examples
The ticket queue outside a cinema
hall is a real-world example of a queue.
Real-life examples of a stack are a deck
of cards, piles of books, piles of money,
and many more.
Q6.What is the need for the index of an array?
NEED OF INDEX IN AN ARRAY: An element's position inside the array is indicated by its index,
which can either be a number or a field with a number (beginning at 1). When you give an array name
and index, the following guidelines apply: The name of the array must be a distinct symbolic name.
Q7.With the help of a sketch. define Push, Pop, Overflow and Enqueue, Dequeue.
PUSH: The term push is used to insert a new element into the stack.
POP: The pop is used to remove an element from the stack.
OVERFLOW: The stack is in an overflow state when it is full and we cannot add an item in it.
ENQUEUE: The process to add an element into a queue is called enqueue.
DEQUEUE: The process to delete an element into a queue is called dequeue.
Q8.Define algorithm.
ALGORITHM: An algorithm is a finite sequence of well-defined computer implementable instructions. It
is the instance of logic written in software by software developers to produce output. OR An algorithm is
simply a set of steps used to complete a specific task. They are the building blocks for programming.
Q9.Define the flowchart. Identify the different symbols used in flowchart designing.
FLOWCHART: A flowchart is the physical representation of problem solving process. It is used to show
the sequence of steps and logic of solution for a problem, before writing the full computer
program. OR Flowchart is a type of diagram that represents a workflow or process. Flowcharts are used in
analyzing, designing, documenting, or managing a process/program in various fields.
FLOWCHARTS SYMBOLS: A flowchart is made up of different symbols to represent or show the
program and its flow. Some of them are as follows:
Start/Stop: It is an oval shape and is used to show the start and end of a
program or a flowchart.
Arrows: The arrow shape shows the direction of flow from one step or box to
another.
Process: This rectangular shape indicates any type of internal operation or process
usually one step. The step is written inside the box. Only one arrow goes out of the
box.
Input/Output: This parallelogram shape shows the input or output process. This
is used for any Input/Output (I/O) operation and indicates that the computer is to
obtain data or output results.
Decision/Condition: This diamond shape shows a decision based on a condition
written in the diamond. Two arrows go out of the diamond. One directs toward the
path if the condition is true and the other for false. We can also use yes/no in place of
true/false.
Q10. Define the data structure. Why is data structure important?
DATA STRUCTURE: A data structure is a particular way of organizing data in a computer to use it
effectively. OR A data structure is a storage that is used to store and organize data. It is a way of arranging
data on a computer so that it can be accessed and updated efficiently.
IMPORTANCE OF DATA STRUCTURE: The importance of data structure is:
Efficient: The efficiency of a program depends upon the choice of data structures.
Reusability: Data structures are reusable, once we have implemented a particular data structure, we can use
it in any other place.
Abstraction: Data structures provide a level of abstraction. The client program uses the data structures,
through interfaces only, without getting into detail.
Q11. Describe the main types of data structure with examples.
TYPES OF DATA STRUCTURE: Mainly data structure classify into two types which are:
⚫ Linear data structure
⚫ Non-linear data structure
⚫ Linear Data Structure: A data structure in which data elements are arranged sequentially or linearly,
where each element is attached to its previous and next adjacent elements, is called a linear data
structure.
Examples: Examples of linear data structures are array, stack, queue, linked list, etc.
⚫ Non-Linear Data Structure: Data structures where data elements are not placed sequentially or
linearly are called non-linear data structures. In a non-linear data structure, we can’t traverse all the
elements in a single run only.
Examples: Examples of non-linear data structures are trees and graphs.
Q12. Define linear data structure types.
TYPES OF LINEAR DATA STRUCTURES: Linear data structures are stack, queue, array, etc.
⚫ STACK: Stack is a linear data structure in which insertion and deletion are allowed only at one end i.e.
at the top of the stack. The order may be LIFO(Last In First Out) or FILO(First In Last Out).
Example: Examples of stacks are plates that are stacked or put over one another in the canteen.
⚫ QUEUE: A Queue is defined as a linear data structure that is open at both ends and the operations are
performed in First In First Out (FIFO) order.
Example: An example of a queue is any queue of students in school or people in a cinema.
⚫ ARRAY: An array is a linear data structure that collects elements of the same data type and stores them
in contiguous and adjacent memory locations.
◼ Elements: Each item stored in an array is called an element.
◼ Index: Each location of an element in an array has a numerical value called index, which is used to
identify the element.
Example: If we wish to store the contacts on our phone, then the software will simply place all our
contacts in an array.
Q13. Define non-linear data structure types.
TYPES OF NON-LINEAR DATA STRUCTURES: Non-linear data structures are trees and graphs
⚫ TREES: Tree non-linear data structure is used to represent data containing a hierarchical relationship
between elements.
Example: A family tree with relationships from all generations: grandparents, parents, children, siblings,
etc.
⚫ GRAPH: A Graph is a non-linear data structure consisting (finite set) of data elements called
nodes/vertices and edges that are lines that connect any two nodes in that graph.
◼ Undirected Graphs: A graph in which edges have no direction, i.e., the edges do not have arrows
indicating the direction of traversal.
Example: A social network graph where friendships are not directional.
◼ Directed Graphs: A graph in which edges have a direction, i.e., the edges have arrows indicating
the direction of traversal.
Example: A web page graph where links between pages are directional.
Q14. Write the difference between the algorithm and the flowchart.
PARAMETERS ALGORITHM FLOWCHART
Definition An algorithm is simply a set of steps
used to complete a specific task.
A flowchart is the physical
representation of problem solving
process.
Debugging An algorithm is easy to debug. A flowchart is difficult to debug.
Implementation The algorithm does not follow any
rules.
Flowchart follows rules for its
construction.
Solution In an algorithm, the solution is
presented in non computer language.
In a flowchart, the solution is
represented in a graphical format.
Complexity An algorithm is difficult to write and
understand.
A flowchart is easy to construct
and understand.
Q15. Draw a flowchart and design an algorithm to calculate the sum of two numbers.
ALGORITHM:
1. Start
2. Declare variable num1, num2 and sum.
3. Read values num1 and num2.
4. Add num1 and num2 and assign the result to the sum. Sum = num1+num2
5. Display sum
6. Stop
FLOWCHART:

More Related Content

PPTX
Data Structures and Algorithm - Module 1.pptx
PDF
Unit I Data structure and algorithms notes
PPTX
data structures module I & II.pptx
PPTX
Data_structures_and_algorithm_Lec_1.pptx
PPTX
Data_structures_and_algorithm_Lec_1.pptx
PDF
Chapter 1 Introduction to Data Structures and Algorithms.pdf
PPTX
8.unit-1-fds-2022-23.pptx
DOCX
Data structure and algorithm.
Data Structures and Algorithm - Module 1.pptx
Unit I Data structure and algorithms notes
data structures module I & II.pptx
Data_structures_and_algorithm_Lec_1.pptx
Chapter 1 Introduction to Data Structures and Algorithms.pdf
8.unit-1-fds-2022-23.pptx
Data structure and algorithm.

Similar to X Chapter 1 Problem Solving and Algorithm Designing.pdf (20)

PPTX
Introduction to data structures and its types
PPTX
Chapter 1 _edited.pptx.software engineering
PPTX
Chapter 1 _edited.pptx.software engineering
PPTX
EE-232-LEC-01 Data_structures.pptx
PPTX
DS Module 1.pptx
PPT
Introduction of C++ Text book UNIT-1 .ppt
PPTX
Data Structure.pptx
DOCX
Data Structure Notes unit 1.docx
PPTX
1.Introduction to Data Structures and Algorithms.pptx
PDF
Lec01-Algorithems - Introduction and Overview.pdf
PDF
PPTX
datastructuresandalgorithm-module1-230307012644-4c895c84.pptx
PPT
intr_ds.ppt
PDF
Unit-I PPT hususi sisooshsgv. Eijeieieooekejj
PPT
Ch 1 intriductions
PDF
Astu DSA week 1-2.pdf
PPTX
RAJAT PROJECT.pptx
PPT
Lecture 1 - Overview of Data Structure .ppt
PPTX
Lecture 01 Intro to DSA
PPT
Data structures
Introduction to data structures and its types
Chapter 1 _edited.pptx.software engineering
EE-232-LEC-01 Data_structures.pptx
DS Module 1.pptx
Introduction of C++ Text book UNIT-1 .ppt
Data Structure.pptx
Data Structure Notes unit 1.docx
1.Introduction to Data Structures and Algorithms.pptx
Lec01-Algorithems - Introduction and Overview.pdf
datastructuresandalgorithm-module1-230307012644-4c895c84.pptx
intr_ds.ppt
Unit-I PPT hususi sisooshsgv. Eijeieieooekejj
Ch 1 intriductions
Astu DSA week 1-2.pdf
RAJAT PROJECT.pptx
Lecture 1 - Overview of Data Structure .ppt
Lecture 01 Intro to DSA
Data structures
Ad

More from Amna Nawazish (17)

PDF
Complete CHAPTER 3 Data Communication.pdf
PDF
CHAPTER 3 Data Communication.pdf
PDF
MOTION & MANIPULIATION IN ARTIFICIAL INTELLIGENCE.pdf
PDF
ELEMENT COMPOUND & MIXTURES ELEMENT
PDF
Short note Lahore Resolution or Pakistan Resolution 1940, Delhi Proposal 1929...
DOCX
Life of Ali Ibn Talib
PDF
Routing
PDF
Routing Information Protocol (RIP)
PDF
Routing Information Protocol(RIP)
PDF
External memory
PPTX
Pros & Cons of globalization
DOCX
Online doctor appointment
DOCX
Calculator code with scientific functions in java
PPTX
Term report about igloo ice cream
DOCX
Controlling & Motivation
DOCX
Mind Mapping of Management
PPTX
Memo writing
Complete CHAPTER 3 Data Communication.pdf
CHAPTER 3 Data Communication.pdf
MOTION & MANIPULIATION IN ARTIFICIAL INTELLIGENCE.pdf
ELEMENT COMPOUND & MIXTURES ELEMENT
Short note Lahore Resolution or Pakistan Resolution 1940, Delhi Proposal 1929...
Life of Ali Ibn Talib
Routing
Routing Information Protocol (RIP)
Routing Information Protocol(RIP)
External memory
Pros & Cons of globalization
Online doctor appointment
Calculator code with scientific functions in java
Term report about igloo ice cream
Controlling & Motivation
Mind Mapping of Management
Memo writing
Ad

Recently uploaded (20)

PPTX
VMware vSphere Foundation How to Sell Presentation-Ver1.4-2-14-2024.pptx
PPTX
Digital-Transformation-Roadmap-for-Companies.pptx
PDF
Spectral efficient network and resource selection model in 5G networks
PPTX
Programs and apps: productivity, graphics, security and other tools
PPTX
Big Data Technologies - Introduction.pptx
PDF
Building Integrated photovoltaic BIPV_UPV.pdf
PDF
cuic standard and advanced reporting.pdf
PDF
7 ChatGPT Prompts to Help You Define Your Ideal Customer Profile.pdf
PPTX
sap open course for s4hana steps from ECC to s4
PPTX
MYSQL Presentation for SQL database connectivity
PDF
The Rise and Fall of 3GPP – Time for a Sabbatical?
DOCX
The AUB Centre for AI in Media Proposal.docx
PDF
Network Security Unit 5.pdf for BCA BBA.
PDF
Build a system with the filesystem maintained by OSTree @ COSCUP 2025
PDF
Optimiser vos workloads AI/ML sur Amazon EC2 et AWS Graviton
PPT
Teaching material agriculture food technology
PPTX
ACSFv1EN-58255 AWS Academy Cloud Security Foundations.pptx
PDF
Approach and Philosophy of On baking technology
PDF
MIND Revenue Release Quarter 2 2025 Press Release
PDF
Unlocking AI with Model Context Protocol (MCP)
VMware vSphere Foundation How to Sell Presentation-Ver1.4-2-14-2024.pptx
Digital-Transformation-Roadmap-for-Companies.pptx
Spectral efficient network and resource selection model in 5G networks
Programs and apps: productivity, graphics, security and other tools
Big Data Technologies - Introduction.pptx
Building Integrated photovoltaic BIPV_UPV.pdf
cuic standard and advanced reporting.pdf
7 ChatGPT Prompts to Help You Define Your Ideal Customer Profile.pdf
sap open course for s4hana steps from ECC to s4
MYSQL Presentation for SQL database connectivity
The Rise and Fall of 3GPP – Time for a Sabbatical?
The AUB Centre for AI in Media Proposal.docx
Network Security Unit 5.pdf for BCA BBA.
Build a system with the filesystem maintained by OSTree @ COSCUP 2025
Optimiser vos workloads AI/ML sur Amazon EC2 et AWS Graviton
Teaching material agriculture food technology
ACSFv1EN-58255 AWS Academy Cloud Security Foundations.pptx
Approach and Philosophy of On baking technology
MIND Revenue Release Quarter 2 2025 Press Release
Unlocking AI with Model Context Protocol (MCP)

X Chapter 1 Problem Solving and Algorithm Designing.pdf

  • 2. CHAPTER # 01 PROBLEM SOLVING AND ALGORITHM DESIGNING Q1.Define Problem and Problem Solving. Describe the steps involved in problem solving. PROBLEM: A problem is a situation preventing something from being achieved. PROBLEM SOLVING: Problem-solving is the sequential process of analyzing information related to a given situation and generating appropriate response options. STEPS INVOLVED IN PROBLEM SOLVING: There are four basics steps involved in finding a solution for a problem as given below: ⚫ Define the problem ⚫ Generate alternative solutions ⚫ Evaluate and select an alternative ⚫ Implement and follow up on the solution ⚫ DEFINE THE PROBLEM: Determining what you already know (input: provided data) and what you wish to get (output: the outcome) defines the work of problem definition. Understanding the problem as explained during this step is crucial. ⚫ GENERATE ALTERNATIVE SOLUTIONS: To get the desired results, many different solutions to the problem should be developed. Multiple alternatives can improve the value of the ideal solution. To determine which solution is best for a given issue, it is wise to compile a list of all potential options. ⚫ EVALUATE AND SELECT AN ALTERNATIVE: When choosing the optimal option, a good problem-solving method uses several factors. The best option will be chosen after evaluating all potential solutions to the goal standard. Without creating additional unexpected issues, a specific solution will fix the issue. ⚫ IMPLEMENT AND FOLLOW UP ON THE SOLUTION: Planning for what will happen if something goes wrong with the chosen solution is part of implementing the optimal solution. At every level of implementation, it's crucial to monitor the progress of the solution and its effects. Q2.What are the advantages of developing algorithms? ADVANTAGES OF DEVELOPING ALGORITHMS: There are many advantages of developing an algorithm which is listed below: ⚫ Easy To Understand: It is easy to understand. ⚫ Step-Wise Representation: An algorithm is a step-wise representation of a solution to a given problem. ⚫ Break Down The Problem: In an Algorithm, the problem is broken down into smaller pieces or steps hence, it is easier for the programmer to convert it into an actual program. Q3.List any three advantages of designing flowcharts. ADVANTAGES OF DESIGNING FLOWCHARTS: There are many advantages of designing flowcharts which are listed below: ⚫ Better Way Of Communication: Flowcharts are a better way of communicating the logic of the system. ⚫ Guide For Blueprint: Flowcharts act as a guide for blueprint during program design. ⚫ Debugging Process: Flowcharts help in the debugging process.
  • 3. ⚫ Easily Analyze: With the help of flowcharts programs can be easily analyzed. ⚫ Provides Better Documentation: It provides better documentation. Q4.What is the difference between tree and graph data structure? PARAMETERS TREE GRAPH Definition A data structure that simulates a hierarchical tree structure, with a root value and sub-trees of children with a parent node. A data structure that consists of a group or vertices connected through edges. Root Node There is a unique node called the root(parent) node in trees. There is no unique node called root in the graph. Types of Edges They are always directed. They can be directed or undirected. Loop Formation There are no 1oops. There can be loops. Representation Represents data in the form of a tree structure in a hierarchical manner. Represents data similar to a network. Q5.What is the difference between queue and stack data structures? PARAMETERS QUEUE STACK Definition A linear data structure with an ordered collection of elements that are inserted and deleted from the same end is called a top. A linear data structure with an ordered collection of elements that are inserted at one end called the rear and deleted from the other end called the front. Structure Same end is used to insert and delete. Elements that are inserted at one end are called rear and deleted from the other end called front. Working Principle It works on the LIFO principle. It works on the FIFO principle. Real-Life Examples The ticket queue outside a cinema hall is a real-world example of a queue. Real-life examples of a stack are a deck of cards, piles of books, piles of money, and many more. Q6.What is the need for the index of an array? NEED OF INDEX IN AN ARRAY: An element's position inside the array is indicated by its index, which can either be a number or a field with a number (beginning at 1). When you give an array name and index, the following guidelines apply: The name of the array must be a distinct symbolic name. Q7.With the help of a sketch. define Push, Pop, Overflow and Enqueue, Dequeue. PUSH: The term push is used to insert a new element into the stack. POP: The pop is used to remove an element from the stack. OVERFLOW: The stack is in an overflow state when it is full and we cannot add an item in it. ENQUEUE: The process to add an element into a queue is called enqueue.
  • 4. DEQUEUE: The process to delete an element into a queue is called dequeue. Q8.Define algorithm. ALGORITHM: An algorithm is a finite sequence of well-defined computer implementable instructions. It is the instance of logic written in software by software developers to produce output. OR An algorithm is simply a set of steps used to complete a specific task. They are the building blocks for programming. Q9.Define the flowchart. Identify the different symbols used in flowchart designing. FLOWCHART: A flowchart is the physical representation of problem solving process. It is used to show the sequence of steps and logic of solution for a problem, before writing the full computer program. OR Flowchart is a type of diagram that represents a workflow or process. Flowcharts are used in analyzing, designing, documenting, or managing a process/program in various fields. FLOWCHARTS SYMBOLS: A flowchart is made up of different symbols to represent or show the program and its flow. Some of them are as follows: Start/Stop: It is an oval shape and is used to show the start and end of a program or a flowchart. Arrows: The arrow shape shows the direction of flow from one step or box to another. Process: This rectangular shape indicates any type of internal operation or process usually one step. The step is written inside the box. Only one arrow goes out of the box. Input/Output: This parallelogram shape shows the input or output process. This is used for any Input/Output (I/O) operation and indicates that the computer is to obtain data or output results. Decision/Condition: This diamond shape shows a decision based on a condition written in the diamond. Two arrows go out of the diamond. One directs toward the path if the condition is true and the other for false. We can also use yes/no in place of true/false. Q10. Define the data structure. Why is data structure important? DATA STRUCTURE: A data structure is a particular way of organizing data in a computer to use it effectively. OR A data structure is a storage that is used to store and organize data. It is a way of arranging data on a computer so that it can be accessed and updated efficiently. IMPORTANCE OF DATA STRUCTURE: The importance of data structure is: Efficient: The efficiency of a program depends upon the choice of data structures. Reusability: Data structures are reusable, once we have implemented a particular data structure, we can use it in any other place. Abstraction: Data structures provide a level of abstraction. The client program uses the data structures, through interfaces only, without getting into detail. Q11. Describe the main types of data structure with examples. TYPES OF DATA STRUCTURE: Mainly data structure classify into two types which are: ⚫ Linear data structure
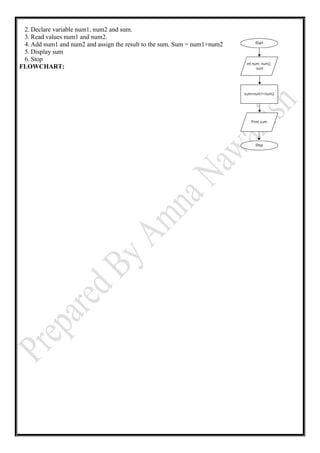
  • 5. ⚫ Non-linear data structure ⚫ Linear Data Structure: A data structure in which data elements are arranged sequentially or linearly, where each element is attached to its previous and next adjacent elements, is called a linear data structure. Examples: Examples of linear data structures are array, stack, queue, linked list, etc. ⚫ Non-Linear Data Structure: Data structures where data elements are not placed sequentially or linearly are called non-linear data structures. In a non-linear data structure, we can’t traverse all the elements in a single run only. Examples: Examples of non-linear data structures are trees and graphs. Q12. Define linear data structure types. TYPES OF LINEAR DATA STRUCTURES: Linear data structures are stack, queue, array, etc. ⚫ STACK: Stack is a linear data structure in which insertion and deletion are allowed only at one end i.e. at the top of the stack. The order may be LIFO(Last In First Out) or FILO(First In Last Out). Example: Examples of stacks are plates that are stacked or put over one another in the canteen. ⚫ QUEUE: A Queue is defined as a linear data structure that is open at both ends and the operations are performed in First In First Out (FIFO) order. Example: An example of a queue is any queue of students in school or people in a cinema. ⚫ ARRAY: An array is a linear data structure that collects elements of the same data type and stores them in contiguous and adjacent memory locations. ◼ Elements: Each item stored in an array is called an element. ◼ Index: Each location of an element in an array has a numerical value called index, which is used to identify the element. Example: If we wish to store the contacts on our phone, then the software will simply place all our contacts in an array. Q13. Define non-linear data structure types. TYPES OF NON-LINEAR DATA STRUCTURES: Non-linear data structures are trees and graphs ⚫ TREES: Tree non-linear data structure is used to represent data containing a hierarchical relationship between elements. Example: A family tree with relationships from all generations: grandparents, parents, children, siblings, etc. ⚫ GRAPH: A Graph is a non-linear data structure consisting (finite set) of data elements called nodes/vertices and edges that are lines that connect any two nodes in that graph. ◼ Undirected Graphs: A graph in which edges have no direction, i.e., the edges do not have arrows indicating the direction of traversal. Example: A social network graph where friendships are not directional. ◼ Directed Graphs: A graph in which edges have a direction, i.e., the edges have arrows indicating the direction of traversal. Example: A web page graph where links between pages are directional. Q14. Write the difference between the algorithm and the flowchart. PARAMETERS ALGORITHM FLOWCHART Definition An algorithm is simply a set of steps used to complete a specific task. A flowchart is the physical representation of problem solving process. Debugging An algorithm is easy to debug. A flowchart is difficult to debug. Implementation The algorithm does not follow any rules. Flowchart follows rules for its construction. Solution In an algorithm, the solution is presented in non computer language. In a flowchart, the solution is represented in a graphical format. Complexity An algorithm is difficult to write and understand. A flowchart is easy to construct and understand. Q15. Draw a flowchart and design an algorithm to calculate the sum of two numbers. ALGORITHM: 1. Start
  • 6. 2. Declare variable num1, num2 and sum. 3. Read values num1 and num2. 4. Add num1 and num2 and assign the result to the sum. Sum = num1+num2 5. Display sum 6. Stop FLOWCHART: