GeoScript - Spatial Capabilities for Scripting Languages
Download as PPT, PDF5 likes2,152 views

This document summarizes GeoScript, an open source library that provides spatial capabilities for scripting languages like Groovy, JavaScript, Python, Scala, and others. GeoScript allows users to work with geospatial data and perform operations like geometry processing, styling, projections, and data access in a scripting language of their choice. It builds on the GeoTools library but aims to be easier to use for rapid script development. The document outlines GeoScript modules for geometry, projections, data access layers, styling, and includes code examples in various languages.


![Geometry >>> import geoscript.geom.* >>> line = new LineString([[111.0, -47], [123.0, -48], [110.0, -47]]) LINESTRING (111 -47, 123 -48, 110 -47)](https://image.slidesharecdn.com/geoscript-111003092956-phpapp01/85/GeoScript-Spatial-Capabilities-for-Scripting-Languages-12-320.jpg)
![Geometry js> var poly = geom.Point([10, 30]). > buffer(5) js> poly <Polygon [[[15, 30], [14.90...> js> poly.area 78.03612880645133](https://image.slidesharecdn.com/geoscript-111003092956-phpapp01/85/GeoScript-Spatial-Capabilities-for-Scripting-Languages-13-320.jpg)


![Geometry - I/O js> var geom = require("geoscript/geom"); js> var point = geom.Point([1, 2]) js> point.json {"type":"Point","coordinates":[1,2]}](https://image.slidesharecdn.com/geoscript-111003092956-phpapp01/85/GeoScript-Spatial-Capabilities-for-Scripting-Languages-16-320.jpg)
![Geometry - Visualization >>> from geoscript.render import plot >>> from geoscript import geom >>> poly = geom.Polygon([(35,10), (10,20), (15,40), (45,45), (35,10)], [(20,30), (35,35), (30,20), (20,30)]) >>> plot(poly)](https://image.slidesharecdn.com/geoscript-111003092956-phpapp01/85/GeoScript-Spatial-Capabilities-for-Scripting-Languages-17-320.jpg)
![Geometry - Visualization js> var geom = require("geoscript/geom") js> require("geoscript/viewer").bind() js> var poly1 = geom.Point([0, 0]).buffer(1) js> var poly2 = poly1.transform({dx: 0.5, dy: 0.5}) js> poly1.difference(poly2) <Polygon [[[0.9095298326166407, -0.409529...>](https://image.slidesharecdn.com/geoscript-111003092956-phpapp01/85/GeoScript-Spatial-Capabilities-for-Scripting-Languages-18-320.jpg)


![Projection >>> from geoscript import geom >>> from geoscript.proj import Projection >>> p = Projection('epsg:4326') >>> p.transform((-111, 45.7), 'epsg:26912') (500000.0, 5060716.313515949) >>> g = geom.Point(0, 0).buffer(4) >>> g = reduce(lambda x,y:x.union(y),[geom.transform(g,dx=x,dy=y) for x,y in [(3,0),(0,3),(-3,0),(0,-3)]]) >>> p.transform(g, 'epsg:26912') >>> p.transform(g, 'epsg:3005') Reprojection WGS 84 UTM Albers](https://image.slidesharecdn.com/geoscript-111003092956-phpapp01/85/GeoScript-Spatial-Capabilities-for-Scripting-Languages-21-320.jpg)

![Data Access - Workspace js> var ws = require("geoscript/workspace"); js> var dir = ws.Directory("data"); js> dir <Directory ["states"]> js> var states = dir.get("states"); js> states <Layer name: states, count: 49>](https://image.slidesharecdn.com/geoscript-111003092956-phpapp01/85/GeoScript-Spatial-Capabilities-for-Scripting-Languages-23-320.jpg)
![Data Access - Workspace >> from geoscript.workspace import PostGIS >> pg = PostGIS('spearfish') >> pg.layers() ['archsites', 'bugsites', ..., 'streams'] >> l = pg['archsites']](https://image.slidesharecdn.com/geoscript-111003092956-phpapp01/85/GeoScript-Spatial-Capabilities-for-Scripting-Languages-24-320.jpg)
![Data Access - Workspace >>> import geoscript.workspace.H2 >>> import geoscript.geom.Point >>> import geoscript.feature.Feature >>> h2 = new H2("name", "path") >>> layer = h2.create("points", [ new Field("geom","Point"), new Field("name","String") ]) >>> layer.add([new Point[1,1],"one"])](https://image.slidesharecdn.com/geoscript-111003092956-phpapp01/85/GeoScript-Spatial-Capabilities-for-Scripting-Languages-25-320.jpg)


![Styling - Stroke >>> from geoscript.style import Stroke >>> Stroke('#000000', width=2) >>> Stroke('black', width=2, dash=[5,5]) >>> Stroke((0,0,0),width=2).hatch('vertline')](https://image.slidesharecdn.com/geoscript-111003092956-phpapp01/85/GeoScript-Spatial-Capabilities-for-Scripting-Languages-30-320.jpg)


![Voronoi Diagram Example import geoscript.layer.* import geoscript.feature.* import geoscript.geom.* def shp = new Shapefile('states.shp') def schema = new Schema('states_voronoi', [['the_geom','MultiPolygon','EPSG:4326']]) def diagramLayer = shp.workspace.create(schema) def geoms = shp.features.collect{f-> f.geom.centroid } def geomCol = new GeometryCollection(geoms) def voronoiGeom = geomCol.voronoiDiagram diagramLayer.add(schema.feature([voronoiGeom]))](https://image.slidesharecdn.com/geoscript-111003092956-phpapp01/85/GeoScript-Spatial-Capabilities-for-Scripting-Languages-37-320.jpg)
![Gradient Example var Directory = require("geoscript/workspace").Directory; var {Fill, gradient} = require("geoscript/style"); var Map = require("geoscript/map").Map; var states = Directory("data").get("states"); states.style = gradient({ expression: "PERSONS / LAND_KM", values: [0, 200], styles: [Fill("#000066"), Fill("red")], classes: 10, method: "exponential" }).and( Fill("red").where("PERSONS / LAND_KM > 200") ); var map = Map([states]); map.render({path: "states.png"});](https://image.slidesharecdn.com/geoscript-111003092956-phpapp01/85/GeoScript-Spatial-Capabilities-for-Scripting-Languages-38-320.jpg)
![Shapefile to PostGIS from geoscript.workspace import Directory, PostGIS shps = Directory('shapefiles') shps.layers() archsites = shps['archsites'] archsites.proj.id pg = PostGIS('demo') pg.layers() for layer in shps: reprojected = shps[layer].reproject('epsg:4326') pg.add(reprojected, name=layer) pg.layers() archsites = pg['archsites'] archsites.proj.id](https://image.slidesharecdn.com/geoscript-111003092956-phpapp01/85/GeoScript-Spatial-Capabilities-for-Scripting-Languages-39-320.jpg)


![Centroids import geoscript.layer.* import geoscript.feature.* import geoscript.geom.* Shapefile shp = new Shapefile('states.shp') Schema schema = shp.schema.changeGeometryType('Point', 'states_centroids') Layer centroidLayer = shp.workspace.create(schema) Cursor cursor = shp.cursor while(cursor.hasNext()) { Feature f = cursor.next() Map attributes = [:] f.attributes.each{k,v -> if (v instanceof Geometry) { attributes[k] = v.centroid } else { attributes[k] = v } } Feature feature = schema.feature(attributes, f.id) centroidLayer.add(feature) } cursor.close()](https://image.slidesharecdn.com/geoscript-111003092956-phpapp01/85/GeoScript-Spatial-Capabilities-for-Scripting-Languages-43-320.jpg)


![import geoscript.geom.* import geoscript.feature.* import geoscript.layer.Layer import geoscript.workspace.Directory Schema s = new Schema('earthquakes'[['the_geom', 'Point', 'EPSG:4326'], ['title','String'], ['date', 'java.util.Date'], ['elevation', 'Double']]) Directory dir = new Directory('.') Layer layer = dir.create(s) def url = "http://earthquake.usgs.gov/earthquakes/catalogs/1day-M2.5.xml" def rss = new XmlParser().parse(url) int c = 0 String dateFormat = "yyyy-MM-dd'T'HH:mm:ss'Z'" rss.entry.each{e -> def title = e.title.text() def date = Date.parse(dateFormat, e.updated.text()) def coordinate = e."georss:point".text().split(" ") double x = coordinate[1] as Double double y = coordinate[0] as Double def point = new Point(x,y) def elev = e."georss:elev".text() as Double Feature f = s.feature(['title':title,'date':date, 'elevation': elev, 'the_geom': point],"earthquake_${c}") layer.add(f) c++ }](https://image.slidesharecdn.com/geoscript-111003092956-phpapp01/85/GeoScript-Spatial-Capabilities-for-Scripting-Languages-46-320.jpg)


![WMS Server import com.sun.grizzly.http.embed.GrizzlyWebServer import com.sun.grizzly.http.servlet.ServletAdapter import groovy.servlet.GroovySerlvet @Grab(group='com.sun.grizzly',module='grizzly-servlet-webserver', version='1.9.10') def start() { def server = new GrizzlyWebServer(8080, "web") def servlet = new ServletAdapter() servlet.contextPath = "/geoscript" servlet.servletInstance = new GroovyServlet() server.addGrizzlyAdapter(servlet, ["/geoscript"] as String[]) server.start() } start()](https://image.slidesharecdn.com/geoscript-111003092956-phpapp01/85/GeoScript-Spatial-Capabilities-for-Scripting-Languages-50-320.jpg)
![WMS Server... import geoscript.map.Map import geoscript.style.* import geoscript.layer.Shapefile import geoscript.geom.Bounds def file = new File("states.shp") def shp = new Shapefile(file) shp.style = new Fill("steelblue") + new Stroke("wheat", 0.1) def map = new Map( width: 256, height: 256, layers: [shp], proj: shp.proj, fixAspectRatio: false ) def bbox = request.getParameter("BBOX").split(",") def bounds = new Bounds(bbox[0] as double, bbox[1] as double, bbox[2] as double, bbox[3] as double) map.bounds = bounds response.contentType = "image/png" map.render(response.outputStream) map.close()](https://image.slidesharecdn.com/geoscript-111003092956-phpapp01/85/GeoScript-Spatial-Capabilities-for-Scripting-Languages-51-320.jpg)

GeoScript - Spatial Capabilities for Scripting Languages
- 1. GeoScript Spatial Capabilities for Scripting Languages Justin Deolivera, Tim Schaub, and Jared Erickson
- 2. Introduction What is GeoScript? Overview of languages Motivation GeoTools hard, scripting easy Development turnaround GeoScript Modules/API Overview Geometry Projection Data Access Styling
- 3. Scripting Platform for JVM Languages Similar API Respect languages differences
- 4. Groovy Groovy Dynamic language Easy for Java programmers to learn Closures, DSLs REPL, GUI Console Compiles to Java Byte Code Full access to Java libraries http://geoscript.org/groovy https://github.com/jericks/geoscript-groovy
- 5. JavaScript Not just for the browser any more! Common JS module loading with Rhino. One language for client & server code. Docs: http://geoscript.org/js/ Source: https://github.com/tschaub/geoscript-js/
- 6. Python Jython Java implementation of Python Jython 2.5 = CPython 2.5 Full access to Java libraries http://geoscript.org/py https://github.com/jdeolive/geoscript-py
- 7. Scala Combine functional and object-oriented programming Statically typed REPL Compiles to Java bytecode Full access to Java libraries http://geoscript.org/scala/ https://github.com/dwins/geoscript.scala/ Scala
- 8. On the shoulders of giants...
- 10. Geometry Easy to use constructors I/O WKT/WKB JSON GML Plotting Transforms
- 11. Geometry >>> from geoscript import geom >>> geom.Point(30, 10) POINT(30 10)
- 12. Geometry >>> import geoscript.geom.* >>> line = new LineString([[111.0, -47], [123.0, -48], [110.0, -47]]) LINESTRING (111 -47, 123 -48, 110 -47)
- 13. Geometry js> var poly = geom.Point([10, 30]). > buffer(5) js> poly <Polygon [[[15, 30], [14.90...> js> poly.area 78.03612880645133
- 14. Geometry - I/O >>> from geoscript import geom >>> point = geom.Point(30, 10) >>> geom.writeKML(point) <kml:Point xmlns:kml="http://earth.google.com/kml/2.1"> <kml:coordinates>0.0,0.0</kml:coordinates> </kml:Point>
- 15. Geometry - I/O >>> import geoscript.geom.Point >>> import geoscript.geom.io.Gml2Writer >>> p = new Point(111, -47) >>> gml = new Gml2Writer() >>> gml.write(p) <gml:Point> <gml:coordinates>111.0,-47.0</gml:coordinates> </gml:Point>
- 16. Geometry - I/O js> var geom = require("geoscript/geom"); js> var point = geom.Point([1, 2]) js> point.json {"type":"Point","coordinates":[1,2]}
- 17. Geometry - Visualization >>> from geoscript.render import plot >>> from geoscript import geom >>> poly = geom.Polygon([(35,10), (10,20), (15,40), (45,45), (35,10)], [(20,30), (35,35), (30,20), (20,30)]) >>> plot(poly)
- 18. Geometry - Visualization js> var geom = require("geoscript/geom") js> require("geoscript/viewer").bind() js> var poly1 = geom.Point([0, 0]).buffer(1) js> var poly2 = poly1.transform({dx: 0.5, dy: 0.5}) js> poly1.difference(poly2) <Polygon [[[0.9095298326166407, -0.409529...>
- 19. Projection Parse/encode WKT Full GeoTools EPSG database Re-projection
- 20. Projection js> var proj = require("geoscript/proj"); js> var p = proj.Projection("epsg:4326"); js> p.wkt GEOGCS["WGS 84", DATUM["World Geodetic System 1984", ...
- 21. Projection >>> from geoscript import geom >>> from geoscript.proj import Projection >>> p = Projection('epsg:4326') >>> p.transform((-111, 45.7), 'epsg:26912') (500000.0, 5060716.313515949) >>> g = geom.Point(0, 0).buffer(4) >>> g = reduce(lambda x,y:x.union(y),[geom.transform(g,dx=x,dy=y) for x,y in [(3,0),(0,3),(-3,0),(0,-3)]]) >>> p.transform(g, 'epsg:26912') >>> p.transform(g, 'epsg:3005') Reprojection WGS 84 UTM Albers
- 22. Data Access Read and Write Layers Query Layers using CQL I/O GeoJSON GML
- 23. Data Access - Workspace js> var ws = require("geoscript/workspace"); js> var dir = ws.Directory("data"); js> dir <Directory ["states"]> js> var states = dir.get("states"); js> states <Layer name: states, count: 49>
- 24. Data Access - Workspace >> from geoscript.workspace import PostGIS >> pg = PostGIS('spearfish') >> pg.layers() ['archsites', 'bugsites', ..., 'streams'] >> l = pg['archsites']
- 25. Data Access - Workspace >>> import geoscript.workspace.H2 >>> import geoscript.geom.Point >>> import geoscript.feature.Feature >>> h2 = new H2("name", "path") >>> layer = h2.create("points", [ new Field("geom","Point"), new Field("name","String") ]) >>> layer.add([new Point[1,1],"one"])
- 26. Data Access - Layers >>> from geoscript.layer import Shapefile >>> states = Shapefile('states.shp') >>> states = states.reproject('epsg:3005')
- 27. Data Access - Layer Info >>> import geoscript.layer.Shapefile >>> shp = new Shapefile("states.shp") >>> shp.count 49 >>> shp.bounds (-124.73142200000001, 24.955967,-66.969849, 49.371735, EPSG:4326) >>> shp.schema.fields.each { fld -> println fld} the_geom: MultiPolygon(EPSG:4326) STATE_NAME: String STATE_FIPS: String SUB_REGION: String STATE_ABBR: String
- 28. Data Access - Layers js> var ws = require("geoscript/workspace"); js> var dir = ws.Directory("data"); js> var states = dir.get("states"); js> states.query("STATE_ABBR like 'M%'").forEach( > function(feature) { > print(feature.get("STATE_NAME")); > } > ) Maryland Missouri Mississippi ...
- 29. Styling and Rendering Taming SLD Symbolizers Scale dependence Thematics
- 30. Styling - Stroke >>> from geoscript.style import Stroke >>> Stroke('#000000', width=2) >>> Stroke('black', width=2, dash=[5,5]) >>> Stroke((0,0,0),width=2).hatch('vertline')
- 31. Styling - Fill >>> import geoscript.style.Fill >>> new Fill("gray") >>> new Fill("gray", 0.5)) >>> new Fill("gray").hatch("backslash") >>> new Stroke("red",2) + new Fill("gray").hatch("times")
- 32. Styling - Shape and Icon js> var style = require("geoscript/style"); js> style.Shape({name: "star", fill: "yellow"}) <Shape name: 'star', size: 6> js> style.Icon("rainy.svg") <Icon url: 'rainy.svg'>
- 33. Styling - Labels >>> from geoscript.style import Label,Stroke,Fill,Shape >>> font = 'bold 16px Arial' >>> Shape() + Label('name',font) .point(displace=(20,0)) >>> Stroke() + Label('name',font) .linear(offset=10) >>> Fill() + Label('name',font).halo('white',2)
- 34. Styling - Scale >>> new Shape('#004d96', 5).range(3000) + new Icon('school20.png').range(1500, 3000) + new Icon('school40.png').range(-1, 1500)
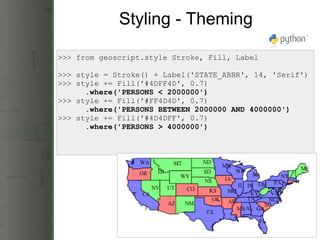
- 35. Styling - Theming >>> from geoscript.style Stroke, Fill, Label >>> style = Stroke() + Label('STATE_ABBR', 14, 'Serif') >>> style += Fill('#4DFF4D', 0.7) .where('PERSONS < 2000000') >>> style += Fill('#FF4D4D', 0.7) .where('PERSONS BETWEEN 2000000 AND 4000000') >>> style += Fill('#4D4DFF', 0.7) .where('PERSONS > 4000000')
- 36. Demos
- 37. Voronoi Diagram Example import geoscript.layer.* import geoscript.feature.* import geoscript.geom.* def shp = new Shapefile('states.shp') def schema = new Schema('states_voronoi', [['the_geom','MultiPolygon','EPSG:4326']]) def diagramLayer = shp.workspace.create(schema) def geoms = shp.features.collect{f-> f.geom.centroid } def geomCol = new GeometryCollection(geoms) def voronoiGeom = geomCol.voronoiDiagram diagramLayer.add(schema.feature([voronoiGeom]))
- 38. Gradient Example var Directory = require("geoscript/workspace").Directory; var {Fill, gradient} = require("geoscript/style"); var Map = require("geoscript/map").Map; var states = Directory("data").get("states"); states.style = gradient({ expression: "PERSONS / LAND_KM", values: [0, 200], styles: [Fill("#000066"), Fill("red")], classes: 10, method: "exponential" }).and( Fill("red").where("PERSONS / LAND_KM > 200") ); var map = Map([states]); map.render({path: "states.png"});
- 39. Shapefile to PostGIS from geoscript.workspace import Directory, PostGIS shps = Directory('shapefiles') shps.layers() archsites = shps['archsites'] archsites.proj.id pg = PostGIS('demo') pg.layers() for layer in shps: reprojected = shps[layer].reproject('epsg:4326') pg.add(reprojected, name=layer) pg.layers() archsites = pg['archsites'] archsites.proj.id
- 40. Road Map Raster Rendering WPS/GeoServer Map Printing
- 41. Resources Web Site http://geoscript.org Google Group http://groups.google.com/group/geoscript Blog http://geoscriptblog.blogspot.com GitHub https://github.com/jdeolive/geoscript-py https://github.com/tschaub/geoscript-js https://github.com/dwins/geoscript.scala https://github.com/jericks/geoscript-groovy
- 42. Thank you!
- 43. Centroids import geoscript.layer.* import geoscript.feature.* import geoscript.geom.* Shapefile shp = new Shapefile('states.shp') Schema schema = shp.schema.changeGeometryType('Point', 'states_centroids') Layer centroidLayer = shp.workspace.create(schema) Cursor cursor = shp.cursor while(cursor.hasNext()) { Feature f = cursor.next() Map attributes = [:] f.attributes.each{k,v -> if (v instanceof Geometry) { attributes[k] = v.centroid } else { attributes[k] = v } } Feature feature = schema.feature(attributes, f.id) centroidLayer.add(feature) } cursor.close()
- 44. Shapefiles to PostGIS import geoscript.workspace.* import geoscript.layer.* def dir = new Directory("/Users/jericks/Downloads/wash") println("Shapefiles: ${dir.layers}") def postgis = new PostGIS('postgres','localhost','5432','public','postgres', 'postgres') println("PostGIS Layers: ${postgis.layers}") dir.layers.each{name-> def layer = dir.get(name) println("Adding ${layer.name}...") postgis.add(layer) }
- 45. USGS Earth Quakes Read RSS Feed to a Shapefile
- 46. import geoscript.geom.* import geoscript.feature.* import geoscript.layer.Layer import geoscript.workspace.Directory Schema s = new Schema('earthquakes'[['the_geom', 'Point', 'EPSG:4326'], ['title','String'], ['date', 'java.util.Date'], ['elevation', 'Double']]) Directory dir = new Directory('.') Layer layer = dir.create(s) def url = "http://earthquake.usgs.gov/earthquakes/catalogs/1day-M2.5.xml" def rss = new XmlParser().parse(url) int c = 0 String dateFormat = "yyyy-MM-dd'T'HH:mm:ss'Z'" rss.entry.each{e -> def title = e.title.text() def date = Date.parse(dateFormat, e.updated.text()) def coordinate = e."georss:point".text().split(" ") double x = coordinate[1] as Double double y = coordinate[0] as Double def point = new Point(x,y) def elev = e."georss:elev".text() as Double Feature f = s.feature(['title':title,'date':date, 'elevation': elev, 'the_geom': point],"earthquake_${c}") layer.add(f) c++ }
- 47. Web Applications @GrabResolver(name="graffiti", root="http://simple-dm.googlecode.com/svn/repository") @Grab("com.goodercode:graffiti:1.0-SNAPSHOT") import graffiti.* import geoscript.geom.Geometry @Get("/buffer") def buffer() { Geometry.fromWKT(params.geom).buffer(params.distance as double).wkt } @Get("/centroid") def centroid() { Geometry.fromWKT(params.geom).centroid.wkt } @Get("/convexHull") def convexHull() { Geometry.fromWKT(params.geom).convexHull.wkt } Graffiti.root 'graffiti' Graffiti.serve this Graffiti.start() Graffiti Micro Web Framework
- 49. Geometry Web Services Open Layers function centroid() { var features = vectorLayer.features; if (features.length == 0) { alert("Please add some features!"); } else { OpenLayers.loadURL('centroid', { geom: wktFormat.write(features) }, this, function(request) { var wkt = request.responseText; var features = wktFormat.read(wkt); if (features) vectorLayer.addFeatures(features); }, function() { alert("Error calculating centroids!"); } ); } }
- 50. WMS Server import com.sun.grizzly.http.embed.GrizzlyWebServer import com.sun.grizzly.http.servlet.ServletAdapter import groovy.servlet.GroovySerlvet @Grab(group='com.sun.grizzly',module='grizzly-servlet-webserver', version='1.9.10') def start() { def server = new GrizzlyWebServer(8080, "web") def servlet = new ServletAdapter() servlet.contextPath = "/geoscript" servlet.servletInstance = new GroovyServlet() server.addGrizzlyAdapter(servlet, ["/geoscript"] as String[]) server.start() } start()
- 51. WMS Server... import geoscript.map.Map import geoscript.style.* import geoscript.layer.Shapefile import geoscript.geom.Bounds def file = new File("states.shp") def shp = new Shapefile(file) shp.style = new Fill("steelblue") + new Stroke("wheat", 0.1) def map = new Map( width: 256, height: 256, layers: [shp], proj: shp.proj, fixAspectRatio: false ) def bbox = request.getParameter("BBOX").split(",") def bounds = new Bounds(bbox[0] as double, bbox[1] as double, bbox[2] as double, bbox[3] as double) map.bounds = bounds response.contentType = "image/png" map.render(response.outputStream) map.close()
- 52. Geometry Command line echo "POINT (1 1)" | geoscript-groovy geom_buffer.groovy -d 10 | geoscript-groovy geom_envelope.groovy def cli = new CliBuilder(usage: 'geoscript-groovy geom_buffer.groovy -d') cli.d(longOpt: 'distance', 'buffer distance', args:1) cli.h(longOpt: 'help', 'Show usage information and quit') def opt = cli.parse(args) if(!opt) return if (opt.h || !opt.d) cli.usage() else println geoscript.geom.Geometry.fromWKT(System.in.text).buffer(opt.d as double).wkt def cli = new CliBuilder(usage: 'geoscript-groovy geom_envelope.groovy') cli.h(longOpt: 'help', 'Show usage information and quit') def opt = cli.parse(args) if(!opt) return if (opt.h) cli.usage() else println geoscript.geom.Geometry.fromWKT(System.in.text).bounds.geometry.wkt geom_buffer.groovy geom_envelope.groovy