SlideShare a Scribd company logo
Understanding Climate change II
Welcome to the Anthropocene
• Interactions with the climate system
• Modelling & Scenarios
• Introduction to Socio-Ecological
concepts – societal metabolism,
transformations, socio-ecological
systems
Global climate change unit 2
Global carbon budget
Carbon emissions are partitioned among the atmosphere and carbon sinks on land and in the ocean
The “imbalance” between total emissions and total sinks reflects the gap in our understanding
Source: CDIAC; NOAA-ESRL; Houghton and Nassikas 2017; Hansis et al 2015; Joos et al 2013;
Khatiwala et al. 2013; DeVries 2014; Le Quéré et al 2018; Global Carbon Budget 2018
Historical cumulative fossil CO2 emissions by country
Cumulative fossil CO2 emissions were distributed (1870–2017):
USA 25%, EU28 22%, China 13%, Russia 7%, Japan 4% and India 3%
Cumulative emissions (1990–2017) were distributed China 20%, USA 20%, EU28 14%, Russia 6%, India 5%, Japan 4%
‘All others’ includes all other countries along with bunker fuels and statistical differences
Source: CDIAC; Le Quéré et al 2018; Global Carbon Budget 2018
The IPCC
Global climate change unit 2
Why 1.5°C?
The great acceleration
Nine planetary boundaries
1. Climate change
2. Change in biosphere integrity (biodiversity loss
and species extinction)
3. Stratospheric ozone depletion
4. Ocean acidification
5. Biogeochemical flows (phosphorus and nitrogen
cycles)
6. Land-system change (for example deforestation)
7. Freshwater use
8. Atmospheric aerosol loading (microscopic
particles in the atmosphere that affect climate and
living organisms)
9. Introduction of novel entities (e.g. organic
pollutants, radioactive materials, nanomaterials,
and micro-plastics).
The impacts of climate change
A schematic illustration of possible future pathways of the climate against the background of
the typical glacial–interglacial cycles (Lower Left).
Will Steffen et al. PNAS 2018;115:33:8252-8259
©2018 by National Academy of Sciences
Four time periods in Earth’s recent past
that may give insights into positions along
these pathways:
A, Mid-Holocene (Mid-Holocene Warm
Period – About 6,000 Years Ago)
B, Eemian; was the interglacial period
which began about 130,000 years ago and
ended about 115,000 years ago at the
beginning of the Last Glacial Period. Temp was
1-2°C and Sea level was 6-9m higher.
C, Mid-Pliocene; 3.3 Ma–3 Ma was 2–3 °C
higher than today, sea level 25m higher. CO2
400 ppm
D, Mid-Miocene 15.97 ± 0.05 Ma to 11.608
± 0.005 Ma
What are the options?
The direct consequences of man-​made
climate change include:
• rising maximum temperatures
• rising minimum temperatures
• rising sea levels
• higher ocean temperatures
• an increase in heavy precipitation (heavy rain and hail)
• shrinking glaciers
• thawing permafrost
The indirect consequences of climate change, which
directly affect us humans and our environment, include:
• an increase in hunger and water crises, especially in developing countries
• health risks through rising air temperatures and heatwaves
• economic implications of dealing with secondary damage related to
climate change
• increasing spread of pests and pathogens
• loss of biodiversity due to limited adaptability and adaptability speed of
flora and fauna
• ocean acidification due to increased HCO3 concentrations in the water as
a consequence of increased CO₂ concentrations
• the need for adaptation in all areas (e.g. agriculture, forestry, energy,
infrastructure, tourism, etc.)
Ocean acidification – an often forgotten
effect of climate change…
Nearly a third of the carbon dioxide released into the
atmosphere from human sources has dissolved into the
ocean, increasing the acidity of seawater.
Acidified water corrodes calcium carbonate minerals—an
essential ingredient for shell- and skeleton-building that
many calcifying organisms rely upon.
Already now (2011) -- not decades from now as scientists
previously expected -- corrosive shelf water off the
continental shelf of the West Coast is eating away at the
shells of tiny free-swimming marine snails, called
pteropods, that swim near the ocean’s surface and provide
food for a variety of fishes, including salmon, mackerel,
and herring.
The impact of climate
change in Europe
https://www.eea.europa.eu/publications/climate-change-
impacts-and-vulnerability-2016/key-findings
Consequences for Europe
• Southern and central Europe are seeing more frequent heat waves,
forest fires and droughts.
• The Mediterranean area is becoming drier, making it even more
vulnerable to drought and wildfires.
• Northern Europe is getting significantly wetter, and winter floods
could become common.
• Urban areas, where 4 out of 5 Europeans now live, are exposed to
heat waves, flooding or rising sea levels, but are often ill-equipped for
adapting to climate change.
Risks for human health
• There has been an increase in the number of heat-related deaths in
some regions and a decrease in cold-related deaths in others.
• We are already seeing changes in the distribution of some water-
borne illnesses and disease vectors.
Climate Change Scenarios
Global climate change unit 2
Representative Concentration Pathway (RCP)
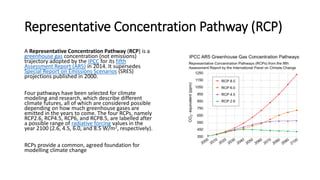
A Representative Concentration Pathway (RCP) is a
greenhouse gas concentration (not emissions)
trajectory adopted by the IPCC for its fifth
Assessment Report (AR5) in 2014. It supersedes
Special Report on Emissions Scenarios (SRES)
projections published in 2000.
Four pathways have been selected for climate
modeling and research, which describe different
climate futures, all of which are considered possible
depending on how much greenhouse gases are
emitted in the years to come. The four RCPs, namely
RCP2.6, RCP4.5, RCP6, and RCP8.5, are labelled after
a possible range of radiative forcing values in the
year 2100 (2.6, 4.5, 6.0, and 8.5 W/m2, respectively).
RCPs provide a common, agreed foundation for
modelling climate change
Global climate change unit 2
The IPCC Special Report on “Global Warming of 1.5°C”
Net emissions include those from land-use change and bioenergy with CCS.
Source: Huppmann et al 2018; IAMC 1.5C Scenario Database; IPCC SR15; Global Carbon Budget 2018
The IPCC Special Report on “Global Warming of 1.5°C” presented new scenarios:
1.5°C scenarios require halving emissions by ~2030, net-zero by ~2050, and negative thereafter
Shared Socioeconomic Pathways (SSPs)
The Shared Socioeconomic Pathways (SSPs) are a set of five socioeconomic narratives that are used by Integrated Assessment
Models to estimate potential future emission pathways
Marker Scenarios are in bold. Net emissions include those from land-use change and bioenergy with CCS.
Source: Riahi et al. 2016; Rogelj et al. 2018; IIASA SSP Database; Global Carbon Budget 2018
Shared Socioeconomic Pathways
• Over the past few years, an international team of climate scientists,
economists and energy systems modellers have built a range of new
“pathways” that examine how global society, demographics and
economics might change over the next century. They are collectively k
• The new SSPs offer five pathways that the world could take.
Compared to previous scenarios, these offer a broader view of a
“business as usual” world without future climate policy, with global
warming in 2100 ranging from a low of 3.1C to a high of 5.1C above
pre-industrial levels. nown as the “Shared Socioeconomic Pathways”
(SSPs).
Emissions must decline rapidly
CO2 emissions need to rapidly decline to follow pathways consistent with the Paris targets
(Projection for 2018 emissions in red)
Source: Huppmann et al 2018; IAMC 1.5C Scenario Database; IPCC SR15; Jackson et al 2018; Global Carbon Budget 2018
Models & Scenarios
What's a system?
• Multiple parts
• Parts Interacting with
each other – more then
with parts outside of the
system
• Boundary
Elements of a system II
• Stocks
• Flows (material, energy, information…)
• Variables
Stocks
Flows
Variables / Valves
Variables
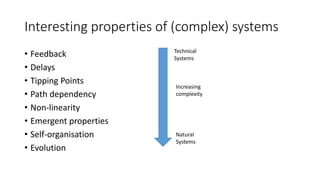
Interesting properties of (complex) systems
• Feedback
• Delays
• Tipping Points
• Path dependency
• Non-linearity
• Emergent properties
• Self-organisation
• Evolution
Increasing
complexity
Technical
Systems
Natural
Systems
Scenarios
Scenario Exercise
Grab one of the questions and take three minutes to think about an
answer.
Scenario Exercise
• How will your live look like in 20 Years?
• How will the world look like in 20 Years and how will you live in it?
• How do you want to live in 20 years?
• How would you like the world to look like in 20 years and what has to
happen to get there?
The problem with studying the future:
• We cant observe it
• We know that it will be different (probably)
• We can not use traditional scientific methods
• We need a set of tools to tackle the unknowns and the uncertainties
of the future
Global climate change unit 2
What are scenarios?
• A tool to address uncertainty
• Presented through stories or narratives
• Describing drivers of change – social, economic, policy, technology,
governance,…
• They may be both qualitative (narratives) and quantitative (models)
• They are no predictions
Global climate change unit 2
SSP1: Sustainability – Taking the Green Road
(Low challenges to mitigation and adaptation)
The world shifts gradually, but pervasively, toward a more sustainable
path, emphasizing more inclusive development that respects
perceived environmental boundaries.
Management of the global commons slowly improves, educational and
health investments accelerate the demographic transition, and the
emphasis on economic growth shifts toward a broader emphasis on
human well-being.
Driven by an increasing commitment to achieving development goals,
inequality is reduced both across and within countries. Consumption is
oriented toward low material growth and lower resource and energy
intensity.
SSP2: Middle of the Road (Medium challenges
to mitigation and adaptation)
The world follows a path in which social, economic, and technological trends
do not shift markedly from historical patterns.
Development and income growth proceeds unevenly, with some countries
making relatively good progress while others fall short of expectations.
Global and national institutions work toward but make slow progress in
achieving sustainable development goals. Environmental systems experience
degradation, although there are some improvements and overall the
intensity of resource and energy use declines.
Global population growth is moderate and levels off in the second half of the
century. Income inequality persists or improves only slowly and challenges to
reducing vulnerability to societal and environmental changes remain.
SSP3: Regional Rivalry – A Rocky Road (High
challenges to mitigation and adaptation)
A resurgent nationalism, concerns about competitiveness and security, and regional
conflicts push countries to increasingly focus on domestic or, at most, regional
issues.
Policies shift over time to become increasingly oriented toward national and
regional security issues. Countries focus on achieving energy and food security
goals within their own regions at the expense of broader-based development.
Investments in education and technological development decline. Economic
development is slow, consumption is material-intensive, and inequalities persist
or worsen over time.
Population growth is low in industrialized and high in developing countries. A low
international priority for addressing environmental concerns leads to strong
environmental degradation in some regions.
SSP4: Inequality – A Road Divided (Low challenges
to mitigation, high challenges to adaptation)
Highly unequal investments in human capital, combined with increasing disparities
in economic opportunity and political power, lead to increasing inequalities and
stratification both across and within countries.
Over time, a gap widens between an internationally-connected society that
contributes to knowledge- and capital-intensive sectors of the global economy, and
a fragmented collection of lower-income, poorly educated societies that work in a
labor intensive, low-tech economy.
Social cohesion degrades and conflict and unrest become increasingly common.
Technology development is high in the high-tech economy and sectors. The
globally connected energy sector diversifies, with investments in both carbon-
intensive fuels like coal and unconventional oil, but also low-carbon energy sources.
Environmental policies focus on local issues around middle and high income areas.
SSP5: Fossil-fueled Development – Taking the
Highway (High challenges to mitigation, low
challenges to adaptation)
This world places increasing faith in competitive markets, innovation and
participatory societies to produce rapid technological progress and development of
human capital as the path to sustainable development.
Global markets are increasingly integrated. There are also strong investments in
health, education, and institutions to enhance human and social capital.
At the same time, the push for economic and social development is coupled with
the exploitation of abundant fossil fuel resources and the adoption of resource
and energy intensive lifestyles around the world.
All these factors lead to rapid growth of the global economy, while global
population peaks and declines in the 21st century. Local environmental problems
like air pollution are successfully managed. There is faith in the ability to effectively
manage social and ecological systems, including by geo-engineering if necessary.
Integrated assessment models
Researchers employed six different integrated assessment models
(IAMs) to translate the socioeconomic conditions of the SSPs into
estimates of future energy use characteristics and greenhouse gas
emissions.
IAMs add aspects of society to an energy systems model, simulating
how population, economic growth and energy use affect – and interact
with – the physical climate.
Global climate change unit 2
CO2 emissions (left) in gigatonnes (GtCO2) and global mean surface temperature change relative to pre-industrial
levels (right) in degrees C across all models and SSPs for baseline no-climate-policy scenarios. The “marker” model
for each SSP is shown by a thicker line, while all other model runs for that SSP have thin lines. Data from the SSP
database; chart by Carbon Brief using Highcharts.
Shared Socioeconomic Pathways (SSPs)
The Shared Socioeconomic Pathways (SSPs) are a set of five socioeconomic narratives that are used by Integrated Assessment
Models to estimate potential future emission pathways
Marker Scenarios are in bold. Net emissions include those from land-use change and bioenergy with CCS.
Source: Riahi et al. 2016; Rogelj et al. 2018; IIASA SSP Database; Global Carbon Budget 2018
Modelling Exercise (about 45 min)
1.) what are the most important factors influencing climate change?
-> make a List (5min)
2.) Groups of 3: Identify the 20 most important elements on your three
lists. How do those elements influence each other? Use arrows and +
(positive influence) or – (negative influence) to draw a causal map.
(15min)
3.) Unite with another group – take a flipchart and come up with a
common causal model about factors influencing climate change.
(15min)
4.) Present your model and the reasoning behind it. (3 min each)
Understanding Society and Nature
interactions

More Related Content

PPTX
Introduction to Climate Science
PPT
Energy and Climate Change: Challenges for Science and Policy
PDF
US Climate Assessment 2013 by Images
PDF
Updates on the preparations of Working Group I contribution to the Sixth Asse...
PPTX
Scientists - Introduction to climate change science
DOCX
Task 6-global warming
PPTX
IPCC Special Report on the Ocean and Cryosphere in a Changing Climate (SROCC)
PPTX
Highlight of the IPCC Work and Process and Findings from the IPCC Special Rep...
Introduction to Climate Science
Energy and Climate Change: Challenges for Science and Policy
US Climate Assessment 2013 by Images
Updates on the preparations of Working Group I contribution to the Sixth Asse...
Scientists - Introduction to climate change science
Task 6-global warming
IPCC Special Report on the Ocean and Cryosphere in a Changing Climate (SROCC)
Highlight of the IPCC Work and Process and Findings from the IPCC Special Rep...

What's hot (20)

PPTX
Students - Introduction to climate change science
PDF
Regional synthesis - Climatic Impact-Drivers
PPTX
The main findings of the IPCC SR15 by Fatima Driouech, IPCC WGI Vice-Chair
PDF
Climate Change - An African Perspective
PPTX
Physical science basis perspective- IPCC Working Group 1
PPTX
Module 1 power point presentation
PDF
Climate change as a global challenge
PPTX
Climate change policy of pakistan
PPTX
Weather Research & Forecasting (WRF-Chem) Model
PPTX
Effects of climate change on planet ocean, IPCC 5th assessment report and bey...
PPTX
Climate change in Sudan and related tasks for the science, Extreme events and...
PDF
IPCC Report
PPTX
Combating climate changes in Kurdistan Region, Challenges and Obstacles.
PPTX
Students - Assessing research on impacts, adaptation and vulnerability during...
PDF
Climate change and Surat City
PPT
Climate Change Adaptation and Masnaging Extreme Events
PDF
Climate change adaptation in urban regeneration projects
PPTX
Finding - Climate extremes and their impacts
PPTX
Joy Periera
PDF
Bending_the_Curve_Univ-of-Cal_2015
Students - Introduction to climate change science
Regional synthesis - Climatic Impact-Drivers
The main findings of the IPCC SR15 by Fatima Driouech, IPCC WGI Vice-Chair
Climate Change - An African Perspective
Physical science basis perspective- IPCC Working Group 1
Module 1 power point presentation
Climate change as a global challenge
Climate change policy of pakistan
Weather Research & Forecasting (WRF-Chem) Model
Effects of climate change on planet ocean, IPCC 5th assessment report and bey...
Climate change in Sudan and related tasks for the science, Extreme events and...
IPCC Report
Combating climate changes in Kurdistan Region, Challenges and Obstacles.
Students - Assessing research on impacts, adaptation and vulnerability during...
Climate change and Surat City
Climate Change Adaptation and Masnaging Extreme Events
Climate change adaptation in urban regeneration projects
Finding - Climate extremes and their impacts
Joy Periera
Bending_the_Curve_Univ-of-Cal_2015
Ad

Similar to Global climate change unit 2 (20)

PPT
envi..green
PPT
CLIMATE CHANGE - UNEP.ppt
PPT
olhoff_e.ppt
PPTX
EMISSION SCENARIOS in climate change and sustainable
PPT
UNIT-1 CARBON FOOT PRINT.pptfuxydudyydxufuu
PDF
Lesson 7 Basis for projection of climate change
PPTX
Ipcc cop 26 climate change and environment sai bhaskar
PPTX
10 Science Must Knows on Climate Change
PPTX
FICCI-IIFA Global Business Forum Presentation (April 24, 2014)
PPTX
Latest debates in climate change
PPT
Economics_of_Climate_Change_DanielTU_UNCTAD_.ppt
PDF
Climate-Change and disaster risk reduction
PDF
Is Climate Change a Real Threat or Is It Overhyped - Copy.pdf
PPT
Hdr 20072008 Presentation[1]
PPTX
2019 welcome to the anthropocene cemus
PPTX
Dr pachauris bio economy presentation aug12 2013
PPTX
Basics of Climate Change
PPTX
Dr pachauris bio economy presentation aug12 2013
PDF
Global climate change unit1
PPTX
A presentation on impact of human activities on weather and climate
envi..green
CLIMATE CHANGE - UNEP.ppt
olhoff_e.ppt
EMISSION SCENARIOS in climate change and sustainable
UNIT-1 CARBON FOOT PRINT.pptfuxydudyydxufuu
Lesson 7 Basis for projection of climate change
Ipcc cop 26 climate change and environment sai bhaskar
10 Science Must Knows on Climate Change
FICCI-IIFA Global Business Forum Presentation (April 24, 2014)
Latest debates in climate change
Economics_of_Climate_Change_DanielTU_UNCTAD_.ppt
Climate-Change and disaster risk reduction
Is Climate Change a Real Threat or Is It Overhyped - Copy.pdf
Hdr 20072008 Presentation[1]
2019 welcome to the anthropocene cemus
Dr pachauris bio economy presentation aug12 2013
Basics of Climate Change
Dr pachauris bio economy presentation aug12 2013
Global climate change unit1
A presentation on impact of human activities on weather and climate
Ad

More from Martin Wildenberg (10)

PDF
Global climate change unit 5
PPTX
Life cycle based assessment for agricultural products An Austrian best practice
PPTX
Die PEF und OEF Pilotphase Erfahrungen und Sicht auf die EU-Initiative aus Ö...
PPTX
Life cycle based ecolabeling for agricultural products in Austria
PPTX
Presentation about the links between our resource consumption and biodiversit...
PPT
Fuzzy cognitive mapping
PPT
Linking thoughts to flows Integrated modeling of Social Ecological Systems
PPTX
Die Modellierung sozial-ökologischer Systeme im Kontext der Nachhaltigkeitsfo...
PPTX
Nachhaltigkeit entlang der Agri-Food Chain
PPTX
Measuring sustainability, setting incentives and involving actors - the GLO...
Global climate change unit 5
Life cycle based assessment for agricultural products An Austrian best practice
Die PEF und OEF Pilotphase Erfahrungen und Sicht auf die EU-Initiative aus Ö...
Life cycle based ecolabeling for agricultural products in Austria
Presentation about the links between our resource consumption and biodiversit...
Fuzzy cognitive mapping
Linking thoughts to flows Integrated modeling of Social Ecological Systems
Die Modellierung sozial-ökologischer Systeme im Kontext der Nachhaltigkeitsfo...
Nachhaltigkeit entlang der Agri-Food Chain
Measuring sustainability, setting incentives and involving actors - the GLO...

Recently uploaded (20)

PPTX
Green and Cream Aesthetic Group Project Presentation.pptx
PDF
School Leaders Revised Training Module, SCB.pdf
PPTX
UN Environmental Inventory User Training 2021.pptx
PDF
Session 8a Sixth Assessment Report Findings
PDF
Ornithology-Basic-Concepts.pdf..........
PDF
Earthquake, learn from the past and do it now.pdf
PPT
PPTPresentation3 jhsvdasvdjhavsdhsvjcksjbc.jasb..ppt
PDF
PET Hydrolysis (polyethylene terepthalate Hydrolysis)
PPTX
Concept of Safe and Wholesome Water.pptx
PPTX
Environmental Ethics: issues and possible solutions
PDF
Blue Economy Development Framework for Indonesias Economic Transformation.pdf
PDF
Effect of anthropisation and revegetation efforts on soil bacterial community...
PPTX
Biodiversity.udfnfndrijfreniufrnsiufnriufrenfuiernfuire
PDF
Session7 Outlines of AR7 Reports Working Group III
PPTX
FIRE SAFETY SEMINAR SAMPLE FOR EVERYONE.pptx
PDF
The Role of Non-Legal Advocates in Fighting Social Injustice.pdf
PDF
Tree Biomechanics, a concise presentation
PPTX
9.-Sedatives-and-Hypnotics.pptxcccccccccccccccccccppt
PPT
Compliance Monitoring report CMR presentation.ppt
DOCX
Epoxy Coated Steel Bolted Tanks for Beverage Wastewater Storage Manages Liqui...
Green and Cream Aesthetic Group Project Presentation.pptx
School Leaders Revised Training Module, SCB.pdf
UN Environmental Inventory User Training 2021.pptx
Session 8a Sixth Assessment Report Findings
Ornithology-Basic-Concepts.pdf..........
Earthquake, learn from the past and do it now.pdf
PPTPresentation3 jhsvdasvdjhavsdhsvjcksjbc.jasb..ppt
PET Hydrolysis (polyethylene terepthalate Hydrolysis)
Concept of Safe and Wholesome Water.pptx
Environmental Ethics: issues and possible solutions
Blue Economy Development Framework for Indonesias Economic Transformation.pdf
Effect of anthropisation and revegetation efforts on soil bacterial community...
Biodiversity.udfnfndrijfreniufrnsiufnriufrenfuiernfuire
Session7 Outlines of AR7 Reports Working Group III
FIRE SAFETY SEMINAR SAMPLE FOR EVERYONE.pptx
The Role of Non-Legal Advocates in Fighting Social Injustice.pdf
Tree Biomechanics, a concise presentation
9.-Sedatives-and-Hypnotics.pptxcccccccccccccccccccppt
Compliance Monitoring report CMR presentation.ppt
Epoxy Coated Steel Bolted Tanks for Beverage Wastewater Storage Manages Liqui...

Global climate change unit 2

  • 1. Understanding Climate change II Welcome to the Anthropocene • Interactions with the climate system • Modelling & Scenarios • Introduction to Socio-Ecological concepts – societal metabolism, transformations, socio-ecological systems
  • 3. Global carbon budget Carbon emissions are partitioned among the atmosphere and carbon sinks on land and in the ocean The “imbalance” between total emissions and total sinks reflects the gap in our understanding Source: CDIAC; NOAA-ESRL; Houghton and Nassikas 2017; Hansis et al 2015; Joos et al 2013; Khatiwala et al. 2013; DeVries 2014; Le Quéré et al 2018; Global Carbon Budget 2018
  • 4. Historical cumulative fossil CO2 emissions by country Cumulative fossil CO2 emissions were distributed (1870–2017): USA 25%, EU28 22%, China 13%, Russia 7%, Japan 4% and India 3% Cumulative emissions (1990–2017) were distributed China 20%, USA 20%, EU28 14%, Russia 6%, India 5%, Japan 4% ‘All others’ includes all other countries along with bunker fuels and statistical differences Source: CDIAC; Le Quéré et al 2018; Global Carbon Budget 2018
  • 9. Nine planetary boundaries 1. Climate change 2. Change in biosphere integrity (biodiversity loss and species extinction) 3. Stratospheric ozone depletion 4. Ocean acidification 5. Biogeochemical flows (phosphorus and nitrogen cycles) 6. Land-system change (for example deforestation) 7. Freshwater use 8. Atmospheric aerosol loading (microscopic particles in the atmosphere that affect climate and living organisms) 9. Introduction of novel entities (e.g. organic pollutants, radioactive materials, nanomaterials, and micro-plastics).
  • 10. The impacts of climate change
  • 11. A schematic illustration of possible future pathways of the climate against the background of the typical glacial–interglacial cycles (Lower Left). Will Steffen et al. PNAS 2018;115:33:8252-8259 ©2018 by National Academy of Sciences Four time periods in Earth’s recent past that may give insights into positions along these pathways: A, Mid-Holocene (Mid-Holocene Warm Period – About 6,000 Years Ago) B, Eemian; was the interglacial period which began about 130,000 years ago and ended about 115,000 years ago at the beginning of the Last Glacial Period. Temp was 1-2°C and Sea level was 6-9m higher. C, Mid-Pliocene; 3.3 Ma–3 Ma was 2–3 °C higher than today, sea level 25m higher. CO2 400 ppm D, Mid-Miocene 15.97 ± 0.05 Ma to 11.608 ± 0.005 Ma
  • 12. What are the options?
  • 13. The direct consequences of man-​made climate change include: • rising maximum temperatures • rising minimum temperatures • rising sea levels • higher ocean temperatures • an increase in heavy precipitation (heavy rain and hail) • shrinking glaciers • thawing permafrost
  • 14. The indirect consequences of climate change, which directly affect us humans and our environment, include: • an increase in hunger and water crises, especially in developing countries • health risks through rising air temperatures and heatwaves • economic implications of dealing with secondary damage related to climate change • increasing spread of pests and pathogens • loss of biodiversity due to limited adaptability and adaptability speed of flora and fauna • ocean acidification due to increased HCO3 concentrations in the water as a consequence of increased CO₂ concentrations • the need for adaptation in all areas (e.g. agriculture, forestry, energy, infrastructure, tourism, etc.)
  • 15. Ocean acidification – an often forgotten effect of climate change… Nearly a third of the carbon dioxide released into the atmosphere from human sources has dissolved into the ocean, increasing the acidity of seawater. Acidified water corrodes calcium carbonate minerals—an essential ingredient for shell- and skeleton-building that many calcifying organisms rely upon. Already now (2011) -- not decades from now as scientists previously expected -- corrosive shelf water off the continental shelf of the West Coast is eating away at the shells of tiny free-swimming marine snails, called pteropods, that swim near the ocean’s surface and provide food for a variety of fishes, including salmon, mackerel, and herring.
  • 16. The impact of climate change in Europe https://www.eea.europa.eu/publications/climate-change- impacts-and-vulnerability-2016/key-findings
  • 17. Consequences for Europe • Southern and central Europe are seeing more frequent heat waves, forest fires and droughts. • The Mediterranean area is becoming drier, making it even more vulnerable to drought and wildfires. • Northern Europe is getting significantly wetter, and winter floods could become common. • Urban areas, where 4 out of 5 Europeans now live, are exposed to heat waves, flooding or rising sea levels, but are often ill-equipped for adapting to climate change.
  • 18. Risks for human health • There has been an increase in the number of heat-related deaths in some regions and a decrease in cold-related deaths in others. • We are already seeing changes in the distribution of some water- borne illnesses and disease vectors.
  • 22. Representative Concentration Pathway (RCP) A Representative Concentration Pathway (RCP) is a greenhouse gas concentration (not emissions) trajectory adopted by the IPCC for its fifth Assessment Report (AR5) in 2014. It supersedes Special Report on Emissions Scenarios (SRES) projections published in 2000. Four pathways have been selected for climate modeling and research, which describe different climate futures, all of which are considered possible depending on how much greenhouse gases are emitted in the years to come. The four RCPs, namely RCP2.6, RCP4.5, RCP6, and RCP8.5, are labelled after a possible range of radiative forcing values in the year 2100 (2.6, 4.5, 6.0, and 8.5 W/m2, respectively). RCPs provide a common, agreed foundation for modelling climate change
  • 27. The IPCC Special Report on “Global Warming of 1.5°C” Net emissions include those from land-use change and bioenergy with CCS. Source: Huppmann et al 2018; IAMC 1.5C Scenario Database; IPCC SR15; Global Carbon Budget 2018 The IPCC Special Report on “Global Warming of 1.5°C” presented new scenarios: 1.5°C scenarios require halving emissions by ~2030, net-zero by ~2050, and negative thereafter
  • 28. Shared Socioeconomic Pathways (SSPs) The Shared Socioeconomic Pathways (SSPs) are a set of five socioeconomic narratives that are used by Integrated Assessment Models to estimate potential future emission pathways Marker Scenarios are in bold. Net emissions include those from land-use change and bioenergy with CCS. Source: Riahi et al. 2016; Rogelj et al. 2018; IIASA SSP Database; Global Carbon Budget 2018
  • 29. Shared Socioeconomic Pathways • Over the past few years, an international team of climate scientists, economists and energy systems modellers have built a range of new “pathways” that examine how global society, demographics and economics might change over the next century. They are collectively k • The new SSPs offer five pathways that the world could take. Compared to previous scenarios, these offer a broader view of a “business as usual” world without future climate policy, with global warming in 2100 ranging from a low of 3.1C to a high of 5.1C above pre-industrial levels. nown as the “Shared Socioeconomic Pathways” (SSPs).
  • 30. Emissions must decline rapidly CO2 emissions need to rapidly decline to follow pathways consistent with the Paris targets (Projection for 2018 emissions in red) Source: Huppmann et al 2018; IAMC 1.5C Scenario Database; IPCC SR15; Jackson et al 2018; Global Carbon Budget 2018
  • 32. What's a system? • Multiple parts • Parts Interacting with each other – more then with parts outside of the system • Boundary
  • 33. Elements of a system II • Stocks • Flows (material, energy, information…) • Variables Stocks Flows Variables / Valves Variables
  • 34. Interesting properties of (complex) systems • Feedback • Delays • Tipping Points • Path dependency • Non-linearity • Emergent properties • Self-organisation • Evolution Increasing complexity Technical Systems Natural Systems
  • 36. Scenario Exercise Grab one of the questions and take three minutes to think about an answer.
  • 37. Scenario Exercise • How will your live look like in 20 Years? • How will the world look like in 20 Years and how will you live in it? • How do you want to live in 20 years? • How would you like the world to look like in 20 years and what has to happen to get there?
  • 38. The problem with studying the future: • We cant observe it • We know that it will be different (probably) • We can not use traditional scientific methods • We need a set of tools to tackle the unknowns and the uncertainties of the future
  • 40. What are scenarios? • A tool to address uncertainty • Presented through stories or narratives • Describing drivers of change – social, economic, policy, technology, governance,… • They may be both qualitative (narratives) and quantitative (models) • They are no predictions
  • 43. SSP1: Sustainability – Taking the Green Road (Low challenges to mitigation and adaptation) The world shifts gradually, but pervasively, toward a more sustainable path, emphasizing more inclusive development that respects perceived environmental boundaries. Management of the global commons slowly improves, educational and health investments accelerate the demographic transition, and the emphasis on economic growth shifts toward a broader emphasis on human well-being. Driven by an increasing commitment to achieving development goals, inequality is reduced both across and within countries. Consumption is oriented toward low material growth and lower resource and energy intensity.
  • 44. SSP2: Middle of the Road (Medium challenges to mitigation and adaptation) The world follows a path in which social, economic, and technological trends do not shift markedly from historical patterns. Development and income growth proceeds unevenly, with some countries making relatively good progress while others fall short of expectations. Global and national institutions work toward but make slow progress in achieving sustainable development goals. Environmental systems experience degradation, although there are some improvements and overall the intensity of resource and energy use declines. Global population growth is moderate and levels off in the second half of the century. Income inequality persists or improves only slowly and challenges to reducing vulnerability to societal and environmental changes remain.
  • 45. SSP3: Regional Rivalry – A Rocky Road (High challenges to mitigation and adaptation) A resurgent nationalism, concerns about competitiveness and security, and regional conflicts push countries to increasingly focus on domestic or, at most, regional issues. Policies shift over time to become increasingly oriented toward national and regional security issues. Countries focus on achieving energy and food security goals within their own regions at the expense of broader-based development. Investments in education and technological development decline. Economic development is slow, consumption is material-intensive, and inequalities persist or worsen over time. Population growth is low in industrialized and high in developing countries. A low international priority for addressing environmental concerns leads to strong environmental degradation in some regions.
  • 46. SSP4: Inequality – A Road Divided (Low challenges to mitigation, high challenges to adaptation) Highly unequal investments in human capital, combined with increasing disparities in economic opportunity and political power, lead to increasing inequalities and stratification both across and within countries. Over time, a gap widens between an internationally-connected society that contributes to knowledge- and capital-intensive sectors of the global economy, and a fragmented collection of lower-income, poorly educated societies that work in a labor intensive, low-tech economy. Social cohesion degrades and conflict and unrest become increasingly common. Technology development is high in the high-tech economy and sectors. The globally connected energy sector diversifies, with investments in both carbon- intensive fuels like coal and unconventional oil, but also low-carbon energy sources. Environmental policies focus on local issues around middle and high income areas.
  • 47. SSP5: Fossil-fueled Development – Taking the Highway (High challenges to mitigation, low challenges to adaptation) This world places increasing faith in competitive markets, innovation and participatory societies to produce rapid technological progress and development of human capital as the path to sustainable development. Global markets are increasingly integrated. There are also strong investments in health, education, and institutions to enhance human and social capital. At the same time, the push for economic and social development is coupled with the exploitation of abundant fossil fuel resources and the adoption of resource and energy intensive lifestyles around the world. All these factors lead to rapid growth of the global economy, while global population peaks and declines in the 21st century. Local environmental problems like air pollution are successfully managed. There is faith in the ability to effectively manage social and ecological systems, including by geo-engineering if necessary.
  • 48. Integrated assessment models Researchers employed six different integrated assessment models (IAMs) to translate the socioeconomic conditions of the SSPs into estimates of future energy use characteristics and greenhouse gas emissions. IAMs add aspects of society to an energy systems model, simulating how population, economic growth and energy use affect – and interact with – the physical climate.
  • 50. CO2 emissions (left) in gigatonnes (GtCO2) and global mean surface temperature change relative to pre-industrial levels (right) in degrees C across all models and SSPs for baseline no-climate-policy scenarios. The “marker” model for each SSP is shown by a thicker line, while all other model runs for that SSP have thin lines. Data from the SSP database; chart by Carbon Brief using Highcharts.
  • 51. Shared Socioeconomic Pathways (SSPs) The Shared Socioeconomic Pathways (SSPs) are a set of five socioeconomic narratives that are used by Integrated Assessment Models to estimate potential future emission pathways Marker Scenarios are in bold. Net emissions include those from land-use change and bioenergy with CCS. Source: Riahi et al. 2016; Rogelj et al. 2018; IIASA SSP Database; Global Carbon Budget 2018
  • 52. Modelling Exercise (about 45 min) 1.) what are the most important factors influencing climate change? -> make a List (5min) 2.) Groups of 3: Identify the 20 most important elements on your three lists. How do those elements influence each other? Use arrows and + (positive influence) or – (negative influence) to draw a causal map. (15min) 3.) Unite with another group – take a flipchart and come up with a common causal model about factors influencing climate change. (15min) 4.) Present your model and the reasoning behind it. (3 min each)
  • 53. Understanding Society and Nature interactions