


![(the suburban soccer mom), “Barry” (the wealthy professional
guy), and “Ray” (the family man). The firm also applies a
customer lifetime value model that measures transaction-level
profitability and factors in customer behaviors that increase or
decrease the value of the relationship. Knowing so much about
consumers allows Best Buy to employ precision marketing and
customer-triggered incentive programs with positive response
rates.8
Best Buy uses a massive database to develop profiles with
which to classify its customers.
Bloomberg/Getty Images, Inc.
Marketing Intelligence
The Marketing Intelligence System
A marketing intelligence system is a set of procedures and
sources that managers use to obtain everyday information about
developments in the marketing environment. The internal
records system supplies results data, but the marketing
intelligence system supplies happenings data. Marketing
managers collect marketing intelligence in a variety of different
ways, such as by reading books, newspapers, and trade
publications; talking to customers, suppliers, and distributors;
monitoring social media on the Internet; and meeting with other
company managers.
Before the Internet, sometimes you just had to go out in the
field, literally, and watch the competition. This is what oil and
gas entrepreneur T. Boone Pickens did. Describing how he
learned about a rival’s drilling activity, Pickens recalls, “We
would have someone who would watch [the rival’s] drilling
floor from a half mile away with field glasses. Our competitor
didn’t like it but there wasn’t anything they could do about it.
Our spotters would watch the joints and drill pipe. They would
count them; each [drill] joint was 30 feet long. By adding up all
the joints, you would be able to tally the depth of the well.”
Pickens knew that the deeper the well, the more costly it would
be for his rival to get the oil or gas up to the surface, and this](https://image.slidesharecdn.com/marketingmanagement14chapter3collectinginformationandfo-221031210852-d9e48f7d/85/Marketing-Management-14Chapter-3-Collecting-Information-and-Fo-docx-10-320.jpg)


![The advantage is that a product supplier can compare experts’
opinions with those of consumers.
· Customer complaint sites.Customer complaint forums are
designed mainly for dissatisfied customers. PlanetFeedback.com
allows customers to voice unfavorable experiences with specific
companies. Another site, Complaints.com, lets customers vent
their frustrations with particular firms or offerings.
· Public blogs.Tens of millions of blogs and social networks
exist online, offering personal opinions, reviews, ratings, and
recommendations on virtually any topic—and their numbers
continue to grow. Firms such as Nielsen’s BuzzMetrics and
Scout Labs analyze blogs and social networks to provide
insights into consumer sentiment.
Communicating and Acting on Marketing Intelligence
In some companies, the staff scans the Internet and major
publications, abstracts relevant news, and disseminates a news
bulletin to marketing managers. The competitive intelligence
function works best when it is closely coordinated with the
decision-making process.19
Ticket broker StubHub monitors online activity so that when
confusion arose over a rainout at a New York Yankees game,
for instance, it was able to respond quickly.
Getty Images, Inc.
Given the speed of the Internet, it is important to act quickly on
information gleaned online. Here are two companies that
benefited from a proactive approach to online information:20
· When ticket broker StubHub detected a sudden surge of
negative sentiment about its brand after confusion arose about
refunds for a rain-delayed Yankees–Red Sox game, it jumped in
to offer appropriate discounts and credits. The director of
customer service observed, “This [episode] is a canary in a coal
mine for us.”
· When Coke’s monitoring software spotted a Twitter post that
went to 10,000 followers from an upset consumer who couldn’t
redeem a prize from a MyCoke rewards program, Coke quickly](https://image.slidesharecdn.com/marketingmanagement14chapter3collectinginformationandfo-221031210852-d9e48f7d/85/Marketing-Management-14Chapter-3-Collecting-Information-and-Fo-docx-14-320.jpg)
![posted an apology on his Twitter profile and offered to help
resolve the situation. After the consumer got the prize, he
changed his Twitter avatar to a photo of himself holding a Coke
bottle.
Analyzing the Macroenvironment
Successful companies recognize and respond profitably to
unmet needs and trends.
Needs and Trends
Enterprising individuals and companies manage to create new
solutions to unmet needs. Dockers was created to meet the
needs of baby boomers who could no longer fit into their jeans
and wanted a physically and psychologically comfortable pair of
pants. Let’s distinguish among fads, trends, and megatrends.
· A fad is “unpredictable, short-lived, and without social,
economic, and political significance.” A company can cash in
on a fad such as Crocs clogs, Elmo TMX dolls, and Pokémon
gifts and toys, but getting it right requires luck and good
timing.21
· A direction or sequence of events with momentum and
durability, a trend is more predictable and durable than a fad;
trends reveal the shape of the future and can provide strategic
direction. A trend toward health and nutrition awareness has
brought increased government regulation and negative publicity
for firms seen as peddling unhealthy food. Macaroni Grill
revamped its menu to include more low-calorie and low-fat
offerings after a wave of bad press: The Today Show called its
chicken and artichoke sandwich “the calorie equivalent of 16
Fudgesicles,” and in its annual list of unhealthy restaurant
dishes, Men’s Health declared its 1,630 calorie dessert ravioli
the “worst dessert in America.”22
· A megatrend is a “large social, economic, political, and
technological change [that] is slow to form, and once in place,
influences us for some time—between seven and ten years, or
longer.”23
· To help marketers spot cultural shifts that might bring new
opportunities or threats, several firms offer social-cultural](https://image.slidesharecdn.com/marketingmanagement14chapter3collectinginformationandfo-221031210852-d9e48f7d/85/Marketing-Management-14Chapter-3-Collecting-Information-and-Fo-docx-15-320.jpg)


![company estimates the rate of lathe ownership relative to the
customer industry’s sales, it can compute the market potential.
Multiple-Factor Index Method
Like business marketers, consumer companies also need to
estimate area market potentials, but since their customers are
too numerous to list they commonly use a straightforward index.
A drug manufacturer might assume the market potential for
drugs is directly related to population size. If the state of
Virginia has 2.55 percent of the U.S. population, Virginia might
be a market for 2.55 percent of total drugs sold.
A single factor is rarely a complete indicator of sales
opportunity. Regional drug sales are also influenced by per
capita income and the number of physicians per 10,000 people.
Thus, it makes sense to develop a multiple-factor index and
assign each factor a specific weight. Suppose Virginia has 2.00
percent of U.S. disposable personal income, 1.96 percent of
U.S. retail sales, and 2.28 percent of U.S. population, and the
respective weights are 0.5, 0.3, and 0.2. The buying-power
index for Virginia is then 2.04 [0.5(2.00) + 0.3(1.96) +
0.2(2.28)]. Thus 2.04 percent of the nation’s drug sales (not
2.28 percent) might be expected to take place in Virginia.
The weights in the buying-power index are somewhat arbitrary,
and companies can assign others if appropriate. A manufacturer
might adjust the market potential for additional factors, such as
competitors’ presence, local promotional costs, seasonal factors,
and market idiosyncrasies.
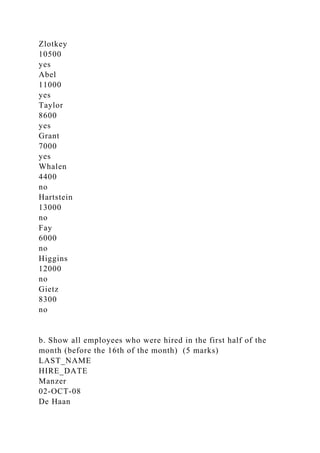
Many companies compute area indexes to allocate marketing
resources. Suppose the drug company is reviewing the six cities
listed in Table 3.5. The first two columns show its percentage of
U.S. brand and category sales in these six cities. Column 3
shows the brand development index (BDI), the index of brand
sales to category sales. Seattle has a BDI of 114 because the
brand is relatively more developed than the category in Seattle.
Portland’s BDI is 65, which means the brand is relatively
underdeveloped there.
Table 3.5 Calculating the Brand Development Index (BDI)](https://image.slidesharecdn.com/marketingmanagement14chapter3collectinginformationandfo-221031210852-d9e48f7d/85/Marketing-Management-14Chapter-3-Collecting-Information-and-Fo-docx-46-320.jpg)


Marketing Management, 14Chapter 3 Collecting Information and Fo.docx
- 1. Marketing Management, 14 Chapter 3: Collecting Information and Forecasting Demand ISBN: 9780132102926 Author: Philip Kotler, Kevin Lane Keller copyright © 2012 Pearson Education Collecting Information and Forecasting Demand The severe economic recession that began in 2008 led many firms to cut their prices and use sales to try to retain customers. Andy Kropa/Redux Pictures In This Chapter, We Will Address the Following Questions 1. What are the components of a modern marketing information system? 2. What are useful internal records for such a system? 3. What makes up a marketing intelligence system? 4. What are some influential macroenvironment developments? 5. How can companies accurately measure and forecast demand? Making marketing decisions in a fast-changing world is both an art and a science. To provide context, insight, and inspiration for marketing decision making, companies must possess comprehensive, up-to-date information about macro trends, as well as about micro effects particular to their business. Holistic marketers recognize that the marketing environment is constantly presenting new opportunities and threats, and they understand the importance of continuously monitoring, forecasting, and adapting to that environment.
- 2. The severe credit crunch and economic slowdown of 2008–2009 brought profound changes in consumer behavior as shoppers cut and reallocated spending. Sales of discretionary purchases like toys, apparel, jewelry, and home furnishings dropped. Sales of luxury brands like Mercedes—driven for years by free-spending baby boomers—declined by a staggering one-third. Meanwhile, brands that offered simple, affordable solutions prospered. General Mills’s revenues from such favorites as Cheerios, Wheaties, Progresso soup, and Hamburger Helper rose. Consumers also changed how and where they shopped, and sales of low-priced private label brands soared. Virtually all marketers were asking themselves whether a new age of prudence and frugality had emerged and, if so, what would be the appropriate response. sidenote Firms are adjusting the way they do business for more reasons than just the economy. Virtually every industry has been touched by dramatic shifts in the technological, demographic, social-cultural, natural, and political-legal environments. In this chapter, we consider how firms can develop processes to identify and track important macroenvironment trends. We also outline how marketers can develop good sales forecasts. Chapter 4 will review how they conduct more customized research on specific marketing problems. Components of a Modern Marketing Information System The major responsibility for identifying significant marketplace changes falls to the company’s marketers. Marketers have two advantages for the task: disciplined methods for collecting information, and time spent interacting with customers and observing competitors and other outside groups. Some firms have marketing information systems that provide rich detail about buyer wants, preferences, and behavior. DuPont
- 3. DuPont commissioned marketing studies to uncover personal pillow behavior for its Dacron Polyester unit, which supplies filling to pillow makers and sells its own Comforel brand. One challenge is that people don’t give up their old pillows: 37 percent of one sample described their relationship with their pillow as being like that of “an old married couple,” and an additional 13 percent said their pillow was like a “childhood friend.” Respondents fell into distinct groups in terms of pillow behavior: stackers (23 percent), plumpers (20 percent), rollers or folders (16 percent), cuddlers (16 percent), and smashers, who pound their pillows into a more comfy shape (10 percent). Women were more likely to plump, men to fold. The prevalence of stackers led the company to sell more pillows packaged as pairs, as well as to market different levels of softness or firmness.1 Marketers also have extensive information about how consumption patterns vary across and within countries. On a per capita basis, for example, the Swiss consume the most chocolate, the Czechs the most beer, the Portuguese the most wine, and the Greeks the most cigarettes. Table 3.1 summarizes these and other comparisons across countries. Consider regional differences within the United States: Seattle’s residents buy more toothbrushes per person than in any other U.S. city, people in Salt Lake City eat more candy bars, New Orleans residents use more ketchup, and people in Miami drink more prune juice.2 Table 3.1 A Global Profile of Extremes Highest fertility rate Niger 6.88 children per woman Highest education expenditure as percent of GDP Kiribati 17.8% of GDP Highest number of mobile phone subscribers China 547,286,000
- 4. Largest number of airports United States 14,951 airports Highest military expenditure as percent of GDP Oman 11.40% of GDP Largest refugee population Pakistan 21,075,000 people Highest divorce rate Aruba 4.4 divorces per 1,000 population Highest color TV ownership per 100 households United Arab Emirates 99.7 TVs Mobile telephone subscribers per capita Lithuania 138.1 subscribers per 100 people Highest cinema attendance India 1,473,400,000 cinema visits Biggest beer drinkers per capita Czech Republic 81.9 litres per capita Biggest wine drinkers per capita Portugal 33.1 litres per capita Highest number of smokers per capita Greece 8.2 cigarettes per person per day Highest GDP per person Luxembourg $87,490 Largest aid donors as % of GDP Sweden 1.03% of GDP
- 5. Most economically dependent on agriculture Liberia 66% of GDP Highest population in workforce Cayman Islands 69.20% Highest percent of women in workforce Belarus 53.30% Most crowded road networks Qatar 283.6 vehicle per km of road Most deaths in road accidents South Africa 31 killed per 100,000 population Most tourist arrivals France 79,083,000 Highest life expectancy Andorra 83.5 years Highest diabetes rate United Arab Emirates 19.5% of population aged 20–79 Source:CIA World Fact Book, https://www.cia.gov/library/publications/the-world- factbook/geos/xx.html, accessed July 24, 2009; The Economist’s Pocket World in Figures, 2009 edition, www.economist.com. A well-researched and well-executed marketing campaign for the state of Michigan increased tourism and state tax revenue. Courtesy of The Michigan Economic Development Corporation Companies with superior information can choose their markets better, develop better offerings, and execute better marketing planning. The Michigan Economic Development Corporation
- 6. (MEDC) studied the demographic information of its visitors and those of competing Midwestern cities to create a new marketing message and tourism campaign. The information helped MEDC attract 3.8 million new trips to Michigan, $805 million in new visitor spending, and $56 million in incremental state tax revenue over the period 2004–2008.3 Every firm must organize and distribute a continuous flow of information to its marketing managers. A marketing information system (MIS) consists of people, equipment, and procedures to gather, sort, analyze, evaluate, and distribute needed, timely, and accurate information to marketing decision makers. It relies on internal company records, marketing intelligence activities, and marketing research. We’ll discuss the first two components here, and the third one in the next chapter. The company’s marketing information system should be a mixture of what managers think they need, what they really need, and what is economically feasible. An internal MIS committee can interview a cross-section of marketing managers to discover their information needs. Table 3.2 displays some useful questions to ask them. Table 3.2 Information Needs Probes 1. What decisions do you regularly make? 2. What information do you need to make these decisions? 3. What information do you regularly get? 4. What special studies do you periodically request? 5. What information would you want that you are not getting now? 6. What information would you want daily? Weekly? Monthly? Yearly? 7. What online or offline newsletters, briefings, blogs, reports, or
- 7. magazines would you like to see on a regular basis? 8. What topics would you like to be kept informed of? 9. What data analysis and reporting programs would you want? 10. What are the four most helpful improvements that could be made in the present marketing information system? Internal Records To spot important opportunities and potential problems, marketing managers rely on internal reports of orders, sales, prices, costs, inventory levels, receivables, and payables. The Order-to-Payment Cycle The heart of the internal records system is the order-to-payment cycle. Sales representatives, dealers, and customers send orders to the firm. The sales department prepares invoices, transmits copies to various departments, and back-orders out-of-stock items. Shipped items generate shipping and billing documents that go to various departments. Because customers favor firms that can promise timely delivery, companies need to perform these steps quickly and accurately. Many use the Internet and extranets to improve the speed, accuracy, and efficiency of the order-to-payment cycle. Fossil Group Fossil Group Australia designs and distributes accessories and apparel globally. Its account executives lacked the latest information about pricing and inventory while taking wholesale orders. High demand items were often out of stock, creating problem for retailers. After the firm deployed a mobile sales solution that connected account executives with current inventory data, the number of sales tied up in back orders fell 80 percent. The company can now provide retailers with actual inventory levels and ship orders in hours instead of days.4 Sales Information Systems Marketing managers need timely and accurate reports on current
- 8. sales. Walmart operates a sales and inventory data warehouse that captures data on every item for every customer, every store, every day and refreshes it every hour. Consider the experience of Panasonic. Panasonic Panasonic makes digital cameras, plasma televisions, and other consumer electronics. After missing revenue goals, the company decided to adopt a vendor-managed inventory solution. Inventory distribution then came in line with consumption, and availability of products to customers jumped from 70 percent to 95 percent. The average weeks that product supply sat in Panasonic’s channels went from 25 weeks to just 5 weeks within a year, and unit sales of the targeted plasma television rose from 20,000 to approximately 100,000. Best Buy, the initial retailer covered by the vendor-managed inventory model, has since elevated Panasonic from a Tier 3 Supplier to a Tier 1 “Go- To” Brand for plasma televisions.5 Panasonic’s new vendor-managed inventory system met with marketplace success, including from retailers. Bloomberg/Getty Images, Inc. Companies that make good use of “cookies,” records of Web site usage stored on personal browsers, are smart users of targeted marketing. Many consumers are happy to cooperate: A recent survey showed that 49 percent of individuals agreed cookies are important to them when using the Internet. Not only do they not delete cookies, but they also expect customized marketing appeals and deals once they accept them. Companies must carefully interpret the sales data, however, so as not to draw the wrong conclusions. Michael Dell gave this illustration: “If you have three yellow Mustangs sitting on a dealer’s lot and a customer wants a red one, the salesman may be really good at figuring out how to sell the yellow Mustang. So the yellow Mustang gets sold, and a signal gets sent back to the factory that, hey, people want yellow Mustangs.”6
- 9. Databases, Data Warehousing, and Data Mining Companies organize their information into customer, product, and salesperson databases—and then combine their data. The customer database will contain every customer’s name, address, past transactions, and sometimes even demographics and psychographics (activities, interests, and opinions). Instead of sending a mass “carpet bombing” mailing of a new offer to every customer in its database, a company will rank its customers according to factors such as purchase recency, frequency, and monetary value (RFM) and send the offer to only the highest-scoring customers. Besides saving on mailing expenses, such manipulation of data can often achieve a double- digit response rate. Companies make these data easily accessible to their decision makers. Analysts can “mine” the data and garner fresh insights into neglected customer segments, recent customer trends, and other useful information. Managers can cross-tabulate customer information with product and salesperson information to yield still-deeper insights. Using in-house technology, Wells Fargo can track and analyze every bank transaction made by its 10 million retail customers—whether at ATMs, at bank branches, or online. When it combines transaction data with personal information provided by customers, Wells Fargo can come up with targeted offerings to coincide with a customer’s life- changing event. As a result, compared with the industry average of 2.2 products per customer, Wells Fargo sells 4 products.7 Best Buy is also taking advantage of these new rich databases. Best Buy Best Buy has assembled a 15-plus terabyte database with seven years of data on 75 million households. It captures information about every interaction—from phone calls and mouse clicks to delivery and rebate-check addresses—and then deploys sophisticated algorithms to classify over three-quarters of its customers, or more than 100 million individuals, into profiled categories such as “Buzz” (the young technology buff), “Jill”
- 10. (the suburban soccer mom), “Barry” (the wealthy professional guy), and “Ray” (the family man). The firm also applies a customer lifetime value model that measures transaction-level profitability and factors in customer behaviors that increase or decrease the value of the relationship. Knowing so much about consumers allows Best Buy to employ precision marketing and customer-triggered incentive programs with positive response rates.8 Best Buy uses a massive database to develop profiles with which to classify its customers. Bloomberg/Getty Images, Inc. Marketing Intelligence The Marketing Intelligence System A marketing intelligence system is a set of procedures and sources that managers use to obtain everyday information about developments in the marketing environment. The internal records system supplies results data, but the marketing intelligence system supplies happenings data. Marketing managers collect marketing intelligence in a variety of different ways, such as by reading books, newspapers, and trade publications; talking to customers, suppliers, and distributors; monitoring social media on the Internet; and meeting with other company managers. Before the Internet, sometimes you just had to go out in the field, literally, and watch the competition. This is what oil and gas entrepreneur T. Boone Pickens did. Describing how he learned about a rival’s drilling activity, Pickens recalls, “We would have someone who would watch [the rival’s] drilling floor from a half mile away with field glasses. Our competitor didn’t like it but there wasn’t anything they could do about it. Our spotters would watch the joints and drill pipe. They would count them; each [drill] joint was 30 feet long. By adding up all the joints, you would be able to tally the depth of the well.” Pickens knew that the deeper the well, the more costly it would be for his rival to get the oil or gas up to the surface, and this
- 11. information provided him with an immediate competitive advantage.9 Marketing intelligence gathering must be legal and ethical. In 2006, the private intelligence firm Diligence paid auditor KPMG $1.7 million for having illegally infiltrated it to acquire an audit of a Bermuda-based investment firm for a Russian conglomerate. Diligence’s cofounder posed as a British intelligence officer and convinced a member of the audit team to share confidential documents.10 A company can take eight possible actions to improve the quantity and quality of its marketing intelligence. After describing the first seven, we devote special attention to the eighth, collecting marketing intelligence on the Internet. · Train and motivate the sales force to spot and report new developments.The company must “sell” its sales force on their importance as intelligence gatherers. Grace Performance Chemicals, a division of W. R. Grace, supplies materials and chemicals to the construction and packaging industries. Its sales reps were instructed to observe the innovative ways customers used its products in order to suggest possible new products. Some were using Grace waterproofing materials to soundproof their cars and patch boots and tents. Seven new-product ideas emerged, worth millions in sales.11 · Motivate distributors, retailers, and other intermediaries to pass along important intelligence.Marketing intermediaries are often closer to the customer and competition and can offer helpful insights. ConAgra has initiated a study with some of its retailers such as Safeway, Kroger, and Walmart to study how and why people buy its foods. Finding that shoppers who bought their Orville Redenbacher and Act II brands of popcorn tended to also buy Coke, ConAgra worked with the retailers to develop in-store displays for both products. Combining retailers’ data with its own qualitative insights, ConAgra learned that many mothers switched to time-saving meals and snacks when school started. It launched its “Seasons of Mom” campaign to help grocers adjust to seasonal shifts in household needs.12
- 12. · Hire external experts to collect intelligence.Many companies hire specialists to gather marketing intelligence.13 Service providers and retailers send mystery shoppers to their stores to assess cleanliness of facilities, product quality, and the way employees treat customers. Health care facilities’ use of mystery patients has led to improved estimates of wait times, better explanations of medical procedures, and less-stressful programming on the waiting room TV.14 · Network internally and externally.The firm can purchase competitors’ products, attend open houses and trade shows, read competitors’ published reports, attend stockholders’ meetings, talk to employees, collect competitors’ ads, consult with suppliers, and look up news stories about competitors. · Set up a customer advisory panel.Members of advisory panels might include the company’s largest, most outspoken, most sophisticated, or most representative customers. For example, GlaxoSmithKline sponsors an online community devoted to weight loss and says it is learning far more than it could have gleamed from focus groups on topics from packaging its weight- loss pill to where to place in-store marketing.15 · Take advantage of government-related data resources.The U.S. Census Bureau provides an in-depth look at the population swings, demographic groups, regional migrations, and changing family structure of the estimated 304,059,724 people in the United States (as of July 1, 2008). Census marketer Nielsen Claritas cross-references census figures with consumer surveys and its own grassroots research for clients such as The Weather Channel, BMW, and Sovereign Bank. Partnering with “list houses” that provide customer phone and address information, Nielsen Claritas can help firms select and purchase mailing lists with specific clusters.16 · Purchase information from outside research firms and vendors.Well-known data suppliers include firms such as the A.C. Nielsen Company and Information Resources Inc. They collect information about product sales in a variety of categories and consumer exposure to various media. They also
- 13. gather consumer-panel data much more cheaply than marketers manage on their own. Biz360 and its online content partners, for example, provide real-time coverage and analysis of news media and consumer opinion information from over 70,000 traditional and social media sources (print, broadcast, Web sites, blogs, and message boards).17 Collecting Marketing Intelligence on the Internet Thanks to the explosion of outlets available on the Internet, online customer review boards, discussion forums, chat rooms, and blogs can distribute one customer’s experiences or evaluation to other potential buyers and, of course, to marketers seeking information about the consumers and the competition. There are five main ways marketers can research competitors’ product strengths and weaknesses online.18 · Independent customer goods and service review forums.Independent forums include Web sites such as Epinions.com, RateItAll.com, ConsumerReview.com, and Bizrate.com. Bizrate.com collects millions of consumer reviews of stores and products each year from two sources: its 1.3 million volunteer members, and feedback from stores that allow Bizrate.com to collect it directly from their customers as they make purchases. · Distributor or sales agent feedback sites.Feedback sites offer positive and negative product or service reviews, but the stores or distributors have built the sites themselves. Amazon.com offers an interactive feedback opportunity through which buyers, readers, editors, and others can review all products on the site, especially books. Elance.com is an online professional services provider that allows contractors to describe their experience and level of satisfaction with subcontractors. · Combo sites offering customer reviews and expert opinions.Combination sites are concentrated in financial services and high-tech products that require professional knowledge. ZDNet.com, an online advisor on technology products, offers customer comments and evaluations based on ease of use, features, and stability, along with expert reviews.
- 14. The advantage is that a product supplier can compare experts’ opinions with those of consumers. · Customer complaint sites.Customer complaint forums are designed mainly for dissatisfied customers. PlanetFeedback.com allows customers to voice unfavorable experiences with specific companies. Another site, Complaints.com, lets customers vent their frustrations with particular firms or offerings. · Public blogs.Tens of millions of blogs and social networks exist online, offering personal opinions, reviews, ratings, and recommendations on virtually any topic—and their numbers continue to grow. Firms such as Nielsen’s BuzzMetrics and Scout Labs analyze blogs and social networks to provide insights into consumer sentiment. Communicating and Acting on Marketing Intelligence In some companies, the staff scans the Internet and major publications, abstracts relevant news, and disseminates a news bulletin to marketing managers. The competitive intelligence function works best when it is closely coordinated with the decision-making process.19 Ticket broker StubHub monitors online activity so that when confusion arose over a rainout at a New York Yankees game, for instance, it was able to respond quickly. Getty Images, Inc. Given the speed of the Internet, it is important to act quickly on information gleaned online. Here are two companies that benefited from a proactive approach to online information:20 · When ticket broker StubHub detected a sudden surge of negative sentiment about its brand after confusion arose about refunds for a rain-delayed Yankees–Red Sox game, it jumped in to offer appropriate discounts and credits. The director of customer service observed, “This [episode] is a canary in a coal mine for us.” · When Coke’s monitoring software spotted a Twitter post that went to 10,000 followers from an upset consumer who couldn’t redeem a prize from a MyCoke rewards program, Coke quickly
- 15. posted an apology on his Twitter profile and offered to help resolve the situation. After the consumer got the prize, he changed his Twitter avatar to a photo of himself holding a Coke bottle. Analyzing the Macroenvironment Successful companies recognize and respond profitably to unmet needs and trends. Needs and Trends Enterprising individuals and companies manage to create new solutions to unmet needs. Dockers was created to meet the needs of baby boomers who could no longer fit into their jeans and wanted a physically and psychologically comfortable pair of pants. Let’s distinguish among fads, trends, and megatrends. · A fad is “unpredictable, short-lived, and without social, economic, and political significance.” A company can cash in on a fad such as Crocs clogs, Elmo TMX dolls, and Pokémon gifts and toys, but getting it right requires luck and good timing.21 · A direction or sequence of events with momentum and durability, a trend is more predictable and durable than a fad; trends reveal the shape of the future and can provide strategic direction. A trend toward health and nutrition awareness has brought increased government regulation and negative publicity for firms seen as peddling unhealthy food. Macaroni Grill revamped its menu to include more low-calorie and low-fat offerings after a wave of bad press: The Today Show called its chicken and artichoke sandwich “the calorie equivalent of 16 Fudgesicles,” and in its annual list of unhealthy restaurant dishes, Men’s Health declared its 1,630 calorie dessert ravioli the “worst dessert in America.”22 · A megatrend is a “large social, economic, political, and technological change [that] is slow to form, and once in place, influences us for some time—between seven and ten years, or longer.”23 · To help marketers spot cultural shifts that might bring new opportunities or threats, several firms offer social-cultural
- 16. forecasts. The Yankelovich Monitor interviews 2,500 people nationally each year and has tracked 35 social value and lifestyle trends since 1971, such as “anti-bigness,” “mysticism,” “living for today,” “away from possessions,” and “sensuousness.” A new market opportunity doesn’t guarantee success, of course, even if the new product is technically feasible. Market research is necessary to determine an opportunity’s profit potential. Identifying the Major Forces The end of the first decade of the new century brought a series of new challenges: the steep decline of the stock market, which affected savings, investment, and retirement funds; increasing unemployment; corporate scandals; stronger indications of global warming and other signs of deterioration in the national environment; and of course, the rise of terrorism. These dramatic events were accompanied by the continuation of many existing trends that have already profoundly influenced the global landscape.24 Firms must monitor six major forces in the broad environment: demographic, economic, social-cultural, natural, technological, and political-legal. We’ll describe them separately, but remember that their interactions will lead to new opportunities and threats. For example, explosive population growth (demographic) leads to more resource depletion and pollution (natural), which leads consumers to call for more laws (political-legal), which stimulate new technological solutions and products (technological) that, if they are affordable (economic), may actually change attitudes and behavior (social- cultural). The Demographic Environment Demographic developments often move at a fairly predictable pace. The main one marketers monitor is population, including the size and growth rate of population in cities, regions, and nations; age distribution and ethnic mix; educational levels; household patterns; and regional characteristics and movements. Worldwide Population Growth
- 17. World population growth is explosive: Earth’s population totaled 6.8 billion in 2010 and will exceed 9 billion by 2040.25Table 3.3 offers an interesting perspective.26 Table 3.3 The World as a Village If the world were a village of 100 people: • 61 villagers would be Asian (of that, 20 would be Chinese and 17 would be Indian), 14 would be African, 11 would be European, 8 would be Latin or South American, 5 would be North American, and only one of the villagers would be from Australia, Oceania, or Antarctica. • At least 18 villagers would be unable to read or write but 33 would have cellular phones and 16 would be online on the Internet. • 18 villagers would be under 10 years of age and 11 would be over 60 years old. There would be an equal number of males and females. • There would be 18 cars in the village. • 63 villagers would have inadequate sanitation. • 32 villagers would be Christians, 20 would be Muslims, 14 would be Hindus, 6 would be Buddhists, 16 would be non- religious, and the remaining 12 would be members of other religions. • 30 villagers would be unemployed or underemployed, while of those 70 who would work, 28 would work in agriculture (primary sector), 14 would work in industry (secondary sector), and the remaining 28 would work in the service sector (tertiary sector). •
- 18. 53 villagers would live on less than two U.S. dollars a day. One villager would have AIDS, 26 villagers would smoke, and 14 villagers would be obese. • By the end of a year, one villager would die and two new villagers would be born so the population would climb to 101. Source: David J. Smith and Shelagh Armstrong, If the World Were a Village: A Book About the World’s People, 2nd ed. (Tonawanda, NY: Kids Can Press, 2002). Population growth is highest in countries and communities that can least afford it. Developing regions of the world currently account for 84 percent of the world population and are growing at 1 percent to 2 percent per year; the population in developed countries is growing at only 0.3 percent.27 In developing countries, modern medicine is lowering the death rate, but the birthrate remains fairly stable. A growing population does not mean growing markets unless there is sufficient purchasing power. Care and education of children can raise the standard of living but are nearly impossible to accomplish in most developing countries. Nonetheless, companies that carefully analyze these markets can find major opportunities. Sometimes the lessons from developing markets are helping businesses in developed markets. See “Marketing Insight: Finding Gold at the Bottom of the Pyramid.” Population Age Mix Mexico has a very young population and rapid population growth. At the other extreme is Italy, with one of the world’s oldest populations. Milk, diapers, school supplies, and toys will be more important products in Mexico than in Italy. There is a global trend toward an aging population. In 1950, there were only 131 million people 65 and older; in 1995, their number had almost tripled to 371 million. By 2050, one of ten people worldwide will be 65 or older. In the United States, boomers—those born between 1946 and 1964—represent a market of some 36 million, about 12 percent of the population.
- 19. By 2011, the 65-and-over population will be growing faster than the population as a whole in each of the 50 states.28 Marketers generally divide the population into six age groups: preschool children, school-age children, teens, young adults age 20 to 40, middle-aged adults 40 to 65, and older adults 65 and older. Some marketers focus on cohorts, groups of individuals born during the same time period who travel through life together. The defining moments they experience as they come of age and become adults (roughly ages 17 through 24) can stay with them for a lifetime and influence their values, preferences, and buying behaviors. Marketing Insight: Finding Gold at the Bottom of the Pyramid Business writer C.K. Prahalad believes much innovation can come from developments in emerging markets such as China and India. He estimates there are 5 billion unserved and underserved people at the so-called “bottom of the pyramid.” One study showed that 4 billion people live on $2 or less a day. Firms operating in those markets have had to learn how to do more with less. In Bangalore, India, Narayana Hrudayalaya Hospital charges a flat fee of $1,500 for heart bypass surgery that costs 50 times as much in the United States. The hospital has low labor and operating expenses and an assembly-line view of care that has specialists focus on their own area. The approach works—the hospital’s mortality rates are half those of U.S. hospitals. Narayana also operates on hundreds of infants for free and profitably insures 2.5 million poor Indians against serious illness for 11 cents a month. Overseas firms are also finding creative solutions in developing countries. In Brazil, India, Eastern Europe, and other markets, Microsoft launched its pay-as-you-go FlexGo program, which allows users to prepay to use a fully loaded PC only for as long as wanted or needed without having to pay the full price the PC would normally command. When the payment runs out, the PC stops operating and the user prepays again to restart it.
- 20. Other firms find “reverse innovation” advantages by developing products in countries like China and India and then distributing them globally. After GE successfully introduced a $1,000 handheld electrocardiogram device for rural India and a portable, PC-based ultrasound machine for rural China, it began to sell them in the United States. Nestlé repositioned its low-fat Maggi brand dried noodles—a popular, low-priced meal for rural Pakistan and India—as a budget-friendly health food in Australia and New Zealand. Photographer: Morad Bouchakour. Courtesy of General Electric Company Sources: C.K. Prahalad, The Fortune at the Bottom of the Pyramid (Upper Saddle River, NJ: Wharton School Publishing, 2010); Bill Breen, “C.K. Prahalad: Pyramid Schemer,” Fast Company, March 2007, p. 79; Pete Engardio, “Business Prophet: How C.K. Prahalad Is Changing the Way CEOs Think,” BusinessWeek, January 23, 2006, pp. 68–73; Reena Jane, “Inspiration from Emerging Economies,” BusinessWeek, March 23 and 30, 2009, pp. 38–41; Jeffrey R. Immelt, Vijay Govindarajan, and Chris Trimble, “How GE Is Disrupting Itself,” Harvard Business Review, October 2009, pp. 56–65; Peter J. Williamson and Ming Zeng, “Value-for-Money Strategies for Recessionary Times,” Harvard Business Review, March 2009, pp. 66–74. Ethnic and Other Markets Ethnic and racial diversity varies across countries. At one extreme is Japan, where almost everyone is Japanese; at the other is the United States, where nearly 25 million people— more than 9 percent of the population—were born in another country. As of the 2000 census, the U.S. population was 72 percent White, 13 percent African American, and 11 percent Hispanic. The Hispanic population has been growing fast and is expected to make up 18.9 percent of the population by 2020; its largest subgroups are of Mexican (5.4 percent), Puerto Rican (1.1 percent), and Cuban (0.4 percent) descent. Asian
- 21. Americans constituted 3.8 percent of the U.S. population; Chinese are the largest group, followed by Filipinos, Japanese, Asian Indians, and Koreans, in that order. The growth of the Hispanic population represents a major shift in the nation’s center of gravity. Hispanics made up half of all new workers in the past decade and will account for 25 percent of workers in two generations. Despite lagging family incomes, their disposable income has grown twice as fast as the rest of the population and could reach $1.2 trillion by 2012. From the food U.S. consumers eat, to the clothing, music, and cars they buy, Hispanics are having a huge impact. Companies are scrambling to refine their products and marketing to reach this fastest-growing and most influential consumer group:29 Research by Hispanic media giant Univision suggests 70 percent of Spanish-language viewers are more likely to buy a product when it’s advertised in Spanish. Fisher- Price, recognizing that many Hispanic mothers did not grow up with its brand, shifted away from appeals to their heritage. Instead, its ads emphasize the joy of mother and child playing together with Fisher-Price toys.30 Several food, clothing, and furniture companies have directed products and promotions to one or more ethnic groups.31 Yet marketers must not overgeneralize. Within each ethnic group are consumers quite different from each other.32 For instance, a 2005 Yankelovich Monitor Multicultural Marketing study separated the African American market into six sociobehavioral segments: Emulators, Seekers, Reachers, Attainers, Elites, and Conservers. The largest and perhaps most influential are the Reachers (24 percent) and Attainers (27 percent), with very different needs. Reachers, around 40, are slowly working toward the American dream. Often single parents caring for elderly relatives, they have a median income of $28,000 and seek the greatest value for their money. Attainers have a more defined sense of self and solid plans for the future. Their median income is $55,000, and they want ideas and information to improve their quality of life.33
- 22. Diversity goes beyond ethnic and racial markets. More than 51 million U.S. consumers have disabilities, and they constitute a market for home delivery companies, such as Peapod, and for various drugstore chains. Educational Groups The population in any society falls into five educational groups: illiterates, high school dropouts, high school diplomas, college degrees, and professional degrees. Over two-thirds of the world’s 785 million illiterate adults are found in only eight countries (India, China, Bangladesh, Pakistan, Nigeria, Ethiopia, Indonesia, and Egypt); of all illiterate adults in the world, two-thirds are women.34 The United States has one of the world’s highest percentages of college-educated citizens: 54 percent of those 25 years or older have had “some college or more,” 28 percent have bachelor’s degrees, and 10 percent have advanced degrees. The large number of educated people in the United States drives strong demand for high-quality books, magazines, and travel, and creates a high supply of skills. Household Patterns The traditional household consists of a husband, wife, and children (and sometimes grandparents). Yet by 2010, only one in five U.S. households will consist of a married couple with children under 18. Other households are single live-alones (27 percent), single-parent families (8 percent), childless married couples and empty nesters (32 percent), living with nonrelatives only (5 percent), and other family structures (8 percent).35 More people are divorcing or separating, choosing not to marry, marrying later, or marrying without intending to have children. Each group has distinctive needs and buying habits. The single, separated, widowed, and divorced may need smaller apartments; inexpensive and smaller appliances, furniture, and furnishings; and smaller-size food packages.36 Nontraditional households are growing more rapidly than traditional households. Academics and marketing experts estimate that the gay and lesbian population ranges between 4 percent and 8 percent of the total U.S. population, higher in
- 23. urban areas.37 Even so-called traditional households have experienced change. Boomer dads marry later than their fathers or grandfathers did, shop more, and are much more active in raising their kids. To appeal to them, the maker of the high- concept Bugaboo stroller designed a model with a sleek look and dirt bike–style tires. Dyson, the high-end vacuum company, is appealing to dads’ inner geek by focusing on the machine’s revolutionary technology. Before Dyson entered the U.S. market, men weren’t even on the radar for vacuum cleaner sales. Now they make up 40 percent of Dyson’s customers.38 The Economic Environment The available purchasing power in an economy depends on current income, prices, savings, debt, and credit availability. As the recent economic downturn vividly demonstrated, trends affecting purchasing power can have a strong impact on business, especially for companies whose products are geared to high-income and price-sensitive consumers. Consumer Psychology Did new consumer spending patterns during the 2008–2009 recession reflect short-term, temporary adjustments or long- term, permanent changes?39 Some experts believed the recession had fundamentally shaken consumers’ faith in the economy and their personal financial situations. “Mindless” spending would be out; willingness to comparison shop, haggle, and use discounts would become the norm. Others maintained tighter spending reflected a mere economic constraint and not a fundamental behavioral change. Thus, consumers’ aspirations would stay the same, and spending would resume when the economy improves. Identifying the more likely long-term scenario—especially with the coveted 18- to 34-year-old age group—would help to direct how marketers spend their money. After six months of research and development in the baby boomer market, Starwood launched a “style at a steal” initiative to offer affordable but stylish hotel alternatives to its high-end W, Sheraton, and Westin chains. Targeting an audience seeking both thrift and luxury, it
- 24. introduced two new low-cost chains: Aloft, designed to reflect the urban cool of loft apartments, and Element, suites with every “element” of modern daily lives, including healthy food choices and spa-like bathrooms.40 Starwood’s Aloft hotel chain blends urban chic with affordable prices. Starwood Hotels & Resorts Income Distribution There are four types of industrial structures: subsistence economies like Papua New Guinea, with few opportunities for marketers; raw-material-exporting economies like Democratic Republic of Congo (copper) and Saudi Arabia (oil), with good markets for equipment, tools, supplies, and luxury goods for the rich; industrializing economies like India, Egypt, and the Philippines, where a new rich class and a growing middle class demand new types of goods; and industrial economies like Western Europe, with rich markets for all sorts of goods. Marketers often distinguish countries using five income- distribution patterns: (1) very low incomes; (2) mostly low incomes; (3) very low, very high incomes; (4) low, medium, high incomes; and (5) mostly medium incomes. Consider the market for the Lamborghini, an automobile costing more than $150,000. The market would be very small in countries with type 1 or 2 income patterns. One of the largest single markets for Lamborghinis is Portugal (income pattern 3)—one of the poorer countries in Western Europe, but with enough wealthy families to afford expensive cars. Income, Savings, Debt, and Credit Consumer expenditures are affected by income levels, savings rates, debt practices, and credit availability. U.S. consumers have a high debt-to-income ratio, which slows expenditures on housing and large-ticket items. When credit became scarcer in the recession, especially to lower-income borrowers, consumer borrowing dropped for the first time in two decades. The financial meltdown that led to this contraction was due to
- 25. overly liberal credit policies that allowed consumers to buy homes and other items they could really not afford. Marketers wanted every possible sale, banks wanted to earn interest on loans, and near financial ruin resulted. An economic issue of increasing importance is the migration of manufacturers and service jobs offshore. From India, Infosys provides outsourcing services for Cisco, Nordstrom, Microsoft, and others. The 25,000 employees the fast-growing $4 billion company hires every year receive technical, team, and communication training in Infosys’s $120 million facility outside Bangalore.41 The Sociocultural Environment From our sociocultural environment we absorb, almost unconsciously, a world view that defines our relationships to ourselves, others, organizations, society, nature, and the universe. · Views of ourselves.In the United States during the 1960s and 1970s, “pleasure seekers” sought fun, change, and escape. Others sought “self-realization.” Today, some are adopting more conservative behaviors and ambitions (see Table 3.4 for favorite consumer leisure-time activities and how they have changed, or not, in recent years). Table 3.4 Favorite Leisure- Time Activities · · 1995 · 2008 · Reading · % · 28 · % · 30 · TV watching · 25 · 24 · Spending time with family/kids · 12
- 26. · 20 · Going to movies · 8 · 8 · Fishing · 10 · 7 · Computer activities · 2 · 7 · Gardening · 9 · 5 · Renting movies · 5 · 5 · Walking · 8 · 6 · Exercise (aerobics, weights) · 2 · 8 · Source: Harris Interactive, “Spontaneous, Unaided Responses to: ‘What Are Your Two or Three Most Favorite Leisure-Time Activities?’” http://www.harrisinteractive.com/harris_poll/index.asp?PID=98 0. Base: All Adults. · Views of others.People are concerned about the homeless, crime and victims, and other social problems. At the same time, they seek those like themselves for long-lasting relationships, suggesting a growing market for social-support products and services such as health clubs, cruises, and religious activity as well as “social surrogates” like television, video games, and social networking sites. · Views of organizations.After a wave of layoffs and corporate scandals, organizational loyalty has declined.42 Companies
- 27. need new ways to win back consumer and employee confidence. They need to ensure they are good corporate citizens and that their consumer messages are honest.43 · Views of society.Some people defend society (preservers), some run it (makers), some take what they can from it (takers), some want to change it (changers), some are looking for something deeper (seekers), and still others want to leave it (escapers).44 Consumption patterns often reflect these social attitudes. Makers are high achievers who eat, dress, and live well. Changers usually live more frugally, drive smaller cars, and wear simpler clothes. Escapers and seekers are a major market for movies, music, surfing, and camping. · Views of nature.Business has responded to increased awareness of nature’s fragility and finiteness by producing wider varieties of camping, hiking, boating, and fishing gear such as boots, tents, backpacks, and accessories. · Views of the universe.Most U.S. citizens are monotheistic, although religious conviction and practice have waned through the years or been redirected into an interest in evangelical movements or Eastern religions, mysticism, the occult, and the human potential movement. Other cultural characteristics of interest to marketers are the high persistence of core cultural values and the existence of subcultures. Let’s look at both. High Persistence of Core Cultural Values Most people in the United States still believe in working, getting married, giving to charity, and being honest. Core beliefs and values are passed from parents to children and reinforced by social institutions—schools, churches, businesses, and governments. Secondary beliefs and values are more open to change. Believing in the institution of marriage is a core belief; believing people should marry early is a secondary belief. Marketers have some chance of changing secondary values, but little chance of changing core values. The nonprofit organization Mothers Against Drunk Drivers (MADD) does not
- 28. try to stop the sale of alcohol but promotes lower legal blood- alcohol levels for driving and limited operating hours for businesses that sell alcohol. Although core values are fairly persistent, cultural swings do take place. In the 1960s, hippies, the Beatles, Elvis Presley, and other cultural phenomena had a major impact on hairstyles, clothing, sexual norms, and life goals. Today’s young people are influenced by new heroes and activities: the alternative rock band Green Day, the NBA’s LeBron James, and snowboarder and skateboarder Shaun White. Ben Baker/Redux Pictures Young people may be influenced by a diverse range of heroes, from basketball player LeBron James to punk-rock band Green Day. Peter DaSilva/The New York Times/Redux Pictures Existence of Subcultures Each society contains subcultures, groups with shared values, beliefs, preferences, and behaviors emerging from their special life experiences or circumstances. Marketers have always loved teenagers because they are trendsetters in fashion, music, entertainment, ideas, and attitudes. Attract someone as a teen, and you will likely keep the person as a customer later in life. Frito-Lay, which draws 15 percent of its sales from teens, noted a rise in chip snacking by grownups. “We think it’s because we brought them in as teenagers,” said Frito-Lay’s marketing director.45 The Natural Environment In Western Europe, “green” parties have pressed for public action to reduce industrial pollution. In the United States, experts have documented ecological deterioration, and watchdog groups such as the Sierra Club and Friends of the Earth carry these concerns into political and social action. Environmental regulations hit certain industries hard. Steel companies and public utilities have invested billions of dollars
- 29. in pollution-control equipment and environmentally friendly fuels, making hybrid cars, low-flow toilets and showers, organic foods, and green office buildings everyday realities. Opportunities await those who can reconcile prosperity with environmental protection. Consider these solutions to concerns about air quality:46 · Nearly a quarter of the carbon dioxide that makes up about 80 percent of all greenhouse gases comes from electrical power plants. Dublin-based Airtricity operates wind farms in the United States and the United Kingdom that offer cheaper and greener electricity. · Transportation is second only to electricity generation as a contributor to global warming, accounting for roughly a fifth of carbon emissions. Vancouver-based Westport Innovations developed a conversion technology—high-pressure direct injection—that allows diesel engines to run on cleaner-burning liquid natural gas, reducing greenhouse emissions by a fourth. Actor and environmental activist Ed Begley Jr. examines a solar oven. Reed Saxon/AP Wide World Photos · Due to millions of rural cooking fires, parts of Southern Asia suffer extremely poor air quality. A person cooking over an open wood or kerosene fire inhales the equivalent of two packs of cigarettes a day. Illinois-based Sun Ovens International makes family-sized and institutional solar ovens that use mirrors to redirect the sun’s rays into an insulated box. Used in 130 countries, the oven both saves money and reduces greenhouse gas emissions. Corporate environmentalism recognizes the need to integrate environmental issues into the firm’s strategic plans. Trends in the natural environment for marketers to be aware of include the shortage of raw materials, especially water; the increased cost of energy; increased pollution levels; and the changing role of governments. (See also “Marketing Insight: The Green Marketing Revolution.”)47 · The earth’s raw materials consist of the infinite, the finite renewable, and the finite nonrenewable. Firms whose products
- 30. require finite nonrenewable resources—oil, coal, platinum, zinc, silver—face substantial cost increases as depletion approaches. Firms that can develop substitute materials have an excellent opportunity. · One finite nonrenewable resource, oil, has created serious problems for the world economy. As oil prices soar, companies search for practical means to harness solar, nuclear, wind, and other alternative energies. · Some industrial activity will inevitably damage the natural environment, creating a large market for pollution-control solutions such as scrubbers, recycling centers, and landfill systems as well as for alternative ways to produce and package goods. · Many poor nations are doing little about pollution, lacking the funds or the political will. It is in the richer nations’ interest to help them control their pollution, but even richer nations today lack the necessary funds. The Technological Environment It is the essence of market capitalism to be dynamic and tolerate the creative destructiveness of technology as the price of progress. Transistors hurt the vacuum-tube industry, and autos hurt the railroads. Television hurt the newspapers, and the Internet hurt them both. When old industries fight or ignore new technologies, their businesses decline. Tower Records had ample warning that its music retail business would be hurt by Internet downloads of music (as well as the growing number of discount music retailers). Its failure to respond led to the liquidation of all its domestic physical stores in 2006. Marketing Insight: The Green Marketing Revolution Consumers’ environmental concerns are real. Gallup polls reveal the percentage of U.S. adults who believe global warming will pose a serious threat during their lifetime has increased from 25 percent in 1998 to 40 percent in 2008. A Mediamark Research & Intelligence study in 2008 found that
- 31. almost two-thirds of U.S. men and women stated that “preserving the environment as a guiding principle in your life” was “very important.” A Washington Post/ABC News/Stanford University poll in 2007 found that 94 percent of respondents were “willing” to “personally change some of the things you do in order to improve the environment,” with 50 percent saying they were “very willing.” Converting this concern into concerted consumer action on the environment, however, will be a longer-term process. A 2008 TNS survey found that only 26 percent of Americans said they were “actively seeking environmentally friendly products.” A 2008 Gallup poll found that only 28 percent of respondents claimed to have made “major changes” in their own shopping and living habits over the past five years to protect the environment. Other research reported that consumers were more concerned with closer to home environmental issues such as water pollution in rivers and lakes than broader issues such as global warming. As is often the case, behavioral change is following attitudinal change for consumers. Nevertheless, as research by GfK Roper Consulting shows, consumer expectations as to corporate behavior with the environment have significantly changed, and in many cases these expectations are higher than the demands they place on themselves. Consumers vary, however, in their environmental sensitivity and can be categorized into five groups based on their degree of commitment (see Figure 3.1). Interestingly, although some marketers assume that younger people are more concerned about the environment than older consumers, some research suggests that older consumers actually take their eco- responsibilities more seriously. Figure 3.1 Consumer Environmental Segments · Genuine Greens (15%):This segment is the most likely to think and act green. Some may be true environmental activists, but most probably fall more under the category of strong advocates. This group sees few barriers to behaving green and may be open to partnering with marketers on environmental initiatives.
- 32. · Not Me Greens (18%):This segment expresses very pro-green attitudes, but its behaviors are only moderate, perhaps because these people perceive lots of barriers to living green. There may be a sense among this group that the issue is too big for them to handle, and they may need encouragement to take action. · Go-with-the-Flow Greens (17%):This group engages in some green behaviors—mostly the “easy” ones such as recycling. But being green is not a priority for them, and they seem to take the path of least resistance. This group may only take action when it’s convenient for them. · Dream Greens (13%):This segment cares a great deal about the environment, but doesn’t seem to have the knowledge or resources to take action. This group may offer the greatest opportunity to act green if given the chance. · Business First Greens (23%):This segment’s perspective is that the environment is not a huge concern and that business and industry is doing its part to help. This may explain why they don’t feel the need to take action themselves—even as they cite lots of barriers to doing so. · Mean Greens (13%):This group claims to be knowledgeable about environmental issues, but does not express pro-green attitudes or behaviors. Indeed, it is practically hostile toward pro-environmental ideas. This segment has chosen to reject prevailing notions about environmental protection and may even be viewed as a potential threat to green initiatives. Source: GfK Roper Green Gauge® 2007, GfK Roper Consulting, New York, NY. In the past, the “green marketing” programs launched by companies around specific products were not always entirely successful for several possible reasons. Consumers might have thought that the product was inferior because it was green, or that it was not even really green to begin with. Those green products that were successful, however, persuaded consumers that they were acting in their own and society’s long-run interest at the same time. Some examples were organic foods
- 33. that were seen as healthier, tastier, and safer, and energy- efficient appliances that were seen as costing less to run. There are some expert recommendations as to how to avoid “green marketing myopia” by focusing on consumer value positioning, calibration of consumer knowledge, and the credibility of product claims. One challenge with green marketing is the difficulty consumers have in understanding the environmental benefits of products, leading to many accusations of “greenwashing” where products are not nearly as green and environmentally beneficial as their marketing might suggest. Although there have been green products emphasizing their natural benefits for years—Tom’s of Maine, Burt’s Bees, Stonyfield Farm, and Seventh Generation to name just a few— products offering environmental benefits are becoming more mainstream. Part of the success of Clorox Green Works cleaning products and household cleaning products, launched in January 2008, was that it found the sweet spot of a target market wanting to take smaller steps toward a greener lifestyle and matched that with a green product with a very modest price premium and sold through a grassroots marketing program. Environmental concerns are affecting how virtually every major company does their business: Walt Disney Corp. has pledged to reduce its solid waste by 2013, conserve millions of gallons of water, invest in renewable energy, and become completely carbon neutral (reaching 50 percent of that goal by 2012); Best Buy has expanded its recycling program for electronics; Caterpillar announced plans to reduce the GHG emissions of its entire product line by 20 percent by 2020; and Whole Foods, a leader among national supermarket chains in selling certified “organic food” already, cofounded a partnership to reduce emissions from grocery refrigerators and offsets 100 percent of its electricity use with renewable energy via wind-energy credits. Toyota, HP, IKEA, Procter & Gamble, and Walmart have all been linked to high-profile environmental and sustainability programs. Some other marketers, fearing harsh scrutiny or
- 34. unrealistic expectations, keep a lower profile. Even though Nike uses recycled sneakers in its soles of new shoes, they chose not to publicize that fact so that they can keep their focus on performance and winning. The rules of the game in green marketing are changing rapidly as both consumers and companies respond to problems and proposed solutions to the significant environmental problems that exist. Clorox’s Green Works has been a huge market hit by combining environmental benefits with affordability. Michelle Pemberton/Indianapolis Star/Rapport Press/Newscom Sources: Jerry Adler, “Going Green,” Newsweek, July 17, 2006, pp. 43–52; Jacquelyn A. Ottman, Edwin R. Stafford, and Cathy L. Hartman, “Avoiding Green Marketing Myopia,” Environment (June 2006): 22–36; Jill Meredith Ginsberg and Paul N. Bloom, “Choosing the Right Green Marketing Strategy,” MIT Sloan Management Review (Fall 2004): 79–84; Jacquelyn Ottman, Green Marketing: Opportunity for Innovation, 2nd ed. (New York: BookSurge Publishing, 2004); Mark Dolliver, “Deflating a Myth,” Brandweek, May 12, 2008, pp. 30–31; “Winner: Corporate Sustainability, Walt Disney Worldwide,” Travel and Leisure, November 2009, p. 106; “The Greenest Big Companies in America, Newsweek, September 28, 2009, pp. 34–53; Sarah Mahoney, “Best Buy Connects Green with Thrift,” Media Post News: Marketing Daily, January 28, 2009; Reena Jana, “Nike Quietly Goes Green,” BusinessWeek, June 11, 2009. Major new technologies stimulate the economy’s growth rate. Unfortunately, between innovations, an economy can stagnate. Minor innovations fill the gap—new supermarket products such as frozen waffles, body washes, and energy bars might pop up— but while lower risk, they can also divert research effort away from major breakthroughs. Innovation’s long-run consequences are not always foreseeable. The contraceptive pill reduced family size and thus increased discretionary incomes, also raising spending on vacation travel, durable goods, and luxury items. Cell phones, video games, and
- 35. the Internet are reducing attention to traditional media, as well as face-to-face social interaction as people listen to music or watch a movie on their cell phones. Marketers should monitor the following technology trends: the accelerating pace of change, unlimited opportunities for innovation, varying R&D budgets, and increased regulation of technological change. Accelerating Pace of Change More ideas than ever are in the works, and the time between idea and implementation is shrinking. So is the time between introduction and peak production. Apple ramped up in seven years to sell a staggering 220 million iPods worldwide by September 2009. Unlimited Opportunities for Innovation Some of the most exciting work today is taking place in biotechnology, computers, microelectronics, telecommunications, robotics, and designer materials. Researchers are working on AIDS vaccines, safer contraceptives, and nonfattening foods. They are developing new classes of antibiotics to fight ultra-resistant infections, superheating furnaces to reduce trash to raw materials, and building miniature water-treatment plants for remote locations.48 Varying R&D Budgets A growing portion of U.S. R&D expenditures goes to the development as opposed to the research side, raising concerns about whether the United States can maintain its lead in basic science. Many companies put their money into copying competitors’ products and making minor feature and style improvements. Even basic research companies such as Dow Chemical, Bell Laboratories, and Pfizer are proceeding cautiously, and more consortiums than single companies are directing research efforts toward major breakthroughs. Increased Regulation of Technological Change Government has expanded its agencies’ powers to investigate and ban potentially unsafe products. In the United States, the
- 36. Food and Drug Administration (FDA) must approve all drugs before they can be sold. Safety and health regulations have increased for food, automobiles, clothing, electrical appliances, and construction. The Political-Legal Environment The political and legal environment consists of laws, government agencies, and pressure groups that influence various organizations and individuals. Sometimes these laws create new business opportunities. Mandatory recycling laws have boosted the recycling industry and launched dozens of new companies making new products from recycled materials. Two major trends are the increase in business legislation and the growth of special-interest groups. Text messaging is profoundly changing how consumers choose to communicate. Blend Images/Alamy Images Increase in Business Legislation Business legislation is intended to protect companies from unfair competition, protect consumers from unfair business practices, protect society from unbridled business behavior, and charge businesses with the social costs of their products or production processes. Each new law may also have the unintended effect of sapping initiative and slowing growth. The European Commission has established new laws covering competitive behavior, product standards, product liability, and commercial transactions for the 27 member nations of the European Union. The United States has many consumer protection laws covering competition, product safety and liability, fair trade and credit practices, and packaging and labeling, but many countries’ laws are stronger.49 Norway bans several forms of sales promotion—trading stamps, contests, and premiums—as inappropriate or unfair. Thailand requires food processors selling national brands to market low-price brands also, so low-income consumers can find economy brands. In India, food companies need special approval to launch duplicate
- 37. brands, such as another cola drink or brand of rice. As more transactions take place in cyberspace, marketers must establish new ways to do business ethically. Growth of Special-Interest Groups Political action committees (PACs) lobby government officials and pressure business executives to respect the rights of consumers, women, senior citizens, minorities, and gays and lesbians. Insurance companies directly or indirectly affect the design of smoke detectors; scientific groups affect the design of spray products. Many companies have established public affairs departments to deal with these groups and issues. The consumerist movement organized citizens and government to strengthen the rights and powers of buyers in relationship to sellers. Consumerists have won the right to know the real cost of a loan, the true cost per standard unit of competing brands (unit pricing), the basic ingredients and true benefits of a product, and the nutritional quality and freshness of food. Privacy issues and identity theft will remain public policy hot buttons as long as consumers are willing to swap personal information for customized products—from marketers they trust.50 Consumers worry they will be robbed or cheated; that private information will be used against them; that they will be bombarded by solicitations; and that children will be targeted.51 Wise companies establish consumer affairs departments to formulate policies and resolve complaints. Forecasting and Demand Measurement Understanding the marketing environment and conducting marketing research (described in Chapter 4) can help to identify marketing opportunities. The company must then measure and forecast the size, growth, and profit potential of each new opportunity. Sales forecasts prepared by marketing are used by finance to raise cash for investment and operations; by manufacturing to establish capacity and output; by purchasing to acquire the right amount of supplies; and by human resources to hire the needed workers. If the forecast is off the mark, the company will face excess or inadequate inventory. Since it’s
- 38. based on estimates of demand, managers need to define what they mean by market demand. Although DuPont’s Performance Materials group knows DuPont Tyvek has 70 percent of the $100 million market for air-barrier membranes, they see greater opportunity with more products and services to tap into the entire $7 billion U.S. home construction market.52 The Measures of Market Demand Companies can prepare as many as 90 different types of demand estimates for six different product levels, five space levels, and three time periods (see Figure 3.2). Each demand measure serves a specific purpose. A company might forecast short-run demand to order raw materials, plan production, and borrow cash. It might forecast regional demand to decide whether to set up regional distribution. Figure 3.2 Ninety Types of Demand Measurement (6 × 5 × 3) There are many productive ways to break down the market: · The potential market is the set of consumers with a sufficient level of interest in a market offer. However, their interest is not enough to define a market unless they also have sufficient income and access to the product. · The available market is the set of consumers who have interest, income, and access to a particular offer. The company or government may restrict sales to certain groups; a particular state might ban motorcycle sales to anyone under 21 years of age. Eligible adults constitute the qualified available market— the set of consumers who have interest, income, access, and qualifications for the market offer. · The target market is the part of the qualified available market the company decides to pursue. The company might concentrate its marketing and distribution effort on the East Coast. · The penetrated market is the set of consumers who are buying the company’s product. These definitions are a useful tool for market planning. If the company isn’t satisfied with its current sales, it can try to attract a larger percentage of buyers from its target market. It
- 39. can lower the qualifications for potential buyers. It can expand its available market by opening distribution elsewhere or lowering its price, or it can reposition itself in the minds of its customers. A Vocabulary for Demand Measurement The major concepts in demand measurement are market demand and company demand. Within each, we distinguish among a demand function, a sales forecast, and a potential. Market Demand The marketer’s first step in evaluating marketing opportunities is to estimate total market demand. Market demand for a product is the total volume that would be bought by a defined customer group in a defined geographical area in a defined time period in a defined marketing environment under a defined marketing program. Market demand is not a fixed number, but rather a function of the stated conditions. For this reason, we call it the market demand function. Its dependence on underlying conditions is illustrated in Figure 3.3(a). The horizontal axis shows different possible levels of industry marketing expenditure in a given time period. The vertical axis shows the resulting demand level. The curve represents the estimated market demand associated with varying levels of marketing expenditure. Figure 3.3 Market Demand Functions Some base sales—called the market minimum and labeled Q1 in the figure—would take place without any demand-stimulating expenditures. Higher marketing expenditures would yield higher levels of demand, first at an increasing rate, then at a decreasing rate. Take fruit juices. Given the indirect competition they face from other types of beverages, we would expect increased marketing expenditures to help fruit juice products stand out and increase demand and sales. Marketing expenditures beyond a certain level would not stimulate much further demand, suggesting an upper limit called the market potential and labeled Q2 in the figure.
- 40. The distance between the market minimum and the market potential shows the overall marketing sensitivity of demand. We can think of two extreme types of markets, the expansible and the nonexpansible. An expansible market, such as the market for racquetball playing, is very much affected in size by the level of industry marketing expenditures. In terms of Figure 3.3(a), the distance between Q1 and Q2 is relatively large. A nonexpansible market—for example, the market for weekly trash or garbage removal—is not much affected by the level of marketing expenditures; the distance between Q1 and Q2 is relatively small. Organizations selling in a nonexpansible market must accept the market’s size—the level of primary demand for the product class—and direct their efforts toward winning a larger market share for their product, that is, a higher level of selective demand for their product. It pays to compare the current and potential levels of market demand. The result is the market-penetration index. A low index indicates substantial growth potential for all the firms. A high index suggests it will be expensive to attract the few remaining prospects. Generally, price competition increases and margins fall when the market-penetration index is already high. Comparing current and potential market shares yields a firm’s share-penetration index. If this index is low, the company can greatly expand its share. Holding it back could be low brand awareness, low availability, benefit deficiencies, or high price. A firm should calculate the share-penetration increases from removing each factor, to see which investments produce the greatest improvement.53 Remember the market demand function is not a picture of market demand over time. Rather, it shows alternative current forecasts of market demand associated with possible levels of industry marketing effort. Market Forecast Only one level of industry marketing expenditure will actually occur. The market demand corresponding to this level is called the market forecast.
- 41. Market Potential The market forecast shows expected market demand, not maximum market demand. For the latter, we need to visualize the level of market demand resulting from a very high level of industry marketing expenditure, where further increases in marketing effort would have little effect. Market potential is the limit approached by market demand as industry marketing expenditures approach infinity for a given marketing environment. The phrase “for a given market environment” is crucial. Consider the market potential for automobiles. It’s higher during prosperity than during a recession. The dependence of market potential on the environment is illustrated in Figure 3.3(b). Market analysts distinguish between the position of the market demand function and movement along it. Companies cannot do anything about the position of the market demand function, which is determined by the marketing environment. However, they influence their particular location on the function when they decide how much to spend on marketing. Companies interested in market potential have a special interest in the product-penetration percentage, the percentage of ownership or use of a product or service in a population. Companies assume that the lower the product-penetration percentage, the higher the market potential, although this also assumes everyone will eventually be in the market for every product. Company Demand Company demand is the company’s estimated share of market demand at alternative levels of company marketing effort in a given time period. It depends on how the company’s products, services, prices, and communications are perceived relative to the competitors’. Other things equal, the company’s market share depends on the relative scale and effectiveness of its market expenditures. Marketing model builders have developed sales response functions to measure how a company’s sales are affected by its marketing expenditure level, marketing mix, and
- 42. marketing effectiveness.54 Company Sales Forecast Once marketers have estimated company demand, their next task is to choose a level of marketing effort. The company sales forecast is the expected level of company sales based on a chosen marketing plan and an assumed marketing environment. We represent the company sales forecast graphically with sales on the vertical axis and marketing effort on the horizontal axis, as in Figure 3.3. We often hear that the company should develop its marketing plan on the basis of its sales forecast. This forecast-to-plan sequence is valid if forecast means an estimate of national economic activity, or if company demand is nonexpansible. The sequence is not valid, however, where market demand is expansible or where forecast means an estimate of company sales. The company sales forecast does not establish a basis for deciding what to spend on marketing. On the contrary, the sales forecast is the result of an assumed marketing expenditure plan. Two other concepts are important here. A sales quota is the sales goal set for a product line, company division, or sales representative. It is primarily a managerial device for defining and stimulating sales effort, often set slightly higher than estimated sales to stretch the sales force’s effort. A sales budget is a conservative estimate of the expected volume of sales, primarily for making current purchasing, production, and cash flow decisions. It’s based on the need to avoid excessive risk and is generally set slightly lower than the sales forecast. Company Sales Potential Company sales potential is the sales limit approached by company demand as company marketing effort increases relative to that of competitors. The absolute limit of company demand is, of course, the market potential. The two would be equal if the company got 100 percent of the market. In most cases, company sales potential is less than the market potential, even when company marketing expenditures increase considerably.
- 43. Each competitor has a hard core of loyal buyers unresponsive to other companies’ efforts to woo them. Estimating Current Demand We are now ready to examine practical methods for estimating current market demand. Marketing executives want to estimate total market potential, area market potential, and total industry sales and market shares. Total Market Potential Total market potential is the maximum sales available to all firms in an industry during a given period, under a given level of industry marketing effort and environmental conditions. A common way to estimate total market potential is to multiply the potential number of buyers by the average quantity each purchases, times the price. If 100 million people buy books each year, and the average book buyer buys three books a year at an average price of $20 each, then the total market potential for books is $6 billion (100 million × 3 × $20). The most difficult component to estimate is the number of buyers. We can always start with the total population in the nation, say, 261 million people. Next we eliminate groups that obviously would not buy the product. Assume illiterate people and children under 12 don’t buy books and constitute 20 percent of the population. This means 80 percent of the population, or 209 million people, are in the potentials pool. Further research might tell us that people of low income and low education don’t buy books, and they constitute over 30 percent of the potentials pool. Eliminating them, we arrive at a prospect pool of approximately 146.3 million book buyers. We use this number to calculate total market potential. A variation on this method is the chain-ratio method, which multiplies a base number by several adjusting percentages. Suppose a brewery is interested in estimating the market potential for a new light beer especially designed to accompany food. It can make an estimate with the following calculation: Demand for the new light beer
- 44. × Population × Average percentage of personal discretionary income per capita spent on food × Average percentage of amount spent on food that is spent on beverages × Average percentage of amount spent on beverages that is spent on alcoholic beverages × Average percentage of amount spent on alcoholic beverages that is spent on beer × Expected percentage of amount spent on beer that will be spent on light beer Area Market Potential Because companies must allocate their marketing budget optimally among their best territories, they need to estimate the market potential of different cities, states, and nations. Two major methods are the market-buildup method, used primarily by business marketers, and the multiple-factor index method, used primarily by consumer marketers. Market-Buildup Method The market-buildup method calls for identifying all the potential buyers in each market and estimating their potential purchases. It produces accurate results if we have a list of all potential buyers and a good estimate of what each will buy. Unfortunately, this information is not always easy to gather. Consider a machine-tool company that wants to estimate the area market potential for its wood lathe in the Boston area. Its first step is to identify all potential buyers of wood lathes in the area, primarily manufacturing establishments that shape or ream wood as part of their operations. The company could compile a list from a directory of all manufacturing establishments in the
- 45. area. Then it could estimate the number of lathes each industry might purchase, based on the number of lathes per thousand employees or per $1 million of sales in that industry. An efficient method of estimating area market potentials makes use of the North American Industry Classification System (NAICS), developed by the U.S. Bureau of the Census in conjunction with the Canadian and Mexican governments.55 The NAICS classifies all manufacturing into 20 major industry sectors and further breaks each sector into a six-digit, hierarchical structure as follows. 51 Industry sector (information) 513 Industry subsector (broadcasting and telecommunications) 5133 Industry group (telecommunications) 51332 Industry (wireless telecommunications carriers, except satellite) 513321 National industry (U.S. paging) For each six-digit NAICS number, a company can purchase CD- ROMs of business directories that provide complete company profiles of millions of establishments, subclassified by location, number of employees, annual sales, and net worth. To use the NAICS, the lathe manufacturer must first determine the six-digit NAICS codes that represent products whose manufacturers are likely to require lathe machines. To get a full picture of all six-digit NAICS industries that might use lathes, the company can (1) determine past customers’ NAICS codes; (2) go through the NAICS manual and check off all the six-digit industries that might have an interest in lathes; (3) mail questionnaires to a wide range of companies inquiring about their interest in wood lathes. The company’s next task is to determine an appropriate base for estimating the number of lathes each industry will use. Suppose customer industry sales are the most appropriate base. Once the
- 46. company estimates the rate of lathe ownership relative to the customer industry’s sales, it can compute the market potential. Multiple-Factor Index Method Like business marketers, consumer companies also need to estimate area market potentials, but since their customers are too numerous to list they commonly use a straightforward index. A drug manufacturer might assume the market potential for drugs is directly related to population size. If the state of Virginia has 2.55 percent of the U.S. population, Virginia might be a market for 2.55 percent of total drugs sold. A single factor is rarely a complete indicator of sales opportunity. Regional drug sales are also influenced by per capita income and the number of physicians per 10,000 people. Thus, it makes sense to develop a multiple-factor index and assign each factor a specific weight. Suppose Virginia has 2.00 percent of U.S. disposable personal income, 1.96 percent of U.S. retail sales, and 2.28 percent of U.S. population, and the respective weights are 0.5, 0.3, and 0.2. The buying-power index for Virginia is then 2.04 [0.5(2.00) + 0.3(1.96) + 0.2(2.28)]. Thus 2.04 percent of the nation’s drug sales (not 2.28 percent) might be expected to take place in Virginia. The weights in the buying-power index are somewhat arbitrary, and companies can assign others if appropriate. A manufacturer might adjust the market potential for additional factors, such as competitors’ presence, local promotional costs, seasonal factors, and market idiosyncrasies. Many companies compute area indexes to allocate marketing resources. Suppose the drug company is reviewing the six cities listed in Table 3.5. The first two columns show its percentage of U.S. brand and category sales in these six cities. Column 3 shows the brand development index (BDI), the index of brand sales to category sales. Seattle has a BDI of 114 because the brand is relatively more developed than the category in Seattle. Portland’s BDI is 65, which means the brand is relatively underdeveloped there. Table 3.5 Calculating the Brand Development Index (BDI)
- 47. (a) Percent of U.S. Brand (b) Percent of U.S. Category BDI Territory Sales Sales (a ÷ b) × 100 Seattle 3.09 2.71 114 Portland 6.74 10.41 65 Boston 3.49 3.85 91 Toledo .97 .81 120 Chicago 1.13 .81 140 Baltimore 3.12 3.00 104 Normally, the lower the BDI, the higher the market opportunity, in that there is room to grow the brand. Other marketers would argue instead that marketing funds should go into the brand’s strongest markets, where it might be important to reinforce
- 48. loyalty or more easily capture additional brand share. Investment decisions should be based on the potential to grow brand sales. Feeling it was underperforming in a high-potential market, Anheuser-Busch targeted the growing Hispanic population in Texas with a number of special marketing activities. Cross-promotions with Budweiser and Clamato tomato clam cocktail (to mix the popular Michiladas drink), sponsorship of the Esta Noche Toca concert series, and support of Latin music acts with three-on-three soccer tournaments helped drive higher sales.56 After the company decides on the city-by-city allocation of its budget, it can refine each city allocation down to census tracts or zip+4 code centers. Census tracts are small, locally defined statistical areas in metropolitan areas and some other counties. They generally have stable boundaries and a population of about 4,000. Zip+4 code centers (designed by the U.S. Post Office) are a little larger than neighborhoods. Data on population size, median family income, and other characteristics are available for these geographical units. Using other sources such as loyalty card data, Mediabrands’s Geomentum targets “hyper-local” sectors of zip codes, city blocks, or even individual households with ad messages delivered via interactive TV, zoned editions of newspapers, Yellow Pages, outdoor media, and local Internet searches.57 Industry Sales and Market Shares Besides estimating total potential and area potential, a company needs to know the actual industry sales taking place in its market. This means identifying competitors and estimating their sales. The industry trade association will often collect and publish total industry sales, although it usually does not list individual company sales separately. With this information, however, each company can evaluate its own performance against the industry’s. If a company’s sales are increasing by 5 percent a year and industry sales are increasing by 10 percent, the company is losing its relative standing in the industry.
- 49. Another way to estimate sales is to buy reports from a marketing research firm that audits total sales and brand sales. Nielsen Media Research audits retail sales in various supermarket and drugstore product categories. A company can purchase this information and compare its performance to the total industry or any competitor to see whether it is gaining or losing share, overall or brand by brand. Because distributors typically will not supply information about how much of competitors’ products they are selling, business-to-business marketers operate with less knowledge of their market share results. Estimating Future Demand The few products or services that lend themselves to easy forecasting generally enjoy an absolute level or a fairly constant trend, and competition that is either nonexistent (public utilities) or stable (pure oligopolies). In most markets, in contrast, good forecasting is a key factor in success. Companies commonly prepare a macroeconomic forecast first, followed by an industry forecast, followed by a company sales forecast. The macroeconomic forecast projects inflation, unemployment, interest rates, consumer spending, business investment, government expenditures, net exports, and other variables. The end result is a forecast of gross domestic product (GDP), which the firm uses, along with other environmental indicators, to forecast industry sales. The company derives its sales forecast by assuming it will win a certain market share. How do firms develop their forecasts? They may create their own or buy forecasts from outside sources such as marketing research firms, which interview customers, distributors, and other knowledgeable parties. Specialized forecasting firms produce long-range forecasts of particular macroenvironmental components, such as population, natural resources, and technology. Examples are IHS Global Insight (a merger of Data Resources and Wharton Econometric Forecasting Associates), Forrester Research, and the Gartner Group. Futurist research firms produce speculative scenarios; three such firms are the
- 50. Institute for the Future, Hudson Institute, and the Futures Group. All forecasts are built on one of three information bases: what people say, what people do, or what people have done. Using what people say requires surveying buyers’ intentions, composites of sales force opinions, and expert opinion. Building a forecast on what people do means putting the product into a test market to measure buyer response. To use the final basis— what people have done—firms analyze records of past buying behavior or use time-series analysis or statistical demand analysis. Survey of Buyers’ Intentions Forecasting is the art of anticipating what buyers are likely to do under a given set of conditions. For major consumer durables such as appliances, research organizations conduct periodic surveys of consumer buying intentions, ask questions like Do you intend to buy an automobile within the next six months? and put the answers on a purchase probability scale: 0.00 0.20 0.40 0.60 0.80 1.00 No chance Slight possibility Fair possibility Good possibility High possibility Certain Surveys also inquire into consumers’ present and future personal finances and expectations about the economy. They combine bits of information into a consumer confidence measure (Conference Board) or a consumer sentiment measure (Survey Research Center of the University of Michigan). For business buying, research firms can carry out buyer-
- 51. intention surveys for plant, equipment, and materials, usually falling within a 10 percent margin of error. These surveys are useful in estimating demand for industrial products, consumer durables, product purchases where advanced planning is required, and new products. Their value increases to the extent that buyers are few, the cost of reaching them is low, and they have clear intentions they willingly disclose and implement. Composite of Sales Force Opinions When buyer interviewing is impractical, the company may ask its sales representatives to estimate their future sales. Few companies use these estimates without making some adjustments, however. Sales representatives might be pessimistic or optimistic, they might not know how their company’s marketing plans will influence future sales in their territory, and they might deliberately underestimate demand so the company will set a low sales quota. To encourage better estimating, the company could offer incentives or assistance, such as information about marketing plans or past forecasts compared to actual sales. Sales force forecasts yield a number of benefits. Sales reps might have better insight into developing trends than any other group, and forecasting might give them greater confidence in their sales quotas and more incentive to achieve them. A “grassroots” forecasting procedure provides detailed estimates broken down by product, territory, customer, and sales rep. Expert Opinion Companies can also obtain forecasts from experts, including dealers, distributors, suppliers, marketing consultants, and trade associations. Dealer estimates are subject to the same strengths and weaknesses as sales force estimates. Many companies buy economic and industry forecasts from well-known economic- forecasting firms that have more data available and more forecasting expertise. Occasionally, companies will invite a group of experts to prepare a forecast. The experts exchange views and produce an estimate as a group (group-discussion method) or individually,
- 52. in which case another analyst might combine them into a single estimate (pooling of individual estimates). Further rounds of estimating and refining follow (the Delphi method).58 Past-Sales Analysis Firms can develop sales forecasts on the basis of past sales. Time-series analysis breaks past time series into four components (trend, cycle, seasonal, and erratic) and projects them into the future. Exponential smoothing projects the next period’s sales by combining an average of past sales and the most recent sales, giving more weight to the latter. Statistical demand analysis measures the impact of a set of causal factors (such as income, marketing expenditures, and price) on the sales level. Finally, econometric analysis builds sets of equations that describe a system and statistically derives the different parameters that make up the equations statistically. Market-Test Method When buyers don’t plan their purchases carefully, or experts are unavailable or unreliable, a direct-market test can help forecast new-product sales or established product sales in a new distribution channel or territory. (We discuss market testing in detail in Chapter 20.) Summary 1. To carry out their analysis, planning, implementation, and control responsibilities, marketing managers need a marketing information system (MIS). The role of the MIS is to assess the managers’ information needs, develop the needed information, and distribute that information in a timely manner. 2. An MIS has three components: (a) an internal records system, which includes information on the order-to-payment cycle and sales information systems; (b) a marketing intelligence system, a set of procedures and sources used by managers to obtain everyday information about pertinent developments in the marketing environment; and (c) a marketing research system that allows for the systematic design, collection, analysis, and reporting of data and findings relevant to a specific marketing situation.
- 53. 3. Marketers find many opportunities by identifying trends (directions or sequences of events that have some momentum and durability) and megatrends (major social, economic, political, and technological changes that have long-lasting influence). 4. Within the rapidly changing global picture, marketers must monitor six major environmental forces: demographic, economic, social-cultural, natural, technological, and political- legal. 5. In the demographic environment, marketers must be aware of worldwide population growth; changing mixes of age, ethnic composition, and educational levels; the rise of nontraditional families; and large geographic shifts in population. 6. In the economic arena, marketers need to focus on income distribution and levels of savings, debt, and credit availability. 7. In the social-cultural arena, marketers must understand people’s views of themselves, others, organizations, society, nature, and the universe. They must market products that correspond to society’s core and secondary values and address the needs of different subcultures within a society. 8. In the natural environment, marketers need to be aware of the public’s increased concern about the health of the environment. Many marketers are now embracing sustainability and green marketing programs that provide better environmental solutions as a result. 9. In the technological arena, marketers should take account of the accelerating pace of technological change, opportunities for innovation, varying R&D budgets, and the increased governmental regulation brought about by technological change. 10. In the political-legal environment, marketers must work within the many laws regulating business practices and with various special-interest groups. 11. There are two types of demand: market demand and company demand. To estimate current demand, companies attempt to determine total market potential, area market potential, industry sales, and market share. To estimate future
- 54. demand, companies survey buyers’ intentions, solicit their sales force’s input, gather expert opinions, analyze past sales, or engage in market testing. Mathematical models, advanced statistical techniques, and computerized data collection procedures are essential to all types of demand and sales forecasting. Applications Marketing Debate Is Consumer Behavior More a Function of a Person’s Age or Generation? One of the widely debated issues in developing marketing programs that target certain age groups is how much consumers change over time. Some marketers maintain that age differences are critical and that the needs and wants of a 25-year-old in 2010 are not that different from those of a 25-year-old in 1980. Others argue that cohort and generation effects are critical, and that marketing programs must therefore suit the times. Take a position: Age differences are fundamentally more important than cohort effectsversusCohort effects can dominate age differences. Marketing Discussion Age Targeting What brands and products do you feel successfully “speak to you” and effectively target your age group? Why? Which ones do not? What could they do better? Marketing Excellence: >>Microsoft James M. Phelps, Jr./Shutterstock Microsoft is the world’s most successful software company. The company was founded by Bill Gates and Paul Allen in 1975 with the original mission of having “a computer on every desk and in every home, running Microsoft software.” Since then, Microsoft has grown to become the third most valuable brand in the world through strategic marketing and aggressive growth tactics. Microsoft’s first significant success occurred in the early 1980s
- 55. with the creation of the DOS operating system for IBM computers. The company used this initial success with IBM to sell software to other manufacturers, quickly making Microsoft a major player in the industry. Initial advertising efforts focused on communicating the company’s range of products from DOS to the launch of Excel and Windows—all under a unified “Microsoft” look. Microsoft went public in 1986 and grew tremendously over the next decade as the Windows operating system and Microsoft Office took off. In 1990, Microsoft launched a completely revamped version of its operating system and named it Windows 3.0. Windows 3.0 offered an improved set of Windows icons and applications like File Manager and Program Manager that are still used today. It was an instant success; Microsoft sold more than 10 million copies of the software within two years—a phenomenon in those days. In addition, Windows 3.0 became the first operating system to be preinstalled on certain PCs, marking a major milestone in the industry and for Microsoft. Throughout the 1990s, Microsoft’s communication efforts convinced businesses that its software was not only the best choice for business but also that it needed to be upgraded frequently. Microsoft spent millions of dollars in magazine advertising and received endorsements from the top computer magazines in the industry, making Microsoft Windows and Office the must-have software of its time. Microsoft successfully launched Windows 95 in 1995 and Windows 98 in 1998, using the slogan, “Where Do You Want to Go Today?” The slogan didn’t push individual products but rather the company itself, which could help empower companies and consumers alike. During the late 1990s, Microsoft entered the notorious “browser wars” as companies struggled to find their place during the Internet boom. In 1995, Netscape launched its Navigator browser over the Internet. Realizing what a good product Netscape had, Microsoft launched the first version of its own browser, Internet Explorer, later that same year. By 1997,
- 56. Netscape held a 72 percent share and Explorer an 18 percent share. Five years later, however, Netscape’s share had fallen to 4 percent. During those five years, Microsoft took three major steps to overtake the competition. First, it bundled Internet Explorer with its Office product, which included Excel, Word, and PowerPoint. Automatically, consumers who wanted MS Office became Explorer users as well. Second, Microsoft partnered with AOL, which opened the doors to 5 million new consumers almost overnight. And, finally, Microsoft used its deep pockets to ensure that Internet Explorer was available free, essentially “cutting off Netscape’s air supply.” These efforts, however, were not without controversy. Microsoft faced antitrust charges in 1998 and numerous lawsuits based on its marketing tactics, and some perceived that it was monopolizing the industry. Charges aside, the company’s stock took off, peaking in 1999 at $60 per share. Microsoft released Windows 2000 in 2000 and Windows XP in 2001. It also launched Xbox in 2001, marking the company’s entrance into the multibillion-dollar gaming industry. Over the next several years, Microsoft’s stock price dipped by over $40 a share as consumers waited for the next operating system and Apple made a significant comeback with several new Mac computers, the iPod, the iPhone, and iTunes. Microsoft launched the Vista operating system in 2007 to great expectations; however, it was plagued with bugs and problems. As the recession worsened in 2008, the company found itself in a bind. Its brand image was tarnished from years of Apple’s successful “Get a Mac” campaign, a series of commercials that featured a smart, creative, easygoing Mac character alongside a geeky, virus-prone, uptight PC character. In addition, consumers and analysts continued to slam Vista for its poor performance. In response, Microsoft created a campaign entitled “Windows. Life Without Walls” to help turn its image around. The company focused on how cost effective computers with its
- 57. software were, a message that resonated well in the recession. It launched a series of commercials boasting “I’m a PC” that began with a Microsoft employee (looking very similar to the PC character from the Apple ads) stating, “Hello, I’m a PC and I’ve been made into a stereotype.” The commercials, which highlighted a wide variety of individuals who prided themselves on being PC owners, helped improve employee morale and customer loyalty. Microsoft opened a handful of retail stores—similar to Apple stores—in 2009. “The purpose of opening these stores is to create deeper engagement with consumers and continue to learn firsthand about what they want and how they buy,” Microsoft said in a statement. Today, the company offers a wide range of software and home entertainment products. In the ongoing browser wars, Internet Explorer holds a 66 percent market share compared to Firefox’s 22 percent and Safari’s 8 percent. In 2009, Microsoft launched a new search engine called Bing, which challenges Google’s dominant position in the marketplace and claims to give better search results. Microsoft’s most profitable products continue to be Microsoft Windows and Microsoft Office, which bring in approximately 90 percent of the company’s $60 billion in revenue. Questions 1. Evaluate Microsoft’s strategy in good and poor economic times. 2. Discuss the pros and cons of Microsoft’s most recent “I’m a PC” campaign. Is Microsoft doing a good thing by acknowledging Apple’s campaign in its own marketing message? Why or why not? Sources: Burt Helm, “Best Global Brands,” BusinessWeek, September 18, 2008; Stuart Elliot, “Microsoft Takes a User- Friendly Approach to Selling Its Image in a New Global Campaign,” New York Times, November 11, 1994; “Todd Bishop, “The Rest of the Motto,” Seattle Post Intelligencer,
- 58. September 23, 2004; Devin Leonard, “Hey PC, Who Taught You to Fight Back?” New York Times, August 30, 2009; Suzanne Vranica and Robert A. Guth, “Microsoft Enlists Jerry Seinfeld in Its Ad Battle Against Apple,” Wall Street Journal, August 21, 2008, p. A1; Stuart Elliott, “Echoing the Campaign of a Rival, Microsoft Aims to Redefine ‘I’m a PC,’” New York Times, September 18, 2008, p. C4; John Furguson, “From Cola Wars to Computer Wars—Microsoft Misses Again,” BN Branding, April 4, 2009. Marketing Excellence: >>Walmart Chris Howes/Wild Places Photography/Alamy Images Walmart, the giant chain of discount stores, is the second largest company in the world, with over $400 billion in revenue and 2.1 million associates (or employees). The phenomenal success story began in 1962 when Sam Walton opened up his first discount store in Rogers, Arkansas. He sold the same products as his competitors but kept prices lower by reducing his profit margin. His customers quickly caught on and the company took off almost immediately. Walton’s EDLP (Every Day Low Price) strategy remains the foundation of Walmart’s success today. Through the company’s economies of scale, Walmart is able to offer customers top brand-name products for the lowest price. Walmart expanded throughout the United States in the 1970s and 1980s by acquiring some of its competitors and opening new stores. The first Walmart Supercenter—a discount store with food outlets, an optical center, photo lab, hair salon, among other amenities—opened in 1988. By 1990, Walmart had become the nation’s number one retailer, with $32 billion in revenue and stores in 33 states. The company’s international expansion began with a store outside Mexico City in 1991 and has grown to over 3,800 international locations, some under a different brand name. Walmart thrives on three basic beliefs and values: “Respect for the Individual,” “Service to Our Customers,” and “Striving for
- 59. Excellence.” Sam Walton’s original 10-foot rule—“I promise that whenever I come within 10 feet of a customer, I will look him in the eye, greet him, and ask if I can help him.”—still governs today, embodied by the “greeters” at the front door. In addition, Walmart embraces the communities in which it enters in order to develop strong local relationships and build its brand image in the area. The company donates significant amounts of money to local charities through its “Good Works” program, hires local individuals, and purchases food from local farmers. Walmart’s marketing strategy has evolved over the years. Early marketing efforts were based on word of mouth, positive PR, and aggressive store expansion. In 1992, Walmart introduced its well-known tagline, “Always Low Prices. Always,” which effectively communicated the company’s core brand promise and resonated with millions. In 1996, Walmart launched its price rollback campaign featuring the familiar yellow smiley face as the star of the campaign. The smiley face happily slashed prices in Walmart’s television commercials and appeared on store signage as well as employees’ aprons and buttons. The campaign helped Walmart’s stock soar 1173 percent in the 1990s. Walmart hit a few bumps in the road as it entered the 21st century, and critics protested its entry into small communities. In one study at Iowa State University, researchers found that within 10 years of a new Walmart store opening, up to one-half of the small stores in that town can disappear. Walmart also faced multiple lawsuits from employees who complained about poor work conditions, exposure to health hazards, and pay below minimum wage, which left employees with families below the poverty line. In some cases, employees said Walmart failed to pay for overtime and prevented them from taking rest or lunch breaks. Another lawsuit claimed the company discriminated against women in awarding pay and promotions. These problems led to a very high turnover rate in the 2000s. According to one Walmart survey, 70 percent of employees left the company within the first year of employment due to lack of
- 60. recognition and inadequate pay. From 2000 to 2005, Walmart’s stock price fell 27 percent and remained low from 2005 to 2007. Negative backlash, combined with Target’s reemergence on the retail scene, contributed to the decline. Target revamped its stores, merchandise, and marketing strategy to appeal to a more aspirational discount buyer and stole some of Walmart’s top-tier customers. Target stores were nicely lit, offering wider aisles and better-displayed merchandise. Target’s television commercials featured attractive models and trendy clothes from high-end designers such as Isaac Mizrahi and Liz Lange. One analyst stated, “Target tends to have more upscale customers who don’t feel the effects of gasoline prices and other economic factors as much as Walmart’s core customers might.” From 2003 to 2007, Target outperformed Walmart in same-store sales growth by 1.7 percent and profit growth by 5.7 percent. During this time, Walmart also lost the exclusive rights to use the smiley face in its marketing campaign. For all these—and other—reasons, Walmart decided it was time for a new direction and launched a series of new initiatives to help improve sales and its image. First, it introduced a highly successful $4 generic drug campaign, a program eventually copied by Target. Walmart also launched several environmentally friendly initiatives such as constructing new buildings from recycled materials, cutting transportation costs and energy usage, and encouraging customers to buy more green products. In 2007, Walmart introduced a new marketing campaign and tagline, “Save Money. Live Better.” Television commercials highlighted the company’s positive impact on decreased energy costs, increased 401(k) (retirement) savings, good employee health care coverage, and increased family savings. One commercial stated, “In today’s economy, nobody’s more committed to helping family budgets go further than Walmart. Walmart saves the average family about $3,100 a year, no matter where they shop.”
- 61. Walmart also used the new campaign and aggressive price cuts to attract new consumers affected by the recession. It slashed prices on popular toys and electronics during the holidays and implemented a massive store remodeling effort called Project Impact. As a result, stores became cleaner, aisles less cluttered, and merchandise easier to reach—all to help improve the overall shopping experience and steal customers from Target. Walmart’s tactics worked: Same-store sales rose and its stock price improved during the recession. Analysts explained that Walmart’s product mix—45 percent consumables (food, beauty, health items)—is a better strategy in a poor economy than Target’s product mix—20 percent consumables and 40 percent home and apparel products. One analyst said, “Walmart sells what you need to have as opposed to what you want to have.” Stephen Quinn, Walmart’s CMO, stated, “We are fortunate that this recession came along. It played to our positioning really well. But our own insecurity is that all the credit would go to the external environment and none of the work we all did. The kinds of things we were working on anyway when this environment came along are the same things we need to do to keep these so-called new customers and I think continued to build loyalty with our existing base.” Today, Walmart has stores in 16 international markets and serves more than 200 million customers a week through its variety of discount stores. These include Walmart Supercenters, Discount Stores, Neighborhood Markets, and Sam’s Club warehouses. Questions 1. Evaluate Walmart’s new marketing campaign and tagline. Did the company make the right decision to drop “Always Low Prices. Always.” as a tagline? Why or why not? 2. Walmart does very well when the economy turns sour. How can it protect itself when the economy is on the rise? Explain. Sources: Dave Goldiner, “Exxon Tops Wal-Mart on 2009
- 62. Fortune 500 List,” New York Daily News, April 20, 2009; “Wal-Mart Seeks Smiley Face Fights,” BBC News, August 5, 2006; David Ng, “Wal-Mart vs. Target,” Forbes, December 13, 2004; Michael Barbaro, “A New Weapon for Wal-Mart: A War Room,” New York Times, November 1, 2005; Kenneth E. Stone, “Impact of the Wal-Mart Phenomenon on Rural Communities,” Increasing Understanding of Public Problems and Policies (Chicago: Farm Foundation, 1997), pp. 189–200; Suzanne Kapner, “Wal-mart Enters the Ad Age,” CNNMoney.com, August 17, 2008; Jack Neff, “Why Walmart Is Getting Serious About Marketing,” Advertising Age, June 8, 2009; Sean Gregory, “Walmart’s Project Impact: A Move to Crush Competition,” Time, September 9, 2009; “Store Wars: When Wal-Mart Comes to Town,” PBS, February 24, 2007; Sean Gregory, “Wal-Mart vs. Target: No Contest in the Recession,” Time, March 14, 2009. Assignment 3 Total : 60 marks. The results are based on the script that is provided on the blackboard. You can do the Assignment in a group of 3 max members. Q. Use queries to solve following according to expected output given to you: a. Create a report that displays all employees, and indicate with the words yes or no whether they receive a commission. Use the DECODE expression in your query. (5 marks) LAST_NAME SALARY COMMISSION Ayesha 120000 no
- 64. Zlotkey 10500 yes Abel 11000 yes Taylor 8600 yes Grant 7000 yes Whalen 4400 no Hartstein 13000 no Fay 6000 no Higgins 12000 no Gietz 8300 no b. Show all employees who were hired in the first half of the month (before the 16th of the month) (5 marks) LAST_NAME HIRE_DATE Manzer 02-OCT-08 De Haan
- 65. 13-JAN-93 Hunold 03-JAN-90 Lorentz 07-FEB-99 Matos 15-MAR-98 Vargas 09-JUL-98 Abel 11-MAY-96 Higgins 07-JUN-94 Gietz 07-JUN-94 c. Create a report that displays the employee_number, last_name, salary, department_number, and the average salary in their department for all employees. (5 marks) EMPLOYEE_ID LAST_NAME DEPARTMENT_ID AVG(S.SALARY) 113 Manzer 70 12000 101 Kochhar 90 19333.3333 103 Hunold 60 6400
- 68. d. The HR department wants to determine the names of all employees hired after Davies. Create a query to display the name and hire date of any employee hired after employee Davies. (5 marks) LAST_NAME HIRE_DATE HArris 29-NOV-08 HArris 29-NOV-08 oiu 01-DEC-08 Lorentz 07-FEB-99 Mourgos 16-NOV-99 Matos 15-MAR-98 Vargas 09-JUL-98 Zlotkey 29-JAN-00 Taylor 24-MAR-98 Grant 24-MAY-99 Cores 06-NOV-08 Fay 17-AUG-97 HArris 29-NOV-08 HArris
- 69. 29-NOV-08 14 rows selected. e. The HR department needs to find the names and hire dates for all employees who were hired before their managers, along with their manager’s names and hire dates. Label the columns Employee, Emp hired, Manager, and Mgr hired, respectively. (5 marks) LAST_NAME HIRE_DATE LAST_NAME HIRE_DATE Hunold 03-JAN-90 De Haan 13-JAN-93 Rajs 17-OCT-95 Mourgos 16-NOV-99 Davies 29-JAN-97 Mourgos 16-NOV-99 Matos 15-MAR-98 Mourgos 16-NOV-99 Vargas 09-JUL-98 Mourgos 16-NOV-99 Abel 11-MAY-96 Zlotkey 29-JAN-00 Taylor
- 70. 24-MAR-98 Zlotkey 29-JAN-00 Grant 24-MAY-99 Zlotkey 29-JAN-00 8 rows selected. f. The Accounting department requires an analysis on maximum and minimum salaries by job, manager, and department. They have asked you to do the following: (5 marks) Write a query to display the following groupings: · Department_id, job_id · Job_id, manager_id JOB_ID MANAGER_ID DEPARTMENT_ID MAX(SALARY) MIN(SALARY) AC_MGR 101 12000 12000 ST_MAN 100 5800 5800 IT_Prog 10800 10800 MK_MAN 100
- 74. g. The HR department wants a list of employees who are up for review in January; so they have requested you to do the following: (5 marks) Write a query to display the last names, month of the date of hire, and hire date of those employees who have been hired in the month of January, irrespective of the year of hire. LAST_NAME EXTRACT(MONTHFROMHIRE_DATE) HIRE_DATE De Haan 1 13-JAN-93 Hunold 1 03-JAN-90 Davies 1 29-JAN-97 Zlotkey 1 29-JAN-00 h. The CEO needs a report on the top three earners in the company for profit sharing. He has asked you to provide him with a list. (5 marks) Write a query to display top three earners in the Employees table. Display their last names and salaries. LAST_NAME SALARY King 24000 Kochhar
- 75. 17000 De Haan 17000 i. The benefits for the state of California have been changed based on a local ordinance. So the benefits representative has asked you to compile a list of the people who are affected. Write a query to display the employee id and last name of the employees who work in the state of California. Hint: Use Scalar Subqueries. (5 marks) EMPLOYEE_ID LAST_NAME 124 Mourgos 141 Rajs 142 Davies 143 Matos 144 Vargas j.Show those employees who have a last name starting with letters j, K, L or M. (5 marks) LAST_NAME King Kochhar Lorentz Matos Mourgos
- 76. k. Find the number of employees who have a last name that ends with the letter n. Create two possible solutions. (5 marks) COUNT(*) 2 l. Create a report that shows name, location, and number of employees for each department. Make sure that the report also includes departments without employees. (5 marks) DEPARTMENT_ID DEPARTMENT_NAME LOCATION_ID COUNT(E.EMPLOYEE_ID) 80 Sales 2500 4 110 Accounting 1700 1 120 support 2500 0 60 IT 1400 8 10 Administration 1700 0 200 support 2500 0
- 77. 90 Executive 1700 3 20 Marketing 1800 2 70 public relations 1700 0 50 Shipping 1500 5 10 rows selected. Marketing Management, 14 Chapter 13: Designing and Managing Services ISBN: 9780132102926 Author: Philip Kotler, Kevin Lane Keller copyright © 2012 Pearson Education Designing and Managing Services The unconventional Cirque du Soleil organization creates memorable experiences for its audiences through its creative redefinition of the circus concept. Holandaluz Vincent de Vries/Alamy Images In This Chapter, We Will Address the Following Questions 1. How do we define and classify services, and how do they differ from goods? 2.
- 78. What are the new services realities? 3. How can we achieve excellence in services marketing? 4. How can we improve service quality? 5. How can goods marketers improve customer-support services? As product companies find it harder and harder to differentiate their physical products, they turn to service differentiation. Many in fact find significant profitability in delivering superior service, whether that means on-time delivery, better and faster answering of inquiries, or quicker resolution of complaints. Top service providers know these advantages well and also how to create memorable customer experiences.1 In its 25-year history, Cirque du Soleil (French for “circus of the sun”) has continually broken loose from circus convention. It takes traditional ingredients such as trapeze artists, clowns, muscle men, and contortionists and places them in a nontraditional setting with lavish costumes, new age music, and spectacular stage designs. And it eliminates other commonly observed circus elements—there are no animals. Each production is loosely tied together with a theme such as “a tribute to the nomadic soul” (Varekai) or “a phantasmagoria of urban life” (Saltimbanco). The group has grown from its Quebec street-performance roots to become a half-billion-dollar global enterprise, with 3,000 employees on four continents entertaining audiences of millions annually. Part of its success comes from a company culture that encourages artistic creativity and innovation and carefully safeguards the brand. One new production is created each year—always in-house—and is unique: There are no duplicate touring companies. In addition to Cirque’s mix of media and local promotion, an extensive interactive e-mail program to its million-plus-member Cirque Club creates an online community of fans—20 percent to 30 percent of all ticket sales come from
- 79. club members. Generating $800 million in revenue annually, the Cirque du Soleil brand has expanded to encompass a record label, a retail operation, and resident productions in Las Vegas (five in all), Orlando, Tokyo, and other cities.2 sidenote: Because it is critical to understand the special nature of services and what that means to marketers, in this chapter we systematically analyze services and how to market them most effectively. The Nature of Services The Bureau of Labor Statistics reports that the service- producing sector will continue to be the dominant employment generator in the economy, adding about 14.6 million jobs through 2018, or 96 percent of the expected increase in total employment. By 2018, the goods-producing sector is expected to account for 12.9 percent of total jobs, down from 17.3 percent in 1998 and 14.2 percent in 2008. Manufacturing lost 4.1 million jobs from 1998 through 2008 and is expected to lose another 1.2 million jobs between 2008 and 2018.3 These numbers and others have led to a growing interest in the special problems of marketing services.4 Service Industries Are Everywhere The government sector, with its courts, employment services, hospitals, loan agencies, military services, police and fire departments, postal service, regulatory agencies, and schools, is in the service business. The private nonprofit sector— museums, charities, churches, colleges, foundations, and hospitals—is in the service business. A good part of the business sector, with its airlines, banks, hotels, insurance companies, law firms, management consulting firms, medical practices, motion picture companies, plumbing repair companies, and real estate firms, is in the service business. Many workers in the manufacturing sector, such as computer operators, accountants, and legal staff, are really service providers. In fact, they make up a “service factory” providing services to the “goods factory.” And those in the retail sector,
- 80. such as cashiers, clerks, salespeople, and customer service representatives, are also providing a service. A service is any act or performance one party can offer to another that is essentially intangible and does not result in the ownership of anything. Its production may or may not be tied to a physical product. Increasingly, manufacturers, distributors, and retailers are providing value-added services, or simply excellent customer service, to differentiate themselves. Many pure service firms are now using the Internet to reach customers; some are purely online. Monster.com’s Webby- award-winning site offers online career advice and employment recruiting. Done right, improvements or innovations in customer service can have a big payoff, as Zipcar found. Zipcar Car sharing started in Europe as a means to extend public transportation. In the United States the appeal of Zipcar, the market leader and pioneer, is both environmental and economic. With a $50 membership fee and rates that total less than $100 a day—which includes gas, insurance, and parking—a typical family could save $3,000 to $4,000 a year by substituting Zipcar use for car ownership. Zipcar’s fleet includes all types of popular models—BMWs, Volvos, pickup trucks, and even MINI Coopers and the Toyota Prius hybrid—and the firm estimates that every car it adds keeps up to 20 private cars off the road. Consumers—and an increasing number of universities and businesses—book online and use a sophisticated reservation system to reserve a specific car in their neighborhood. There are a number of rules for car care (such as no smoking) and logistics (such as calling to extend a reservation if running late). As CEO Scott Griffith states, “Our business model depends on the kindness of others.” To help increase awareness, Zipcar slaps its logo on the side of all but the high-end luxury models. Unusual marketing stunts such as a contest to guess how many Swedish meatballs had been stuffed into a MINI Cooper parked in an IKEA parking lot also help to spread the
- 81. word. Targeting major cities and college towns, the company is growing about 30 percent a year.5 Zipcar offers its fast-growing customer base a practical, environmentally friendly alternative to car ownership. Courtesy of Zipcar Categories of Service Mix The service component can be a minor or a major part of the total offering. We distinguish five categories of offerings: 1. Pure tangible good—a tangible good such as soap, toothpaste, or salt with no accompanying services. 2. Tangible good with accompanying services—a tangible good, like a car, computer, or cell phone, accompanied by one or more services. Typically, the more technologically advanced the product, the greater the need for high-quality supporting services. 3. Hybrid—an offering, like a restaurant meal, of equal parts goods and services. People patronize restaurants for both the food and its preparation. 4. Major service with accompanying minor goods and services— a major service, like air travel, with additional services or supporting goods such as snacks and drinks. This offering requires a capital-intensive good—an airplane—for its realization, but the primary item is a service. 5. Pure service—primarily an intangible service, such as babysitting, psychotherapy, or massage. The range of service offerings makes it difficult to generalize without a few further distinctions. · Services vary as to whether they are equipment based (automated car washes, vending machines) or people based (window washing, accounting services). People-based services vary by whether unskilled, skilled, or professional workers provide them. · Service companies can choose among different processes to deliver their service. Restaurants offer cafeteria-style, fast- food, buffet, and candlelight service formats.
- 82. · Some services need the client’s presence. Brain surgery requires the client’s presence, a car repair does not. If the client must be present, the service provider must be considerate of his or her needs. Thus beauty salon operators will invest in décor, play background music, and engage in light conversation with the client. · Services may meet a personal need (personal services) or a business need (business services). Service providers typically develop different marketing programs for these markets. · Service providers differ in their objectives (profit or nonprofit) and ownership (private or public). These two characteristics, when crossed, produce four quite different types of organizations. The marketing programs of a private investor hospital will differ from those of a private charity hospital or a Veterans Administration hospital.6 Customers typically cannot judge the technical quality of some services even after they have received them. Figure 13.1 shows various products and services according to difficulty of evaluation.7 At the left are goods high in search qualities—that is, characteristics the buyer can evaluate before purchase. In the middle are goods and services high in experience qualities— characteristics the buyer can evaluate after purchase. At the right are goods and services high in credence qualities— characteristics the buyer normally finds hard to evaluate even after consumption.8 Figure 13.1 Continuum of Evaluation for Different Types of Products Source: Valarie A. Zeithaml, “How Consumer Evaluation Processes Differ between Goods and Services,” James H. Donnelly and William R. George, eds., Marketing of Services (Chicago: American Marketing Association, 1981). Reprinted with permission of the American Marketing Association. Because services are generally high in experience and credence qualities, there is more risk in their purchase, with several consequences. First, service consumers generally rely on word
- 83. of mouth rather than advertising. Second, they rely heavily on price, provider, and physical cues to judge quality. Third, they are highly loyal to service providers who satisfy them. Fourth, because switching costs are high, consumer inertia can make it challenging to entice business away from a competitor. Distinctive Characteristics of Services Four distinctive service characteristics greatly affect the design of marketing programs: intangibility, inseparability, variability, and perishability.9 Intangibility Unlike physical products, services cannot be seen, tasted, felt, heard, or smelled before they are bought. A person getting cosmetic surgery cannot see the results before the purchase, and the patient in the psychiatrist’s office cannot know the exact outcome of treatment. To reduce uncertainty, buyers will look for evidence of quality by drawing inferences from the place, people, equipment, communication material, symbols, and price. Therefore, the service provider’s task is to “manage the evidence,” to “tangibilize the intangible.”10 Service companies can try to demonstrate their service quality through physical evidence and presentation.11 Suppose a bank wants to position itself as the “fast” bank. It could make this positioning strategy tangible through any number of marketing tools: 1. Place—The exterior and interior should have clean lines. The layout of the desks and the traffic flow should be planned carefully. Waiting lines should not get overly long. 2. People—Employees should be busy, but there should be a sufficient number to manage the workload. 3. Equipment—Computers, copy machines, desks, and ATMs should look like, and be, state of the art. 4. Communication material—Printed materials—text and photos—should suggest efficiency and speed. 5. Symbols—The bank’s name and symbol could suggest fast service. 6. Price—The bank could advertise that it will deposit $5 in the
- 84. account of any customer who waits in line more than five minutes. Service marketers must be able to transform intangible services into concrete benefits and a well-defined experience.12 Disney is a master at “tangibilizing the intangible” and creating magical fantasies in its theme parks; so are companies such as Jamba Juice and Barnes & Noble in their respective retail stores.13Table 13.1 measures brand experiences in general along sensory, affective, behavioral, and intellectual dimensions. Applications to services are clear. Table 13.1 Dimensions of Brand Experience Sensory · This brand makes a strong impression on my visual sense or other senses. · I find this brand interesting in a sensory way. · This brand does not appeal to my senses. Affective · This brand induces feelings and sentiments. · I do not have strong emotions for this brand. · This brand is an emotional brand. Behavioral · I engage in physical actions and behaviors when I use this brand. · This brand results in bodily experiences. · This brand is not action-oriented. Intellectual · I engage in a lot of thinking when I encounter this brand. · This brand does not make me think. · This brand stimulates my curiosity and problem solving. Source: JosŠko Brakus, Bernd H. Schmitt, and Lia Zarantonello, “Brand Experience: What Is It? How Is It Measured? Does It Affect Loyalty?” Journal of Marketing 73 (May 2009), pp. 52– 68. Reprinted with permission from Journal of Marketing, published by the American Marketing Association. Because there is no physical product, the service provider’s facilities—its primary and secondary signage, environmental
- 85. design and reception area, employee apparel, collateral material, and so on—are especially important. All aspects of the service delivery process can be branded, which is why Allied Van Lines is concerned about the appearance of its drivers and laborers, why UPS has developed such strong equity with its brown trucks, and why Hilton’s Doubletree Hotels offers fresh- baked chocolate chip cookies to symbolize care and friendliness.14 Service providers often choose brand elements—logos, symbols, characters, and slogans—to make the service and its key benefits more tangible—for example, the “friendly skies” of United, the “good hands” of Allstate, and the “bullish” nature of Merrill Lynch. Inseparability Whereas physical goods are manufactured, then inventoried, then distributed, and later consumed, services are typically produced and consumed simultaneously.15 A haircut can’t be stored—or produced without the barber. The provider is part of the service. Because the client is also often present, provider– client interaction is a special feature of services marketing. Buyers of entertainment and professional services are very interested in the specific provider. It’s not the same concert if Taylor Swift is indisposed and replaced by Beyoncé, or if a corporate legal defense is supplied by an intern because antitrust expert David Boies is unavailable. When clients have strong provider preferences, the provider can raise its price to ration its limited time. Several strategies exist for getting around the limitations of inseparability. The service provider can work with larger groups. Some psychotherapists have moved from one-on-one therapy to small-group therapy to groups of over 300 people in a large hotel ballroom. The service provider can work faster— the psychotherapist can spend 30 more efficient minutes with each patient instead of 50 less-structured minutes and thus see more patients. The service organization can train more service providers and build up client confidence, as H&R Block has
- 86. done with its national network of trained tax consultants. Variability Because the quality of services depends on who provides them, when and where, and to whom, services are highly variable. Some doctors have an excellent bedside manner; others are less empathic. A different entertainer creates a different concert experience—a Beyoncé concert is not the same as a Taylor Swift concert. Michael Caulfield/Getty Images-WireImage.com Kevin Mazur/Getty Images/Time Life Pictures Service buyers are aware of this variability and often talk to others before selecting a service provider. To reassure customers, some firms offer service guarantees that may reduce consumer perceptions of risk.16 Here are three steps service firms can take to increase quality control. 1. Invest in good hiring and training procedures.Recruiting the right employees and providing them with excellent training is crucial, regardless of whether employees are highly skilled professionals or low-skilled workers. Better-trained personnel exhibit six characteristics: Competence, courtesy, credibility, reliability, responsiveness, and communication.17 Given the diverse nature of its customer base in California, banking and mortgage giant Wells Fargo actively seeks and trains a diverse workforce. The average Wells Fargo customer uses 5.2 different bank products, roughly twice the industry average, thanks in part to the teamwork of its highly motivated staff.18 2. Standardize the service-performance process throughout the organization.A service blueprint can map out the service process, the points of customer contact, and the evidence of service from the customer’s point of view.19Figure 13.2 shows a service blueprint for a guest spending a night at a hotel.20 Behind the scenes, the hotel must skillfully help the guest move from one step to the next. Service blueprints can be helpful in developing new service, supporting a zero-defects culture, and
- 87. devising service recovery strategies. Figure 13.2 Blueprint for Overnight Hotel Stay Source: Valarie Zeithaml, Mary Jo Bitner, and Dwayne D. Gremler, Services Marketing: Integrating Customer Focus across the Firm, 4th ed. (New York: McGraw-Hill, 2006). 3. Monitor customer satisfaction.Employ suggestion and complaint systems, customer surveys, and comparison shopping. Customer needs may vary in different areas, allowing firms to develop region-specific customer satisfaction programs.21 Firms can also develop customer information databases and systems for more personalized service, especially online.22 Because services are a subjective experience, service firms can also design marketing communication and information programs so consumers learn more about the brand than what they get from service encounters alone. Perishability Services cannot be stored, so their perishability can be a problem when demand fluctuates. Public transportation companies must own much more equipment because of rush- hour demand than if demand were even throughout the day. Some doctors charge patients for missed appointments because the service value (the doctor’s availability) exists only at the time of the appointment. Demand or yield management is critical—the right services must be available to the right customers at the right places at the right times and right prices to maximize profitability. Several strategies can produce a better match between service demand and supply.23 On the demand side: · Differential pricing will shift some demand from peak to off- peak periods. Examples include low matinee movie prices and weekend discounts for car rentals.24 · Nonpeak demand can be cultivated. McDonald’s pushes breakfast service, and hotels promote minivacation weekends. · Complementary services can provide alternatives to waiting customers, such as cocktail lounges in restaurants and automated teller machines in banks.
- 88. · Reservation systems are a way to manage the demand level. Airlines, hotels, and physicians employ them extensively. On the supply side: · Part-time employees can serve peak demand. Colleges add part-time teachers when enrollment goes up; stores hire extra clerks during holiday periods. · Peak-time efficiency routines can allow employees to perform only essential tasks during peak periods. Paramedics assist physicians during busy periods. · Increased consumer participation frees service providers’ time. Consumers fill out their own medical records or bag their own groceries. · Shared services can improve offerings. Several hospitals can share medical-equipment purchases. · Facilities for future expansion can be a good investment. An amusement park buys surrounding land for later development. Disney’s innovative FASTPASS system helps to match supply and demand for its Disney World theme park rides. John Raoux/AP Wide World Photos Many airlines, hotels, and resorts e-mail short-term discounts and special promotions to self-selected customers. After 40 years of making people stand in line at its theme parks, Disney instituted FASTPASS, which allows visitors to reserve a spot in line and eliminate the wait. Polls revealed 95 percent like the change. Disney’s vice president, Dale Stafford, told a reporter, “We have been teaching people how to stand in line since 1955, and now we are telling them they don’t have to. Of all the things we can do and all the marvels we can create with the attractions, this is something that will have a profound effect on the entire industry.”25 The New Services Realities Service firms once lagged behind manufacturers in their use of marketing because they were small, or they were professional businesses that did not use marketing, or they faced large demand or little competition. This has certainly changed. Some
- 89. of the most skilled marketers now are service firms. One that wins praise for its marketing success is Singapore Airlines. Singapore Airlines (SIA) Singapore Airlines is consistently recognized as the world’s “best” airline—it wins so many awards, it has to update its Web site monthly to keep up to date—in large part due to its stellar holistic marketing. Famous for pampering passengers, SIA continually strives to create a “wow effect” and surpass customers’ expectations. It was the first to launch individual video screens at airplane seats. Thanks to the first-of-its-kind $1 million simulator SIA built to mimic the air pressure and humidity inside a plane, the carrier found that taste buds change in the air and that, among other things, it needed to cut back on spices in its food. SIA places a high value on training; its “Transforming Customer Service (TCS)” program includes staff in five key operational areas: cabin crew, engineering, ground services, flight operations, and sales support. The TCS culture is also embedded in all management training, company-wide. It applies a 40-30-30 rule in its holistic approach to people, processes, and products: 40 percent of resources go to training and invigorating staff, 30 percent to reviewing process and procedures, and 30 percent to creating new product and service ideas. With its innovatively designed Boeing 777-300 ERS and Airbus A380 planes, SIA set new standards of comforts in all classes of service, from eight private minirooms in first class to wider seats, AC power supplies, and USB ports in coach.26 Singapore Airlines goes to extraordinary lengths to ensure that every aspect of the passenger experience exceeds expectations. Eric Piermont/Getty Images, Inc. AFP A Shifting Customer Relationship Not all companies, however, have invested in providing superior service, at least not to all customers. In many service industries, such as airlines, banks, stores, and hotels, customer satisfaction in the United States has not significantly improved—or in some
- 90. cases actually dropped—in recent years.27 Customers complain about inaccurate information; unresponsive, rude, or poorly trained workers; and long wait times. Even worse, many find their complaints never actually reach a live human being because of slow or faulty phone or online reporting systems. It doesn’t have to be that way. Fifty-five operators handle 100,000 calls a year on Butterball Turkeys’ 800 number— 10,000 on Thanksgiving Day alone—about how to prepare, cook, and serve turkeys. Trained at Butterball University, the operators have all cooked turkeys dozens of different ways and can handle the myriad queries that come their way, including why customers shouldn’t stash turkeys in snow banks or thaw them in bathtubs.28 Savvy services marketers are recognizing the new services realities, such as the importance of the newly empowered customer, customer coproduction, and the need to engage employees as well as customers. Customer Empowerment Customers are becoming more sophisticated about buying product-support services and are pressing for “unbundled services.” They may desire separate prices for each service element and the right to select the elements they want. Customers also increasingly dislike having to deal with a multitude of service providers handling different types of equipment. Some third-party service organizations now service a greater range of equipment. Most importantly, the Internet has empowered customers by letting them vent their rage about bad service—or reward good service—and send their comments around the world with a mouse click. Although a person who has a good customer experience is more likely to talk about it, someone who has a bad experience will talk to more people.29 Ninety percent of angry customers reported sharing their story with a friend. Now, they can share their stories with strangers too. At PlanetFeedback.com, shoppers can send a complaint, compliment, suggestion, or question directly to a company, with
- 91. the option to post comments publicly on the site as well. Customer service dissatisfaction increasingly goes viral— Canadian singer Dave Carroll’s musical frustration with United Airlines was downloaded by millions. MajaPhoto/Dreamstime LLC-Royalty Free United Breaks Guitars When Canadian singer Dave Carroll faced $1,200 in damages to his $3,000 Gibson guitar after a United flight, he put his creative energy to good use. He created a humorous video, United Breaks Guitars, and launched it on YouTube with this catchy refrain: “United, you broke my Taylor guitar. United, some big help you are. You broke it, you should fix it. You’re liable, just admit it. I should have flown with someone else or gone by car ’cuz United breaks guitars.” Viewed over 5 million times, his follow-up video focused on his frustrating efforts to get United to pay for the damage. United got the message. It donated a check for $1,200 to a charity Carroll designated and now uses the incident in training baggage handlers and customer-service representatives.30 Most companies respond quickly. Comcast allows contact 24/7 by phone and e-chat but also reaches out to customers and monitors blogs, Web sites, and social media. If employees see a customer report a problem on a blog, they get in touch and offer help. E-mail responses to customers must be implemented properly to be effective. One expert believes companies should (1) send an automated reply to tell customers when a more complete answer will arrive (ideally within 24 hours), (2) ensure the subject line always contains the company name, (3) make the message easy to scan for relevant information, and (4) give customers an easy way to respond with follow-up questions.31 More important than simply responding to a disgruntled customer, however, is preventing dissatisfaction from occurring
- 92. in the future. That may mean simply taking the time to nurture customer relationships and give customers attention from a real person. Columbia Records spent $10 million to improve its call center, and customers who phone the company can now opt out to reach an operator at any point in their call. JetBlue took a service disaster and used it to improve its customer service approach. JetBlue CEO David Neeleman set the bar high for responding to enraged customers after the company’s drastic Valentine’s Day failure of 2007. During storms in New York City, JetBlue left hundreds of passengers stranded aboard grounded aircraft—some for longer than 9 hours without amenities—and cancelled more than 1,000 flights. JetBlue had built its reputation on being a more responsive, humane airline in an era of minimal services and maximal delays. Neeleman knew he had to act fast to stem another kind of storm: a whirlwind of customer defections. Within 24 hours, he had placed full-page ads in newspapers nationwide in which he personally responded to JetBlue’s debacle. “We are sorry and embarrassed,” the ads declared, “But most of all we are deeply sorry.” JetBlue gave concrete reparations to passengers. Neeleman announced a new “customer bill of rights” that promised passengers travel credits for excessive waits. For instance, passengers who are unable to disembark from an arriving flight for 3 hours or more would receive vouchers worth the full value of their round-trip ticket. JetBlue will also hand out vouchers for the full amount of passengers’ round trips if a flight is cancelled within 12 hours of a scheduled departure. The apology, backed by concrete benefits for the angry and inconvenienced passengers, netted kudos for the company from both the business press and JetBlue’s own true blue customers. Neeleman eventually stepped down as new management was brought in to address some of the growth challenges the airline faced.32 Customer Coproduction
- 93. The reality is that customers do not merely purchase and use a service; they play an active role in its delivery.33 Their words and actions affect the quality of their service experiences and those of others, and the productivity of frontline employees. Customers often feel they derive more value, and feel a stronger connection to the service provider, if they are actively involved in the service process. This coproduction can put stress on employees, however, and reduce their satisfaction, especially if they differ culturally or in other ways from customers.34 Moreover, one study estimated that one-third of all service problems are caused by the customer.35 The growing shift to self-service technologies will likely increase this percentage. JetBlue weathered a customer service disaster and continues to receive kudos from its passengers. Courtesy of JetBlue Airways Corporation Preventing service failures is crucial, since recovery is always challenging. One of the biggest problems is attribution— customers often feel the firm is at fault or, even if not, that it is still responsible for righting any wrongs. Unfortunately, although many firms have well-designed and executed procedures to deal with their own failures, they find managing customer failures—when a service problem arises from a customer’s lack of understanding or ineptitude—much more difficult. Figure 13.3 displays the four broad causes of customer failures. Solution s come in all forms, as these examples show:36 Figure 13.3 Root Causes of Customer Failure
- 94. Source: Stephen Tax, Mark Colgate, and David Bowen, MIT Sloan Management Review (Spring 2006): pp. 30–38. ©2006 by Massachusetts Institute of Technology. All rights reserved. Distributed by Tribune Media Services. 1. Redesign processes and redefine customer roles to simplify service encounters.One of the keys to Netflix’s success is that it charges a flat fee and allows customers to return DVDs by mail at their leisure, giving customers greater control and flexibility. 2. Incorporate the right technology to aid employees and customers.Comcast, the largest cable operator by subscribers in the United States, introduced software to identify network glitches before they affected service and to better inform call- center operators about customer problems. Repeat service calls dropped 30 percent as a result. 3. Create high-performance customers by enhancing their role clarity, motivation, and ability.USAA reminds enlisted policyholders to suspend their car insurance when they are stationed overseas. 4. Encourage “customer citizenship” so customers help customers.At golf courses, players can not only follow the rules by playing and behaving appropriately, they can encourage others to do so. Satisfying Employees as well as Customers Excellent service companies know that positive employee attitudes will promote stronger customer loyalty.37 Instilling a
- 95. strong customer orientation in employees can also increase their job satisfaction and commitment, especially if they have high customer contact. Employees thrive in customer-contact positions when they have an internal drive to (1) pamper customers, (2) accurately read customer needs, (3) develop a personal relationship with customers, and (4) deliver quality service to solve customers’ problems.38 Consistent with this reasoning, Sears found a high correlation between customer satisfaction, employee satisfaction, and store profitability. In companies such as Hallmark, John Deere, and Four Seasons Hotels, employees exhibit real company pride. The downside of not treating employees right is significant. A survey of 10,000 employees from the largest 1,000 companies found that 40 percent of workers cited “lack of recognition” as a key reason for leaving a job.39 Given the importance of positive employee attitudes to customer satisfaction, service companies must attract the best employees they can find. They need to market a career rather than just a job. They must design a sound training program and provide support and rewards for good performance. They can use the intranet, internal newsletters, daily reminders, and employee roundtables to reinforce customer-centered attitudes. Finally, they must audit employee job satisfaction regularly. The Panda Express restaurant chain has management turnover that’s half the industry average, due in part to a combination of
- 96. ample bonuses and health benefits with a strong emphasis on worker self-improvement through meditation, education, and hobbies. Special wellness seminars and get-to-know-you events outside work help to create a caring, nurturing atmosphere.40 Achieving Excellence in Services Marketing The increased importance of the service industry has sharpened the focus on what it takes to excel in the marketing of services.41 Here are some guidelines. Marketing Excellence Marketing excellence with services requires excellence in three broad areas: external, internal, and interactive marketing (see Figure 13.4).42 Figure 13.4 Three Types of Marketing in Service Industries · External marketing describes the normal work of preparing, pricing, distributing, and promoting the service to customers. · Internal marketing describes training and motivating employees to serve customers well. The most important contribution the marketing department can make is arguably to be “exceptionally clever in getting everyone else in the organization to practice marketing.”43 · Interactive marketing describes the employees’ skill in serving the client. Clients judge service not only by its technical quality (Was the surgery successful?), but also by its functional quality (Did the surgeon show concern and inspire confidence?).44
- 97. A good example of a service company achieving marketing excellence is Charles Schwab. Charles Schwab Charles Schwab, one of the nation’s largest discount brokerage houses, uses the telephone, Internet, and wireless devices to create an innovative combination of high-tech and high-touch services. One of the first major brokerage houses to provide online trading, Schwab today services more than 8 million individual and institutional accounts. It offers account information and proprietary research from retail brokers, real- time quotes, an after-hours trading program, the Schwab learning center, live events, online chats with customer service representatives, a global investing service, and market updates delivered by e-mail. Besides the discount brokerage, the firm offers mutual funds, annuities, bond trading, and now mortgages through its Charles Schwab Bank. Schwab’s success has been driven by its efforts to lead in three areas: superior service (online, via phone, and in local branch offices), innovative products, and low prices. Daily customer feedback reports are reviewed and acted on the next day. If customers have trouble filling out a form or experience an unexpected delay, a Schwab representative calls to ask about the source of the problem and how it can be solved.45 In interactive marketing, teamwork is often key, and delegating
- 98. authority to frontline employees can allow for greater service flexibility and adaptability through better problem solving, closer employee cooperation, and more efficient knowledge transfer.46 Technology also has great power to make service workers more productive. When US Airways deployed handheld scanners to better track baggage in 2008, mishandled baggage decreased almost 50 percent from the year before. The new technology paid for itself in the first year and helped contribute to a 35 percent drop in complaints.47 Sometimes new technology has unanticipated benefits. When BMW introduced Wi-Fi to its dealerships to help customers pass the time more productively while their cars were being serviced, more customers chose to stay rather than use loaner cars, an expensive item for dealers to maintain.48 Companies must avoid pushing productivity so hard, however, that they reduce perceived quality. Some methods lead to too much standardization. Service providers must deliver “high touch” as well as “high tech.” Amazon.com has some of the most amazing technological innovations in online retailing, but it also keeps customers extremely satisfied when a problem arises even if they don’t actually talk to an Amazon.com employee.49 The Internet lets firms improve their service offerings and strengthen their relationships with customers by allowing for
- 99. true interactivity, customer-specific and situational personalization, and real-time adjustments of the firm’s offerings.50 But as companies collect, store, and use more information about customers, they have also raised concerns about security and privacy.51 Companies must incorporate the proper safeguards and reassure customers about their efforts. Best Practices of Top Service Companies In achieving marketing excellence with their customers, well- managed service companies share a strategic concept, a history of top-management commitment to quality, high standards, profit tiers, and systems for monitoring service performance and customer complaints. Strategic Concept Top service companies are “customer obsessed.” They have a clear sense of their target customers and their needs and have developed a distinctive strategy for satisfying these needs. At the Four Seasons luxury hotel chain, employees must pass four interviews before being hired. Each hotel also employs a “guest historian” to track guest preferences. With more branch offices in the United States than Starbucks has, Edward Jones brokerage stays close to customers by assigning a single financial advisor and one administrator to each office. Although costly, maintaining such small teams fosters personal relationships.52 Top-Management Commitment
- 100. Companies such as Marriott, Disney, and USAA have a thorough commitment to service quality. Their managements look monthly not only at financial performance, but also at service performance. Ray Kroc of McDonald’s insisted on continually measuring each McDonald’s outlet on its conformance to QSCV: quality, service, cleanliness, and value. Some companies insert a reminder along with employees’ paychecks: “Brought to you by the customer.” Sam Walton of Walmart required the following employee pledge: “I solemnly swear and declare that every customer that comes within 10 feet of me, I will smile, look them in the eye, and greet them, so help me Sam.” High Standards The best service providers set high quality standards. Citibank aims to answer phone calls within 10 seconds and customer letters within 2 days. The standards must be set appropriately high. A 98 percent accuracy standard may sound good, but it would result in 64,000 lost FedEx packages a day; 6 misspelled words on each page of a book; 400,000 incorrectly filled prescriptions daily; 3 million lost USPS mail pieces each day; no phone/Internet/electricity 8 days per year or 29 minutes per day; 1,000 mislabeled or (mispriced) products at a supermarket; and 6 million people unaccounted for in a U.S. census. Profit Tiers Firms have decided to raise fees and lower services to those
- 101. customers who barely pay their way, and to coddle big spenders to retain their patronage as long as possible. Customers in high- profit tiers get special discounts, promotional offers, and lots of special service; customers in lower-profit tiers may get more fees, stripped-down service, and voice messages to process their inquiries. When the recent recession hit, Zappos decided to stop offering complimentary overnight shipping to first-time buyers and offer it to repeat buyers only. The money saved was invested in a new VIP service for the company’s most loyal customers.53 Companies that provide differentiated levels of service must be careful about claiming superior service, however—customers who receive lesser treatment will bad-mouth the company and injure its reputation. Delivering services that maximize both customer satisfaction and company profitability can be challenging. Monitoring Systems Top firms audit service performance, both their own and competitors’, on a regular basis. They collect voice of the customer (VOC) measurements to probe customer satisfiers and dissatisfiers. They use comparison shopping, mystery or ghost shopping, customer surveys, suggestion and complaint forms, service-audit teams, and customers’ letters to the president. We can judge services on customer importance and company performance. Importance-performance analysis rates the various
- 102. elements of the service bundle and identifies required actions. Table 13.2 shows how customers rated 14 service elements or attributes of an automobile dealer’s service department on importance and performance. For example, “Job done right the first time” (attribute 1) received a mean importance rating of 3.83 and a mean performance rating of 2.63, indicating that customers felt it was highly important but not performed well. The ratings of the 14 elements are divided into four sections in Figure 13.5. Figure 13.5 Importance-Performance Analysis · Quadrant A in the figure shows important service elements that are not being performed at the desired levels; they include elements 1, 2, and 9. The dealer should concentrate on improving the service department’s performance on these elements. Table 13.2 Customer Importance and Performance Ratings for an Auto Dealership · Number Attribute · Attribute Description · Mean Importance Ratinga · Mean Performance Ratingb · 1 · Job done right the first time · 3.83 · 2.63
- 103. · 2 · Fast action on complaints · 3.63 · 2.73 · 3 · Prompt warranty work · 3.60 · 3.15 · 4 · Able to do any job needed · 3.56 · 3.00 · 5 · Service available when needed · 3.41 · 3.05 · 6 · Courteous and friendly service · 3.41 · 3.29 · 7 · Car ready when promised · 3.38 · 3.03 · 8
- 104. · Perform only necessary work · 3.37 · 3.11 · 9 · Low prices on service · 3.29 · 2.00 · 10 · Clean up after service work · 3.27 · 3.02 · 11 · Convenient to home · 2.52 · 2.25 · 12 · Convenient to work · 2.43 · 2.49 · 13 · Courtesy buses and cars · 2.37 · 2.35 · 14 · Send out maintenance notices
- 105. · 2.05 · 3.33 · aRatings obtained from a four-point scale of “extremely important” (4), “important” (3), “slightly important” (2), and “not important” (1). bRatings obtained from a four-point scale of “excellent” (4), “good” (3), “fair” (2), and “poor” (1). A “no basis for judgment” category was also provided. · Quadrant B shows important service elements that are being performed well; the company needs to maintain the high performance. · Quadrant C shows minor service elements that are being delivered in a mediocre way but do not need any attention. · Quadrant D shows that a minor service element, “Send out maintenance notices,” is being performed in an excellent manner. Perhaps the company should spend less on sending out maintenance notices and use the savings to improve performance on important elements. Management can enhance its analysis by checking on the competitors’ performance levels on each element.54 Satisfying Customer Complaints On average, 40 percent of customers who suffer through a bad service experience stop doing business with the company.55 But if those customers are willing to complain first, they actually offer the company a gift if the complaint is handled well.
- 106. Companies that encourage disappointed customers to complain—and also empower employees to remedy the situation on the spot—have been shown to achieve higher revenues and greater profits than companies without a systematic approach for addressing service failures.56 Pizza Hut prints its toll-free number on all pizza boxes. When a customer complains, Pizza Hut sends a voice mail to the store manager, who must call the customer within 48 hours and resolve the complaint. Getting frontline employees to adopt extra-role behaviors, and to advocate the interests and image of the firm to consumers, as well as take initiative and engage in conscientious behavior in dealing with customers, can be a critical asset in handling complaints.57 Customers evaluate complaint incidents in terms of the outcomes they receive, the procedures used to arrive at those outcomes, and the nature of interpersonal treatment during the process.58 Companies also are increasing the quality of their call centers and their customer service representatives (CSRs). “Marketing Insight: Improving Company Call Centers” illustrates what top companies are doing. Differentiating Services Finally, customers who view a service as fairly homogeneous care less about the provider than about the price. Marketing excellence requires service marketers to continually differentiate their brands so they are not seen as a commodity.
- 107. Primary and Secondary Service Options Marketers can differentiate their service offerings in many ways, through people and processes that add value. What the customer expects is called the primary service package. Vanguard, the second-largest no-load mutual fund company, has a unique client ownership structure that lowers costs and permits better fund returns. Strongly differentiated from many competitors, the brand grew through word of mouth, PR, and viral marketing.59 Marketing Insight: Improving Company Call Centers Many firms have learned the hard way that demanding, empowered customers will no longer put up with poor service when contacting companies. After Sprint and Nextel merged, they set out to run their call centers as cost centers, rather than a means to enhance customer loyalty. Employee rewards were based on keeping customer calls short, and when management started to monitor even bathroom trips, morale sank. With customer churn spinning out of control, Sprint Nextel began a service improvement plan at the end of 2007 to put more emphasis on service over efficiency. Among other changes that accompanied the appointment of the firm’s first chief service officer, call center operators were rewarded for solving problems on a customer’s first call, rather than for keeping their calls short. The average
- 108. customer contacted customer service four times in 2008, a drop from eight times in 2007. Some firms are getting smarter about the type of calls they send overseas to off-shore call centers. They are investing more in training as well as returning more complex calls to highly trained domestic customer service reps. Homeshoring occurs when a customer service rep works from home with a broadband line and computer. These at-home reps often provide higher- quality service at less cost and with lower turnover. Firms have to manage their number of customer service reps carefully. One study showed that cutting just four reps at a call center of three dozen sent the number of customers put on hold for four minutes or more from zero to eighty. Firms can also try to reasonably get more from each rep. USAA cross-trains its call center reps so that agents who answer investment queries can also respond to insurance-related calls, reducing the number of transfers between agents and increasing productivity as a result. USAA and other firms such as KeyBank and Ace Hardware have also consolidated call center operations into fewer locations, allowing them to maintain their number of reps in the process. Finally, keeping call center reps happy and motivated is obviously also a key to their ability to offer excellent customer service. American Express lets call center reps choose their own hours and swap shifts without a supervisor’s approval.
- 109. Sources: Michael Sanserino and Cari Tuna, “Companies Strive Harder to Please Customers,” Wall Street Journal, July 27, 2009, p. B4; Spencer E. Ante, “Sprint’s Wake-Up Call,” BusinessWeek, March 3, 2008, pp. 54–57; Jena McGregor, “Customer Service Champs,” BusinessWeek, March 5, 2007; Jena McGregor, “When Service Means Survival,” BusinessWeek, March 2, 2009, pp. 26–30. The provider can add secondary service features to the package. In the hotel industry, various chains have introduced such secondary service features as merchandise for sale, free breakfast buffets, and loyalty programs. The major challenge is that most service offerings and innovations are easily copied. Still, the company that regularly introduces innovations will gain a succession of temporary advantages over competitors. Schneider National keeps a step ahead of its competitors by never standing still. Long-haul truckload freight carrier Schneider National goes to great lengths to satisfy its customers and build its brand. Courtesy of Schneider National, Inc. Schneider National Schneider National is the world’s largest long-haul truckload freight carrier, with $3.7 billion in revenues and more than 54,000 bright orange tractors and trailers on the roads. Although
- 110. its core benefit is to move freight from one location to another, Schneider sees itself in the customer solutions business. Its service guarantees are backed by monetary incentives for drivers who meet tight schedules; driver-training programs improve performance. Schneider was the first to introduce in- cab satellite technology and mobile technology to every driver. In 2009, it had its biggest award-winning year, garnering 43 awards for strong customer service, solutions, and commitment to the environment from shippers, government organizations, and industry media. To actively recruit the best drivers, Schneider advertises on television shows such as Trick My Truck, on satellite radio, in newspapers, and online; employs Webinars and PR; and partners with AARP, local organizations, and veterans’ groups. Even painting the trucks Omaha orange was part of a branding strategy to improve safety and create awareness.60 Innovation with Services Retail health clinics are reinventing patient care for minor illnesses and injuries. Karen Ballard/Redux for Fast Company Innovation is as vital in services as in any industry. After years of losing customers to its Hilton and Marriott hotel competitors, Starwood decided to invest $1.7 billion in its Sheraton chain of 400 properties worldwide to give them fresher décor and
- 111. brighter colors, as well as more enticing lobbies, restaurants, and cafés. In explaining the need for the makeover, one hospitality industry expert noted, “There was a time when Sheraton was one of the leading brands. But it lagged in introducing new design and service concepts and developed a level of inconsistency.”61 On the other hand, consider how these relatively new service categories emerged and how, in some cases, organizations created creative solutions in existing categories.62 · Online Travel.Online travel agents such as Expedia and Travelocity offer customers the opportunity to conveniently book travel at discount prices. However, they make money only when visitors go to their Web sites and book travel. Kayak is a newer online travel agency that applies the Google business model of collecting money on a per-click basis. Kayak’s marketing emphasis is on building a better search engine by offering more alternatives, flexibility, and airlines. · Retail Health Clinics.One of the hardest areas in which to innovate is health care. But whereas the current health care system is designed to treat a small number of complex cases, retail health clinics address a large number of simple cases. Retail health clinics such as Quick Care, RediClinic, and MinuteClinic are often found in drugstores and other retail chain stores such as Target and Walmart. They typically use nurse practitioners to handle minor illnesses and injuries such
- 112. as colds, flu, and ear infections, offer various health and wellness services such as physicals and exams for high school sports, and perform vaccinations. They seek to offer convenient, predictable service and transparent pricing, without an appointment, seven days a week. Most visits take no more than 15 minutes, and costs vary from $25 to $100. · Private Aviation.Initially, private aviation was restricted to owning or chartering a private plane. Fractional ownership pioneered by NetJets allowed customers to pay a percentage of the cost of a private plane plus maintenance and a direct hourly cost. Marquis Jets further innovated with a simple idea of combining prepaid time on the world’s largest, best-maintained fleet, offering the consistency and benefits of fractional ownership without the long-term commitment. Many companies are using the Web to offer primary or secondary service features that were never possible before. Salesforce.com uses cloud computing—centralized computing services delivered over the Internet—to run customer- management databases for companies. Häagen-Dazs estimated it would have had to spend $65,000 for a custom-designed database to stay in contact with the company’s retail franchises across the country. Instead, it spent only $20,000 to set up an account with Salesforce.com and pays $125 per month for 20 users to remotely monitor franchises via the Web.63 Managing Service Quality
- 113. The service quality of a firm is tested at each service encounter. If employees are bored, cannot answer simple questions, or are visiting each other while customers are waiting, customers will think twice about doing business there again. One business that understands how to treat customers right is USAA. USAA From its beginnings, USAA focused on selling auto insurance, and later other insurance products, to those with military service. It increased its share of each customer’s business by launching a consumer bank, issuing credit cards, opening a discount brokerage, and offering a selection of no-load mutual funds. Though it now conducts transactions for more than 150 products and services on the phone or online, USAA boasts one of the highest customer satisfaction ratings of any company in the United States. It was the first bank to allow iPhone deposits for its military customers, to routinely text balances to soldiers in the field, and to heavily discount customers’ car insurance when they are deployed overseas. A leader in virtually every customer service award or survey, the company inspired one industry expert to comment: “There is nobody on this earth who understands their customer better than USAA.”64 By relentlessly focusing on its military customers, USAA has created extraordinary levels of customer satisfaction.
- 114. Courtesy of USAA Service outcome and customer loyalty are influenced by a host of variables. One study identified more than 800 critical behaviors that cause customers to switch services.65 These behaviors fall into eight categories (see Table 13.3). A more recent study honed in on the service dimensions customers would most like companies to measure. As Table 13.4 shows, knowledgeable frontline workers and the ability to achieve one-call-and-done rose to the top.66 Table 13.3 Factors Leading to Customer Switching Behavior Pricing · High price · Price increases · Unfair pricing · Deceptive pricing Inconvenience · Location/hours · Wait for appointment · Wait for service Core Service Failure · Service mistakes · Billing errors · Service catastrophe Service Encounter Failures · Uncaring
- 115. · Impolite · Unresponsive · Unknowledgeable Response to Service Failure · Negative response · No response · Reluctant response Competition · Found better service Ethical Problems · Cheat · Hard sell · Unsafe · Conflict of interest Involuntary Switching · Customer moved · Provider closed Source: Susan M. Keaveney, “Customer Switching Behavior in Service Industries: An Exploratory Study,” Journal of Marketing (April 1995), pp. 71–82. Reprinted with permission from Journal of Marketing, published by the American Marketing Association. Flawless service delivery is the ideal state for any service organization. “Marketing Memo: Recommendations for Improving Service Quality” offers a comprehensive set of
- 116. guidelines to which top service marketing organizations can adhere. Two important considerations in service delivery are managing customer expectations and incorporating self-service technologies. Figure 13.4 Dimensions of Service Customers Want Companies to Deliver Source: Convergys 2008 U.S. Customer Scorecard Marketing Memo: Recommendations for Improving Service Quality Pioneers in conducting academic service research, Berry, Parasuraman, and Zeithaml offer 10 lessons they maintain are essential for improving service quality across service industries. · Listening—Service providers should understand what customers really want through continuous learning about the expectations and perceptions of customers and noncustomers (for instance, by means of a service-quality information system). · Reliability—Reliability is the single most important dimension of service quality and must be a service priority. · Basic service—Service companies must deliver the basics and do what they are supposed to do—keep promises, use common sense, listen to customers, keep customers informed, and be determined to deliver value to customers.
- 117. · Service design—Service providers should take a holistic view of the service while managing its many details. · Recovery—To satisfy customers who encounter a service problem, service companies should encourage customers to complain (and make it easy for them to do so), respond quickly and personally, and develop a problem-resolution system. · Surprising customers—Although reliability is the most important dimension in meeting customers’ service expectations, process dimensions such as assurance, responsiveness, and empathy are most important in exceeding customer expectations, for example, by surprising them with uncommon swiftness, grace, courtesy, competence, commitment, and understanding. · Fair play—Service companies must make special efforts to be fair, and to demonstrate fairness, to customers and employees. · Teamwork—Teamwork is what enables large organizations to deliver service with care and attentiveness by improving employee motivation and capabilities. · Employee research—Marketers should conduct research with employees to reveal why service problems occur and what companies must do to solve problems. · Servant leadership—Quality service comes from inspired leadership throughout the organization; from excellent service- system design; from the effective use of information and technology; and from a slow-to-change, invisible, all-powerful,
- 118. internal force called corporate culture. Sources: Leonard L. Berry, A. Parasuraman, and Valarie A. Zeithaml, “Ten Lessons for Improving Service Quality,” MSI Reports Working Paper Series, No.03-001 (Cambridge, MA: Marketing Science Institute, 2003), pp. 61–82. See also, Leonard L. Berry’s books, On Great Service: A Framework for Action (New York: Free Press, 2006) and Discovering the Soul of Service (New York: Free Press, 1999), as well as his articles; Leonard L. Berry, Venkatesh Shankar, Janet Parish, Susan Cadwallader, and Thomas Dotzel, “Creating New Markets through Service Innovation,” Sloan Management Review (Winter 2006): 56–63; Leonard L. Berry, Stephan H. Haeckel, and Lewis P. Carbone, “How to Lead the Customer Experience,” Marketing Management (January–February 2003), pp. 18–23; and Leonard L. Berry, Kathleen Seiders, and Dhruv Grewal, “Understanding Service Convenience,” Journal of Marketing (July 2002), pp. 1–17. Managing Customer Expectations Customers form service expectations from many sources, such as past experiences, word of mouth, and advertising. In general, customers compare the perceived service with the expected service.67 If the perceived service falls below the expected service, customers are disappointed. Successful companies add benefits to their offering that not only satisfy customers but surprise and delight them. Delighting customers is a matter of
- 119. exceeding expectations.68 The service-quality model in Figure 13.6 highlights the main requirements for delivering high service quality.69 It identifies five gaps that cause unsuccessful delivery: Figure 13.6 Service-Quality Model Sources: A. Parasuraman, Valarie A. Zeithaml, and Leonard L. Berry, “A Conceptual Model of Service Quality and Its Implications for Future Research,” Journal of Marketing (Fall 1985), p. 44. Reprinted with permission of the American Marketing Association. The model is more fully discussed or elaborated in Valarie Zeithaml, Mary Jo Bitner, and Dwayne D. Gremler, Services Marketing: Integrating Customer Focus across the Firm, 4th ed. (New York: McGraw-Hill, 2006). 1. Gap between consumer expectation and management perception—Management does not always correctly perceive what customers want. Hospital administrators may think patients want better food, but patients may be more concerned with nurse responsiveness. 2. Gap between management perception and service-quality specification—Management might correctly perceive customers’ wants but not set a performance standard. Hospital administrators may tell the nurses to give “fast” service without specifying it in minutes. 3. Gap between service-quality specifications and service
- 120. delivery—Employees might be poorly trained, or incapable of or unwilling to meet the standard; they may be held to conflicting standards, such as taking time to listen to customers and serving them fast. 4. Gap between service delivery and external communications— Consumer expectations are affected by statements made by company representatives and ads. If a hospital brochure shows a beautiful room but the patient finds it to be cheap and tacky looking, external communications have distorted the customer’s expectations. 5. Gap between perceived service and expected service—This gap occurs when the consumer misperceives the service quality. The physician may keep visiting the patient to show care, but the patient may interpret this as an indication that something really is wrong. Based on this service-quality model, researchers identified five determinants of service quality, in this order of importance:70 1. Reliability—The ability to perform the promised service dependably and accurately. 2. Responsiveness—Willingness to help customers and provide prompt service. 3. Assurance—The knowledge and courtesy of employees and their ability to convey trust and confidence. 4. Empathy—The provision of caring, individualized attention to customers.
- 121. 5. Tangibles—The appearance of physical facilities, equipment, personnel, and communication materials. Based on these five factors, the researchers developed the 21- item SERVQUAL scale (see Table 13.5).71 They also note there is a zone of tolerance, or a range where a service dimension would be deemed satisfactory, anchored by the minimum level consumers are willing to accept and the level they believe can and should be delivered. Table 13.5 SERVQUAL Attributes Reliability · Providing service as promised · Dependability in handling customers’ service problems · Performing services right the first time · Providing services at the promised time · Maintaining error-free records · Employees who have the knowledge to answer customer questions Empathy · Giving customers individual attention · Employees who deal with customers in a caring fashion · Having the customer’s best interests at heart · Employees who understand the needs of their customers · Convenient business hours Responsiveness · Keeping customer informed as to when services will be
- 122. performed · Prompt service to customers · Willingness to help customers · Readiness to respond to customers’ requests Tangibles · Modern equipment · Visually appealing facilities · Employees who have a neat, professional appearance · Visually appealing materials associated with the service Assurance · Employees who instill confidence in customers · Making customers feel safe in their transactions · Employees who are consistently courteous Source: A. Parasuraman, Valarie A. Zeithaml, and Leonard L. Berry, “A Conceptual Model of Service Quality and Its Implications for Future Research,” Journal of Marketing (Fall 1985), pp. 41–50. Reprinted by permission of the American Marketing Association. The service-quality model in Figure 13.6 highlights some of the gaps that cause unsuccessful service delivery. Subsequent research has extended the model. One dynamic process model of service quality was based on the premise that customer perceptions and expectations of service quality change over time, but at any one point they are a function of prior
- 123. expectations about what will and what should happen during the service encounter, as well as the actual service delivered during the last contact.72 Tests of the dynamic process model reveal that the two different types of expectations have opposite effects on perceptions of service quality. 1. Increasing customer expectations of what the firm will deliver can lead to improved perceptions of overall service quality. 2. Decreasing customer expectations of what the firm should deliver can also lead to improved perceptions of overall service quality. Much work has validated the role of expectations in consumers’ interpretations and evaluations of the service encounter and the relationship they adopt with a firm over time.73 Consumers are often forward-looking with respect to their decision to keep or switch from a service relationship. Any marketing activity that affects current or expected future usage can help to solidify a service relationship. With continuously provided services, such as public utilities, health care, financial and computing services, insurance, and other professional, membership, or subscription services, customers have been observed to mentally calculate their payment equity—the perceived economic benefits in relationship to the economic costs. In other words, customers ask themselves, “Am I using this service enough, given what I
- 124. pay for it?” Long-term service relationships can have a dark side. An ad agency client may feel that over time the agency is losing objectivity, becoming stale in its thinking, or beginning to take advantage of the relationship.74 Incorporating Self-Service Technologies (SSTs) Consumers value convenience in services.75 Many person-to- person service interactions are being replaced by self-service technologies (SSTs). To the traditional vending machines we can add automated teller machines (ATMs), self-pumping at gas stations, self-checkout at hotels, and a variety of activities on the Internet, such as ticket purchasing, investment trading, and customization of products. Not all SSTs improve service quality, but they can make service transactions more accurate, convenient, and faster. Obviously, they can also reduce costs. One technology firm, Comverse, estimates the cost to answer a query through a call center at $7, but only 10 cents online. One of its clients was able to direct 200,000 calls a week through online self-service support, saving $52 million a year.76 Every company needs to think about improving its service using SSTs. Marketing academics and consultants Jeffrey Rayport and Bernie Jaworski define a customer-service interface as any place at which a company seeks to manage a relationship with a customer, whether through people, technology, or some
- 125. combination of the two.77 They feel that although many companies serve customers through a broad array of interfaces, from retail sales clerks to Web sites to voice-response telephone systems, the whole often does not add up to the sum of its parts, increasing complexity, costs, and customer dissatisfaction as a result. Successfully integrating technology into the workforce thus requires a comprehensive reengineering of the front office to identify what people do best, what machines do best, and how to deploy them separately and together. Some companies have found that the biggest obstacle is not the technology itself, but convincing customers to use it, especially for the first time. Customers must have a clear sense of their roles in the SST process, must see a clear benefit, and must feel they can actually use it.78 SST is not for everyone. Although some automated voices are actually popular with customers— the unfailingly polite and chipper voice of Amtrak’s “Julie” consistently wins kudos from callers—many can incite frustration and even rage. Managing Product-Support Services No less important than service industries are product-based industries that must provide a service bundle. Manufacturers of equipment—small appliances, office machines, tractors, mainframes, airplanes—all must provide product-support services. Product-support service is becoming a major battleground for competitive advantage.
- 126. Chapter 12 described how products could be augmented with key service differentiators—ordering ease, delivery, installation, customer training, customer consulting, maintenance, and repair. Some equipment companies, such as Caterpillar Tractor and John Deere, make a significant percentage of their profits from these services.79 In the global marketplace, companies that make a good product but provide poor local service support are seriously disadvantaged. Many product companies have a stronger Web presence than they had before. They must ensure that they offer adequate—if not superior—service online as well. “Marketing Memo: Assessing E-Service Quality” reviews two models of online service quality. Identifying and Satisfying Customer Needs Traditionally, customers have had three specific worries about product service:80 · They worry about reliability and failure frequency. A farmer may tolerate a combine that will break down once a year, but not two or three times a year. · They worry about downtime. The longer the downtime, the higher the cost. The customer counts on the seller’s service dependability—the seller’s ability to fix the machine quickly or at least provide a loaner.81 · They worry about out-of-pocket costs. How much does the customer have to spend on regular maintenance and repair
- 127. costs? A buyer takes all these factors into consideration and tries to estimate the life-cycle cost, which is the product’s purchase cost plus the discounted cost of maintenance and repair less the discounted salvage value. A one-computer office will need higher product reliability and faster repair service than an office where other computers are available if one breaks down. An airline needs 100 percent reliability in the air. Where reliability is important, manufacturers or service providers can offer guarantees to promote sales. Marketing Memo: Assessing E-Service Quality Academic researchers Zeithaml, Parasuraman, and Malhotra define online service quality as the extent to which a Web site facilitates efficient and effective shopping, purchasing, and delivery. They identified 11 dimensions of perceived e-service quality: access, ease of navigation, efficiency, flexibility, reliability, personalization, security/privacy, responsiveness, assurance/trust, site aesthetics, and price knowledge. Some of these service-quality dimensions were the same online as offline, but some specific underlying attributes were different. Different dimensions emerged with e-service quality too. Empathy didn’t seem to be as important online, unless there were service problems. Core dimensions of regular service quality were efficiency, fulfillment, reliability, and privacy; core dimensions of service recovery were responsiveness,
- 128. compensation, and real-time access to help. Another set of academic researchers, Wolfinbarger and Gilly, developed a reduced scale of online service quality with four key dimensions: reliability/fulfillment, Web site design, security/privacy, and customer service. The researchers interpret their study findings to suggest that the most basic building blocks of a “compelling online experience” are reliability and functionality to provide time savings, easy transactions, good selection, in-depth information, and the “right” level of personalization. Their 14-item scale looks like this: Reliability/Fulfillment · The product that came was represented accurately by the Web site. · You get what you ordered from this Web site. · The product is delivered by the time promised by the company. Web Site Design · This Web site provides in-depth information. · The site doesn’t waste my time. · It is quick and easy to complete a transaction at this Web site. · The level of personalization at this site is about right, not too much or too little. · This Web site has good selection. Security/Privacy
- 129. · I feel that my privacy is protected at this site. · I feel safe in my transactions with this Web site. · This Web site has adequate security transactions. Customer Service · The company is willing and ready to respond to customer needs. · When you have a problem, the Web site shows a sincere interest in solving it. · Inquiries are answered promptly. Sources: Mary Wolfinbarger and Mary C. Gilly, “E-TailQ: Dimensionalizing, Measuring, and Predicting E-Tail Quality,” Journal of Retailing 79 (Fall 2003), pp. 183–98; Valarie A. Zeithaml, A. Parasuraman, and Arvind Malhotra, “A Conceptual Framework for Understanding E-Service Quality: Implications for Future Research and Managerial Practice,” Marketing Science Institute Working Paper, Report No. 00-115, 2000. To provide the best support, a manufacturer must identify the services customers value most and their relative importance. For expensive equipment, manufacturers offer facilitating services such as installation, staff training, maintenance and repair services, and financing. They may also add value-augmenting services that extend beyond the functioning and performance of the product itself. Johnson Controls reached beyond its climate control equipment and components business to manage integrated facilities by offering products and services that
- 130. optimize energy use and improve comfort and security. A manufacturer can offer, and charge for, product-support services in different ways. One specialty organic-chemical company provides a standard offering plus a basic level of services. If the customer wants additional services, it can pay extra or increase its annual purchases to a higher level, in which case additional services are included. Many companies offer service contracts (also called extended warranties), in which sellers agree to provide free maintenance and repair services for a specified period of time at a specified contract price. Product companies must understand their strategic intent and competitive advantage in developing services. Are service units supposed to support or protect existing product businesses or to grow as an independent platform? Are the sources of competitive advantage based on economies of scale or economies of skill?82 See Figure 13.7 strategies of different service companies. Figure 13.7 Service Strategies for Product Companies Source: Byron G. Auguste, Eric P. Harmon, and Vivek Pandit, “The Right Service Strategies for Product Companies,” The McKinsey Quarterly, no. 1 (2006), pp. 41–51. All rights reserved. Reprinted by permission of McKinsey & Company. Postsale Service Strategy The quality of customer service departments varies greatly. At
- 131. one extreme are departments that simply transfer customer calls to the appropriate person or department for action with little follow-up. At the other extreme are departments eager to receive customer requests, suggestions, and even complaints and handle them expeditiously. Some firms even proactively contact customers to provide service after the sale is complete.83 Customer-Service Evolution Manufacturers usually start by running their own parts-and- service departments. They want to stay close to the equipment and know its problems. They also find it expensive and time consuming to train others and discover they can make good money from parts and service if they are the only supplier and can charge a premium price. In fact, many equipment manufacturers price their equipment low and compensate by charging high prices for parts and service. Over time, manufacturers switch more maintenance and repair service to authorized distributors and dealers. These intermediaries are closer to customers, operate in more locations, and can offer quicker service. Still later, independent service firms emerge and offer a lower price or faster service. A significant percentage of auto-service work is now done outside franchised automobile dealerships by independent garages and chains such as Midas Muffler, and Sears. Independent service organizations handle mainframes, telecommunications
- 132. equipment, and a variety of other equipment lines. The Customer-Service Imperative Customer-service choices are increasing rapidly, however, and equipment manufacturers increasingly must figure out how to make money on their equipment, independent of service contracts. Some new-car warranties now cover 100,000 miles before servicing. The increase in disposable or never-fail equipment makes customers less inclined to pay 2 percent to 10 percent of the purchase price every year for a service. A company with several hundred laptops, printers, and related equipment might find it cheaper to have its own service people on-site. Summary 1. A service is any act or performance that one party can offer to another that is essentially intangible and does not result in the ownership of anything. It may or may not be tied to a physical product. 2. Services are intangible, inseparable, variable, and perishable. Each characteristic poses challenges and requires certain strategies. Marketers must find ways to give tangibility to intangibles, to increase the productivity of service providers, to increase and standardize the quality of the service provided, and to match the supply of services with market demand. 3. Marketing of services faces new realities in the 21st century due to customer empowerment, customer co-production, and the
- 133. need to satisfy employees as well as customers. 4. In the past, service industries lagged behind manufacturing firms in adopting and using marketing concepts and tools, but this situation has changed. Achieving excellence in service marketing calls not only for external marketing but also for internal marketing to motivate employees, as well as interactive marketing to emphasize the importance of both “high tech” and “high touch.” 5. Top service companies excel at the following practices: a strategic concept, a history of top-management commitment to quality, high standards, profit tiers, and systems for monitoring service performance and customer complaints. They also differentiate their brands through primary and secondary service features and continual innovation. 6. Superior service delivery requires managing customer expectations and incorporating self-service technologies. Customers’ expectations play a critical role in their service experiences and evaluations. Companies must manage service quality by understanding the effects of each service encounter. 7. Even product-based companies must provide post-purchase service. To offer the best support, a manufacturer must identify the services customers value most and their relative importance. The service mix includes both presale services (facilitating and value-augmenting services) and postsale services (customer service departments, repair and maintenance services).
- 134. Applications Marketing Debate Is Service Marketing Different from Product Marketing? Some service marketers maintain that service marketing is fundamentally different from product marketing and relies on different skills. Some traditional product marketers disagree, saying “good marketing is good marketing.” Take a position: Product and service marketing are fundamentally differentversusProduct and service marketing are highly related. Marketing Discussion Educational Institutions Colleges, universities, and other educational institutions can be classified as service organizations. How can you apply the marketing principles developed in this chapter to your school? Do you have any advice as to how it could become a better service marketer? Marketing Excellence: >>The Ritz-Carlton Kristoffer Tripplaar/Alamy Images Few brands attain such a high standard of customer service as the luxury hotel, The Ritz-Carlton. The Ritz-Carlton dates back to the early 20th century and the original Ritz-Carlton Boston, which revolutionized the way U.S. travelers viewed and experienced customer service and luxury in a hotel. The Ritz-
- 135. Carlton Boston was the first of its kind to provide guests with a private bath in each guest room, fresh flowers throughout the hotel, and an entire staff dressed in formal white tie, black tie, or morning coat attire. In 1983, hotelier Horst Schulze and a four-person development team acquired the rights to the Ritz-Carlton name and created the Ritz-Carlton concept as it is known today: a company-wide concentration on both the personal and the functional side of service. The five-star hotel provides impeccable facilities but also takes customer service extremely seriously. Its credo is, “We are Ladies and Gentlemen serving Ladies and Gentlemen.” According to the company’s Web site, The Ritz-Carlton “pledge(s) to provide the finest personal service and facilities for our guests who will always enjoy a warm, relaxed, yet refined ambience.” The Ritz-Carlton fulfills this promise by providing impeccable training for its employees and executing its Three Steps of Service and 12 Service Values. The Three Steps of Service state that employees must use a warm and sincere greeting always using the guest’s name, anticipate and fulfill each guest’s needs, and give a warm good-bye again using the guest’s name. Every manager carries a laminated card with the 12 Service Values, which include bullets such as number 3: “I am empowered to create unique, memorable and personal experiences for our guests,” and number 10: “I am proud of my professional
- 136. appearance, language and behavior.” Simon Cooper, the company president and chief operating officer, explained, “It’s all about people. Nobody has an emotional experience with a thing. We’re appealing to emotions.” The Ritz-Carlton’s 38,000 employees at 70 hotels in 24 countries go out of their way to create unique and memorable experiences for their guests. While The Ritz-Carlton is known for training its employees on exceptional customer service, the hotel also reinforces its mission and values to its employees on a daily basis. Each day, managers gather their employees for a 15-minute “line up.” During this time, managers touch base with their employees, resolve any impending problems, and spend the remaining time reading and discussing what The Ritz-Carlton calls “wow stories.” The same “wow story” of the day is read to every single employee around the world. These true stories recognize an individual employee for his or her outstanding customer service and also highlight one of the 12 Service Values. For example, one family staying at the Ritz-Carlton, Bali, needed a particular type of egg and milk for their son who suffered from food allergies. Employees could not find the appropriate items in town, but the executive chef at the hotel remembered a store in Singapore that sold them. He contacted his mother-in-law, who purchased the items and personally flew them over 1,000 miles to Bali for the family. This example showcased Service Value 6:
- 137. “I own and immediately resolve guests’ problems.” In another instance, a waiter overheard a man telling his wife, who used a wheelchair, that it was too bad he couldn’t get her down to the beach. The waiter told the maintenance crew, and by the next day they had constructed a wooden walkway down to the beach and pitched a tent at the far end where the couple had dinner. According to Cooper, the daily wow story is “the best way to communicate what we expect from our ladies and gentlemen around the world. Every story reinforces the actions we are looking for and demonstrates how each and every person in our organization contributes to our service values.” As part of company policy, each employee is entitled to spend up to $2,000 on a guest to help deliver an anticipated need or desire. The hotel measures the success of its customer service efforts through Gallup phone interviews, which ask both functional and emotional questions. Functional questions ask “How was the meal? Was your bedroom clean?” while emotional questions uncover a sense of the customer’s well-being. The Ritz-Carlton uses these findings as well as day-to-day experiences to continually enhance and improve the experience for its guests. In less than three decades, The Ritz-Carlton has grown from 4 locations to over 70 and earned two Malcolm Baldrige Quality Awards—the only company ever to win the prestigious award twice. Questions
- 138. 1. How does The Ritz-Carlton match up to competitive hotels? What are the key differences? 2. Discuss the importance of the “wow stories” in customer service for a luxury hotel like The Ritz-Carlton. Sources: Robert Reiss, “How Ritz-Carlton Stays at Top,” Forbes, October 30, 2009; Carmine Gallo, “Employee Motivation the Ritz-Carlton Way,” BusinessWeek, February 29, 2008; Carmine Gallo, “How Ritz-Carlton Maintains Its Mystique,” BusinessWeek, February 13, 2007; Jennifer Robison, “How The Ritz-Carlton Manages the Mystique,” Gallup Management Journal, December 11, 2008; The Ritz Carlton, www.RitzCarlton.com. Marketing Excellence: >>Mayo Clinic Kristoffer Tripplaar/Alamy Images Mayo Clinic is the first and largest integrated not-for-profit medical group practice in the world. William and Charles Mayo founded the clinic over 100 years ago as a small outpatient facility and pioneered the concept of a medical group practice— a model that is widely used today. Mayo Clinic provides exceptional medical care and leads the nation in many specialties such as cancer, heart disease, respiratory disorders, and urology. It consistently ranks at the
- 139. top of U.S. News & World Report’s Best Hospitals list and enjoys 85 percent brand recognition among U.S. adults. It has reached this level of success by taking a different approach from most clinics and hospitals and putting a relentless focus on the patient’s experience. The clinic’s two interrelated core values trace back to its founders and are at the heart of all the organization does: placing the patient’s interests above all others and practicing teamwork. Every aspect of the patient’s experience is considered at Mayo Clinic’s three campuses in Rochester (MN), Scottsdale (AZ), and Jacksonville (FL). The moment a patient walks into one of Mayo Clinic’s facilities, he or she feels the difference. New patients are welcomed by professional greeters who walk them through the administrative processes. Returning patients are greeted by name and with a warm smile. The buildings have been designed so that, in the words of the architect of one, “patients feel a little better before they see their doctors.” The 21-story Gonda Building in Rochester has spectacular wide- open spaces with the capability of adding 10 more floors. Fine art hangs on the walls, and doctor’s offices are designed to feel cozy and comforting rather than sterile and impersonal. The lobby of the Mayo Clinic hospital in Scottsdale has an indoor waterfall and a wall of windows overlooking mountains. In pediatric exam rooms, resuscitation equipment is hidden behind a large cheery picture. Hospital rooms feature
- 140. microwave ovens and chairs that really do convert to beds because, as one staff member explained, “People don’t come to the hospital alone.” The newest emergency medical helicopter was customized to incorporate high-tech medical equipment and is one of the most advanced aircraft in the world. The other significant difference in serving patients is Mayo Clinic’s concept of teamwork. A patient can come to Mayo Clinic with or without a physician’s referral. At that time, the patient’s team is assembled, which can include the primary physician, surgeons, radiation oncologists, radiologists, nurses, residents, or other specialists with the appropriate skill, experience, and knowledge. Teams of medical professionals work together to diagnose patients’ medical problems, including debating test results for hours to determine the most accurate diagnosis and best treatments. Once a team consensus has been reached, the leader meets with the patient and discusses his or her options. Throughout the process, patients are encouraged to take part in the discussion. If surgery is necessary, the procedure is often scheduled to take place within 24 hours, a dramatic difference from the long wait patients experience at many hospitals. Mayo Clinic’s doctors understand that those who seek their care want action as soon as possible. Mayo’s doctors are put on salary instead of being paid by the number of patients seen or tests ordered. As a result, patients
- 141. receive more individualized attention and care, and physicians work together instead of against each other. As one pediatrician at Mayo explained, “We’re very comfortable with calling colleagues for what I call ‘curbside consulting.’ I don’t have to make a decision about splitting a fee or owing someone something. It’s never a case of quid pro quo.” Mayo Clinic is a not-for-profit, so all its operating income is invested back into the clinic’s research and education programs. Breakthrough research is quickly implemented into the quality care of the patients. Mayo Clinic offers educational programs through its five schools, and many of its physicians come up through these programs with Mayo’s philosophies engrained in their heads, including Mayo’s motto: “The best interest of the patient is the only interest to be considered.” President Obama often cites Mayo Clinic as a key example in health care reform. Mayo Clinic has been recognized by third parties for decades for its independent thinking, outstanding service and performance, and core focus on patient care and satisfaction. Questions 1. Explain why Mayo Clinic is so good at customer service. Why has it been so successful practicing medicine differently from other hospitals? 2.
- 142. Do conflicts of interest exist between wanting to make your patient happy and providing the best medical care possible? Why or why not? Sources: Avery Comarow, “America’s Best Hospitals,” U.S. News & World Report, July 15, 2009; Chen May Yee, “Mayo Clinic Reports 2007 Revenue Grew 10%,” Star Tribune, March 17, 2008; Leonard L. Berry and Kent D. Seltman, Management Lessons from Mayo Clinic (New York: McGraw-Hill, 2008); Leonard L. Berry, “Leadership Lessons from Mayo Clinic,” Organizational Dynamics 33 (August 2004), pp. 228–42; Leonard L. Berry and Neeli Bendapudi, “Clueing in Customers,” Harvard Business Review, February 2003, pp. 100– 106; John La Forgia, Kent Seltman, and Scott Swanson, “Mayo Clinic: Sustaining a Legacy Brand and Leveraging Its Equity in the 21st-Century Market,” Presentation at the Marketing Science Institute’s Conference on Brand Orchestration, Orlando, FL, December 4–5, 2003; Paul Roberts, “The Agenda—Total Teamwork,” Fast Company, March 31, 1999.