Portable Scalable Data Visualization Techniques for Apache Spark and Python Notebook-based Analytics
0 likes444 views
The document discusses portable and scalable data visualization techniques for Spark and notebook-based analytics, emphasizing the challenges of portability. It outlines various strategies, including image buffers, HTML/JS integration, and leveraging Spark resources. Additionally, it provides links to demo notebooks and references for further exploration of Python visualization tools.
1 of 11
Downloaded 14 times


Portable Scalable Data Visualization Techniques for Apache Spark and Python Notebook-based Analytics
- 2. Portable & Scalable Data Visualization Techniques for Spark & Notebook based Analytics Douglas Moore Enterprise Solutions Architect, Databricks June 2020
- 3. Why Portable Data Visualizations?
- 5. https://www.anaconda.com/blog/python-data-visualization-2018-why-so-many-libraries Graphic by Jake VanderPlas Blog by James A. Bednar
- 6. Strategies
- 7. Summary: Portable Data Visualization Strategies ▪ Image buffer, Image file ▪ HTML/JS in-line ▪ Data Lake to Data Visualization ▪ Hooks ▪ Headless Chrome browser ▪ Add a proxy ▪ Scale out w/ Spark
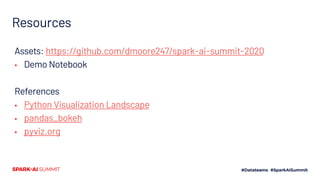
- 8. Resources Assets: https://github.com/dmoore247/spark-ai-summit-2020 ▪ Demo Notebook References ▪ Python Visualization Landscape ▪ pandas_bokeh ▪ pyviz.org
- 9. Feedback Your feedback is important to us. Don’t forget to rate and review the sessions.
- 11. Data Lake Visualization Drawn to scaleBronze
