SlideShare a Scribd company logo
Laboratory Quality assurance
and quality Control
QA
 Quality Assurance - is defined as the overall
program that ensures that the final results reported
by the laboratory are correct.
 describes the steps taken in and outside the lab to
achieve reliable results right from the preparation
of the patient and ending with the correct
interpretation of the results
 Systematic Application of optimum procedures to
ensure valid, reproducible, and accurate results.
QC
 Quality Control - QC refers to the measures that must be included
during each assay run to verify that the test is working properly.
 This involves the technique and precautions taken by laboratory
personnel to ensure that tests are performed correctly.
 Lab QC = Running controls and statistically analyzing the data before
releasing patient results
 “The aim of quality control is simply to ensure that the results
generated by the test are correct. However, quality assurance is
concerned with much more: that the right test is carried out on the right
specimen, and that the right result and right interpretation is delivered
to the right person at the right time”
Quality assessment
 Quality Assessment - quality assessment (also known as
proficiency testing) is a mean to determine the quality of
the results generated by the laboratory. Quality assessment
is a challenge to the effectiveness of the QA and QC
programs.
 Quality Assessment and Quality Control measures must
include a means to identify, classify, and limit error.
 Quality Assessment may be external or internal, examples
of external programs include NEQAS, HKMTA, and Q-
probes. UVRI,EAQAS
Standards
• Highly purified substance, whose exact composition is
known.
• Non- biological in nature
• Uses
 Run with pt. sample to validate the run
• Ex. With each run of a Urine Osmolality a Std. is
often run to determine the accuracy and precision of
the run
 Generate Calibration Curve
 Different concentrations of the Std. are used to plot
a graphic curve
 Patient samples are compared to the calibration
curve and the concentration of the analyte is
quantified.
Reference Solutions
• Biological in nature
• Have an ‘assigned’ value
• Used exactly like a standard
Controls
• Resemble the patient sample
 Have same characteristics as patient sample, color
viscosity etc.
• Can be purchased as
 ‘assayed’ – come with range of established values
 ‘un-assayed’ - your lab must use statistical
measures to establish their range of values.
• The results of any run / analysis must be
compare to the ‘range of expected’ results to
determine acceptability of the analysis.
Controls, cont’d.
• Depending on the test 1 or more levels of control
will be required.
• Control within expected range = IN CONTROL=
accept the QC and report patient results
• Control outside of expected range= OUT of
CONTROL=address
Comparing Results to the
Appropriate Range
• Control results - compared to their own range of
expected results determined by the control
manufacturer or individual laboratory
• Patient values – compared to published reference
values or patient population reference ranges
established within the laboratory.
 Accuracy; the extent to which measurements agree with the true
value of the quantity being measured
 This can be aided by the use of properly standardized procedures,
statistically valid comparisons of new methods with established
refraince methods, the use of controls and participate in
proficiency testing programmes.
 Precision; the degree of the reproducibility of the test results. It
can be ensured by the proper inclusion of standards reference
samples or control solutions.
 Reliability; this is when the method used maintains a steady state
of accuracy and precision over a considerable period of time.
Precision and Accuracy
Low Accuracy,
High Precision
High Accuracy,
Low Precision
High Accuracy,
High Precision
Sensitivity and specificity
 Sensitivity; This is the minimum amount of a substance
in a biological medium that can be determined with the
accuracy and precision and specific by a particular
method
 The clinical sensitivity of an assay is the fraction of those
subjects with a specific disease that the assay correctly
predicts.
 Specificity; this the exclusive measurements of a
compound for which the method has been design
 The clinical specificity is the fraction of those individuals
without the disease that the assay correctly predicts.
Elements of QA
 Technical competence; the service provider must
have the right knowledge, skills and attitude to
perform laboratory test.
 Effectiveness; the lab personnel shd follow the
norms and guidelines for the procedures
 Continuity; it means providing a range of services
within the means of the lab
 Efficiency an efficient services provider shd produce
the test results within available resources
Continues…..
 Validation checks whether the test procedure or
any equipment satisfy the set standard
 Safety; shd prevent hazards in the laboratory, the
service provider, pts, other health workers or any
other persons who enters and use lab
 Facility; the lab shd be of a suitable size construction
and location to meet the requirements of the range of
tests offered.
QA phases.
 Pre-analytical phase of quality assurance ensures
quality in everything before testing process both
within the lab and outside the lab
 Proper selection and evaluation of the testing
procedures
 Correct ordering of the tests
 Proper preparation of the patient for the test.e.g
fasting sugar, OGTT
Continues…
 Proper identification of the patient
 Proper collection of the samples i.e in a correct containers and
under condition specified by the test procedure.
 Timely transportation of the samples to the lab,
 Proper handling of the sample from time of transportation to
the time of analysis
 Proper handling of the sample in the lab, includes proper
documentation of the sample, identification within the lab
correct centrifugation technique
Analytical phase
 Proper labeling and use of reagnts must labeled with
conc, date of preparation, expiry date, initials of the
person who prepared.
 Periodic calibration of pipetting devices and careful
maintenance of instruments
 Using control samples to check for bias
 Training lab workers
 Establishing performance std for each test
18
Examination/analytical
Laboratory Analysis
Examination Phase
Examples:
established algorithm followed
correct timing of test
reported results when control
results pass or within the range
proper dilution and pipetting of sample or
reagents
 appropriate storage of reagent
Post analytical phase
 This is the process of verifying quality once the sample
has been analyzed
 Verification of the calculations of final report
 Review of test results for possible errors
 Writing reports that are easy to read and interpret
 Procedures for informing the clinicians about the tests
that requires immediate attention
 Verification of correct interpretation of lab test by the lab
personals and physicians.
Variables that affect the
quality of results
 The educational background and training of the
laboratory personnel (incompetency)
 The condition of the specimens
 The controls used in the test runs
 Reagents
 Equipment
 The interpretation of the results
 The transcription of results
 The reporting of results
Errors in clinical laboratory
 True value - this is an ideal concept which cannot be
achieved.
 Accepted true value - the value approximating the
true value, the difference between the two values is
negligible.
 Error - the discrepancy between the result of a
measurement and the true (or accepted true value).
Sources of error
 Input data required - such as standards used, calibration values, and
values of physical constants.
 Inherent characteristics of the quantity being measured - e.g. CFT
and HAI titre.
 Instruments used - accuracy, repeatability.
 Observer fallibility - reading errors, blunders, equipment selection,
analysis and computation errors.
 Environment - any external influences affecting the measurement.
 Theory assumed - validity of mathematical methods and
approximations.
Error
• Error is the discrepancy between the result
obtained in the testing process and its ‘True
Value’ / ‘Accepted True Value’
• Pre-Analytical Errors=40%
• Analytical Errors=20%
• Post-Analytical Errors=20%
Pre-Analytical Errors
• Before the specimen is run
• Examples: Clerical, patient ID, specimen selection
and contamination, improper storage of reagents
and specimen, improper transport, etc.
• Through Quality Assurance measures, the
laboratory tries to maintain control over these
factors
 Well trained phlebotomy staff, nurses, and physicians
 Use of easy patient & specimen identification methods,
such as bar code identification.
Analytical error
• Testing errors
• Random or indeterminate
 Hard or impossible to trace
 Examples: Electricity surge, One-time events, etc
• Systematic or determinant
 Identifiable cause
 Examples: Specimen carryover, contaminated reagents,
instrument component malfunction, dirty electrodes, etc.
• Through Quality Control measures, such as always
running controls, the laboratory limits these
errors.
Post-Analytical Errors
• After testing
• Examples: Clerical, result reported on wrong patient,
instrument to host computer errors, etc.
 transcription error in reporting
 report illegible
 report sent to the wrong location
 report not sent
 QA measures such as comprehensive and easily read Report
sheets for manual tests must be implemented when problems
are identified.
Random Error
 An error which varies in an unpredictable manner, in magnitude
and sign, when a large number of measurements of the same
quantity are made under effectively identical conditions.
 Random errors create a characteristic spread of results for any test
method and cannot be accounted for by applying corrections.
Random errors are difficult to eliminate but repetition reduces the
influences of random errors.
 Examples of random errors include errors in pipetting and changes
in incubation period. Random errors can be minimized by training,
supervision and adherence to standard operating procedures.
Continues…..
 This is where results differ from the correct results by varying
amounts. The common causes includes;
 Incorrect and variable pipetting
 Inadequate mixing of the sample with the reagents
 Incubation at inconsistence temp or of in correct length of time
 Dirty test tubes, pipettes or other glass wares used in the test
 Fluctuating colorimeter reading due to unreliable main voltage
supply
 Incomplete removal interfering substances in serum e.g RBCs
or proteins
 Use of dirty or finger marked cuvettes or reading samples
containing air bubbles.
Random Errors
x
x x
x x
True x x x x
Value x x x
x x x
x
x
x
Systematic Error
 An error which, in the course of a number of measurements of
the same value of a given quantity, remains constant when
measurements are made under the same conditions, or varies
according to a definite law when conditions change.
 Systematic errors create a characteristic bias in the test results
and can be accounted for by applying a correction.
 Systematic errors may be induced by factors such as variations in
incubation temperature, blockage of plate washer, change in the
reagent batch or modifications in testing method.
Systematic Errors
x
x x x x x x x
True x
Value
Qualitative QC vs. Quantitative QC
• Quantitative tests
• Measured quantity/concentration of analyte in the
control
• Data must be graphed and evaluated by
numerical statistics
 Examples: WBC count, Glucose, quantitative HCG
• Qualitative tests and Semi-Quantitative
• Qualitative=Pos/Neg or Present/Absent
• Semi-Quantitative=Small, Medium, Large
• Generally not statistically analyzed
 Examples: Clinitest, Acetest, qualitative HCG
QC Data Analysis:
Measures of Central tendency
• Measures of Central tendency
( how numerical values can be expressed
as a central value )
• Mean - Average value
• Median - Middle observation
• Mode - Most frequent observation
QC Data Analysis:
Variance and Standard Deviation
• An important tool in the statistical analysis
is determining:
• Variance =
• Standard Deviation (SD) - a measure of
the scatter around the arithmetic average
(mean) in a Gaussian distribution.
• SD=
• or Square Root of variance
How to Manually Calculate Variance
and Standard Deviation:
1. Subtract the mean from each score.
2. Square each Result
3. Sum all of the squares
4. Divide the sum of the squares by the
number of data points (N)
5. The result is the VARIANCE
6. Take the square root of the variance.
7. The result is the SD.
Quality Control
• 95% confidence limit (± 2 SD) - 95% of all
the results in a Gaussian distribution
How many points fall within
1SD?
• Another way of reviewing data
• Dispersal / or how the individual data points are
distributed about the central value
Levey-Jennings QC Graph (no
points)
Levey-Jennings QC Chart for 1 month
Statistical concepts
 Shift – when there are 6 consecutive data results on
the same side of the mean
Statistical concepts
 Trend – when there is a consistent increase OR
decrease in the data points over a period of 6 days.
(A line connecting the dots will cross the mean.)
Shewhart Control Charts
A Shewhart Control Chart depend on the use of IQC specimens and is
developed in the following manner:-
 Put up the IQC specimen for at least 20 or more assay runs and record
down the O.D./cut-off value or antibody titre (whichever is applicable).
 Calculate the mean and standard deviations (s.d.)
 Make a plot with the assay run on the x-axis, and O.D./cut-off or
antibody titre on the y axis.
 Draw the following lines across the y-axis: mean, -3, -2, -2, 1, 2, and 3
s.d.
 Plot the O.D./cut-off obtained for the IQC specimen for subsequent assay
runs
 Major events such as changes in the batch no. of the kit and instruments
used should be recorded on the chart.
Westgard rules
 The formulation of Westgard rules were based on statistical
methods. Westgard rules are commonly used to analyse data in
Shewhart control charts.
 Westgard rules are used to define specific performance limits for a
particular assay and can be use to detect both random and systematic
errors.
 There are six commonly used Westgard rules of which three are
warning rules and the other three mandatory rules.
 The violation of warning rules should trigger a review of test
procedures, reagent performance and equipment calibration.
 The violation of mandatory rules should result in the rejection of the
results obtained with patients’ serum samples in that assay.
0
10
20
30
40
50
60
70
80
90
100
1 2 3 4 5 6 7 8 9 10 11 12 13 14 15 16
Shewhart Chart
+3 sd
-3 sd
+2 sd
-2 sd
-1 sd
+1 sd
VZV IgG ELISA: Target Value = 49 U/ml
Antibody
Units
Target value
Assay Run
13s Westgard Rule
 13s
 A single control measurement exceeds three
standard deviations from the target mean
 : It is violated when the IQC value exceeds the mean
by 3SD. The assay run is regarded as out of control
 Action - Reject
12s Westgard Rule
 12s
 It is violated if the IQC value exceeds the mean by
2SD. It is an event likely to occur normally in less
than 5% of cases
 Action – must consider other rule violations (trend,
shift, etc)
 This is a warning
22s Westgard Rule
 22s
 It detects systematic errors and is violated when two
consecutive IQC values exceed the mean on the same side
of the mean by 2SD.
 Action – Reject
R4s Westgard Rule
 R4s
 One control measurement in a group exceeds the
mean plus 2S and another exceeds the mean
minus 2S.
 Action – Reject
41s Westgard Rule
 41s
 It is violated if four consecutive IQC values exceed
the same limit (mean  1SD) and this may indicate
the need to perform instrument maintenance or
reagent calibration
 Action – Reject
Continues.
 Mandatory 10x
 This rule is violated when the last 10 consecutive IQC values
are on the same side of the mean or target value.
0
10
20
30
40
50
60
70
80
90
100
1 2 3 4 5 6 7 8 9 10 11 12 13 14 15 16
Westgard Rules: 10X
+3 sd
-3 sd
+2 sd
-2 sd
-1 sd
+1 sd
VZV IgG ELISA: Target Value = 49 U/ml
Antibody
Units
Target value
Assay Run
If QC FAILS?
One Possible Plan of Action: (your lab may advise another)
1. Look at vial of control. If using the last drops—reconstitute or open
new vial.
2. If plenty of QC left in vial, mix well, repour, rerun. Most issues
resolve by now. However…
3. If the QC fails again, check the volumes and expiration dates of the
reagents. Change out if necessary.
4. Calibrate the instrument, run cleaning sequence, or perform
maintenance as needed.
5. Rerun control.
6. If controls fail repeatedly after multiple efforts, call technical
support.
Use discretion keeping in mind that controls, calibrators, and
reagents are expensive.
Other QC Checks
• Delta checks
• Compares a current test result on a patient to last
run patient test, flagging results outside expected
physiological variation.
• Many False positives, but DO NOT ignore--
investigate
• MCHC=Hgb / Hct * 100 (expect 32-36)
• Rule of 3=Hemoglobin x3 = hematocrit
• Compare patient BUN / creatinine (10/1 –
20/1)
Internal Quality Control Program
for Serological Testing
An internal quality control program depend on the use of
internal quality control (IQC) specimens, Shewhart Control
Charts, and the use of statistical methods for interpretation.
Internal Quality Control Specimens
IQC specimens comprises either (1) in-house patient sera
(single or pooled clinical samples), or (2) international serum
standards with values within each clinically significant ranges.
Follow-up action in the event of a
violation
There are three options as to the action to be taken in the event of a
violation of a Westgard rule:
 Accept the test run in its entirety - this usually applies when
only a warning rule is violated.
 Reject the whole test run - this applies only when a
mandatory rule is violated.
 Enlarge the greyzone and thus re-test range for that particular
assay run - this option can be considered in the event of a
violation of either a warning or mandatory rule.

More Related Content

PDF
Quality assurance in a medical laboratory
PPTX
qc histo ss final - Copy.pptx
PPT
FIXATION AND FIXATIVES IN HISTOPATHOLOGY
PDF
Laboratory Method Verification, March 2017
PPTX
Internal quality control
PPT
Qualitycontrolinclinicallaboratory
PPTX
Internal Quality Control Lecture MD General 2014 Course, Clin Path Ain Shams ...
PPT
Quality control lecture CPath master 2014 Ain Shams
Quality assurance in a medical laboratory
qc histo ss final - Copy.pptx
FIXATION AND FIXATIVES IN HISTOPATHOLOGY
Laboratory Method Verification, March 2017
Internal quality control
Qualitycontrolinclinicallaboratory
Internal Quality Control Lecture MD General 2014 Course, Clin Path Ain Shams ...
Quality control lecture CPath master 2014 Ain Shams

What's hot (20)

PPTX
Quality control in clinical laboratory
PPTX
Introduction to Histopathology and Lab organization.pptx
PPTX
(IQC) - Internal Quality Control.pptx
PDF
Basics of Immunohistochemistry (IHC)
PPT
Quality management
PPTX
Automation
PDF
10 - Mounting Media.pdf
PDF
quality control in clinical laboratory
PPT
Fixatives
PPTX
Validation of lab instruments and quantitative test methods
PPTX
Lec. 1 Tissue Fixation.pptx
PPTX
Histopathological techniques -sectioning, STAINING, EMBEDDING, fixaton, micro...
PDF
causes of laboratory errors
PPTX
Quality control in microbiology
PPTX
DIAGNOSTIC VALUE of MEDICAL MICROBIOLOGY
PPTX
Fixatives
PPTX
Quality Assurance in Clinical Microbiology
PPTX
Tissue fixation and grossing
PDF
Laboratory accreditation
PPT
Laboratory Quality Control .ppt
Quality control in clinical laboratory
Introduction to Histopathology and Lab organization.pptx
(IQC) - Internal Quality Control.pptx
Basics of Immunohistochemistry (IHC)
Quality management
Automation
10 - Mounting Media.pdf
quality control in clinical laboratory
Fixatives
Validation of lab instruments and quantitative test methods
Lec. 1 Tissue Fixation.pptx
Histopathological techniques -sectioning, STAINING, EMBEDDING, fixaton, micro...
causes of laboratory errors
Quality control in microbiology
DIAGNOSTIC VALUE of MEDICAL MICROBIOLOGY
Fixatives
Quality Assurance in Clinical Microbiology
Tissue fixation and grossing
Laboratory accreditation
Laboratory Quality Control .ppt
Ad

Similar to chem II 2019.ppt (20)

PPTX
QUALITY CHECK IN A BIOCHEMISTRY LAB SYSTEM
PPTX
Principles of Laboratory Medicine.pptx imp
PPTX
Perez.pptx
PPTX
Overview of Quality Control and its implementation in the laboratory.pptx
PDF
DMLT (2nd Year) : Quality Control, Standardization and Harmonization in Clini...
PDF
qualitycontrolinbiochemistry-190731013722.pdf
PPTX
Quality Control
PPTX
01 Introduction to Clinical Biochemistry II 03-07.pptx
PPTX
Quality assurance in the department of clinical biochemistry
PDF
Total Quality Management (TQM) by Dr Anurag Yadav
PDF
What do clinicians need to know about lab tests?
PPTX
Quality Control in a Medical Testing Laboratory
PPTX
1. Introduction To Quality Assurance.pptx
PPT
Quality control chemical
PPT
Laboratory Quality Control Randox.ppt
PPTX
Quality Control In Clinical Laboratory
PPTX
Assuring of Test Results based on Statistical tools.pptx
PDF
Internal quality control in clinical laboratories hematology(2)
PPTX
Quality control.pptx
PPTX
Quality control
QUALITY CHECK IN A BIOCHEMISTRY LAB SYSTEM
Principles of Laboratory Medicine.pptx imp
Perez.pptx
Overview of Quality Control and its implementation in the laboratory.pptx
DMLT (2nd Year) : Quality Control, Standardization and Harmonization in Clini...
qualitycontrolinbiochemistry-190731013722.pdf
Quality Control
01 Introduction to Clinical Biochemistry II 03-07.pptx
Quality assurance in the department of clinical biochemistry
Total Quality Management (TQM) by Dr Anurag Yadav
What do clinicians need to know about lab tests?
Quality Control in a Medical Testing Laboratory
1. Introduction To Quality Assurance.pptx
Quality control chemical
Laboratory Quality Control Randox.ppt
Quality Control In Clinical Laboratory
Assuring of Test Results based on Statistical tools.pptx
Internal quality control in clinical laboratories hematology(2)
Quality control.pptx
Quality control
Ad

Recently uploaded (20)

PDF
bbec55_b34400a7914c42429908233dbd381773.pdf
DOCX
Q1_LE_Mathematics 8_Lesson 5_Week 5.docx
PDF
IFIT3 RNA-binding activity primores influenza A viruz infection and translati...
PDF
diccionario toefl examen de ingles para principiante
PPTX
The KM-GBF monitoring framework – status & key messages.pptx
PPTX
microscope-Lecturecjchchchchcuvuvhc.pptx
PPTX
2. Earth - The Living Planet Module 2ELS
PDF
Unveiling a 36 billion solar mass black hole at the centre of the Cosmic Hors...
PPTX
Microbiology with diagram medical studies .pptx
PPTX
neck nodes and dissection types and lymph nodes levels
PPTX
ANEMIA WITH LEUKOPENIA MDS 07_25.pptx htggtftgt fredrctvg
PDF
HPLC-PPT.docx high performance liquid chromatography
PPTX
Classification Systems_TAXONOMY_SCIENCE8.pptx
PDF
VARICELLA VACCINATION: A POTENTIAL STRATEGY FOR PREVENTING MULTIPLE SCLEROSIS
PPT
protein biochemistry.ppt for university classes
PDF
Sciences of Europe No 170 (2025)
PDF
An interstellar mission to test astrophysical black holes
PPTX
Cell Membrane: Structure, Composition & Functions
PPTX
TOTAL hIP ARTHROPLASTY Presentation.pptx
PPTX
DRUG THERAPY FOR SHOCK gjjjgfhhhhh.pptx.
bbec55_b34400a7914c42429908233dbd381773.pdf
Q1_LE_Mathematics 8_Lesson 5_Week 5.docx
IFIT3 RNA-binding activity primores influenza A viruz infection and translati...
diccionario toefl examen de ingles para principiante
The KM-GBF monitoring framework – status & key messages.pptx
microscope-Lecturecjchchchchcuvuvhc.pptx
2. Earth - The Living Planet Module 2ELS
Unveiling a 36 billion solar mass black hole at the centre of the Cosmic Hors...
Microbiology with diagram medical studies .pptx
neck nodes and dissection types and lymph nodes levels
ANEMIA WITH LEUKOPENIA MDS 07_25.pptx htggtftgt fredrctvg
HPLC-PPT.docx high performance liquid chromatography
Classification Systems_TAXONOMY_SCIENCE8.pptx
VARICELLA VACCINATION: A POTENTIAL STRATEGY FOR PREVENTING MULTIPLE SCLEROSIS
protein biochemistry.ppt for university classes
Sciences of Europe No 170 (2025)
An interstellar mission to test astrophysical black holes
Cell Membrane: Structure, Composition & Functions
TOTAL hIP ARTHROPLASTY Presentation.pptx
DRUG THERAPY FOR SHOCK gjjjgfhhhhh.pptx.

chem II 2019.ppt

  • 2. QA  Quality Assurance - is defined as the overall program that ensures that the final results reported by the laboratory are correct.  describes the steps taken in and outside the lab to achieve reliable results right from the preparation of the patient and ending with the correct interpretation of the results  Systematic Application of optimum procedures to ensure valid, reproducible, and accurate results.
  • 3. QC  Quality Control - QC refers to the measures that must be included during each assay run to verify that the test is working properly.  This involves the technique and precautions taken by laboratory personnel to ensure that tests are performed correctly.  Lab QC = Running controls and statistically analyzing the data before releasing patient results  “The aim of quality control is simply to ensure that the results generated by the test are correct. However, quality assurance is concerned with much more: that the right test is carried out on the right specimen, and that the right result and right interpretation is delivered to the right person at the right time”
  • 4. Quality assessment  Quality Assessment - quality assessment (also known as proficiency testing) is a mean to determine the quality of the results generated by the laboratory. Quality assessment is a challenge to the effectiveness of the QA and QC programs.  Quality Assessment and Quality Control measures must include a means to identify, classify, and limit error.  Quality Assessment may be external or internal, examples of external programs include NEQAS, HKMTA, and Q- probes. UVRI,EAQAS
  • 5. Standards • Highly purified substance, whose exact composition is known. • Non- biological in nature • Uses  Run with pt. sample to validate the run • Ex. With each run of a Urine Osmolality a Std. is often run to determine the accuracy and precision of the run  Generate Calibration Curve  Different concentrations of the Std. are used to plot a graphic curve  Patient samples are compared to the calibration curve and the concentration of the analyte is quantified.
  • 6. Reference Solutions • Biological in nature • Have an ‘assigned’ value • Used exactly like a standard
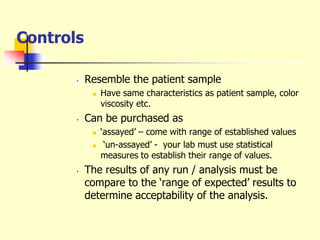
  • 7. Controls • Resemble the patient sample  Have same characteristics as patient sample, color viscosity etc. • Can be purchased as  ‘assayed’ – come with range of established values  ‘un-assayed’ - your lab must use statistical measures to establish their range of values. • The results of any run / analysis must be compare to the ‘range of expected’ results to determine acceptability of the analysis.
  • 8. Controls, cont’d. • Depending on the test 1 or more levels of control will be required. • Control within expected range = IN CONTROL= accept the QC and report patient results • Control outside of expected range= OUT of CONTROL=address
  • 9. Comparing Results to the Appropriate Range • Control results - compared to their own range of expected results determined by the control manufacturer or individual laboratory • Patient values – compared to published reference values or patient population reference ranges established within the laboratory.
  • 10.  Accuracy; the extent to which measurements agree with the true value of the quantity being measured  This can be aided by the use of properly standardized procedures, statistically valid comparisons of new methods with established refraince methods, the use of controls and participate in proficiency testing programmes.  Precision; the degree of the reproducibility of the test results. It can be ensured by the proper inclusion of standards reference samples or control solutions.  Reliability; this is when the method used maintains a steady state of accuracy and precision over a considerable period of time.
  • 11. Precision and Accuracy Low Accuracy, High Precision High Accuracy, Low Precision High Accuracy, High Precision
  • 12. Sensitivity and specificity  Sensitivity; This is the minimum amount of a substance in a biological medium that can be determined with the accuracy and precision and specific by a particular method  The clinical sensitivity of an assay is the fraction of those subjects with a specific disease that the assay correctly predicts.  Specificity; this the exclusive measurements of a compound for which the method has been design  The clinical specificity is the fraction of those individuals without the disease that the assay correctly predicts.
  • 13. Elements of QA  Technical competence; the service provider must have the right knowledge, skills and attitude to perform laboratory test.  Effectiveness; the lab personnel shd follow the norms and guidelines for the procedures  Continuity; it means providing a range of services within the means of the lab  Efficiency an efficient services provider shd produce the test results within available resources
  • 14. Continues…..  Validation checks whether the test procedure or any equipment satisfy the set standard  Safety; shd prevent hazards in the laboratory, the service provider, pts, other health workers or any other persons who enters and use lab  Facility; the lab shd be of a suitable size construction and location to meet the requirements of the range of tests offered.
  • 15. QA phases.  Pre-analytical phase of quality assurance ensures quality in everything before testing process both within the lab and outside the lab  Proper selection and evaluation of the testing procedures  Correct ordering of the tests  Proper preparation of the patient for the test.e.g fasting sugar, OGTT
  • 16. Continues…  Proper identification of the patient  Proper collection of the samples i.e in a correct containers and under condition specified by the test procedure.  Timely transportation of the samples to the lab,  Proper handling of the sample from time of transportation to the time of analysis  Proper handling of the sample in the lab, includes proper documentation of the sample, identification within the lab correct centrifugation technique
  • 17. Analytical phase  Proper labeling and use of reagnts must labeled with conc, date of preparation, expiry date, initials of the person who prepared.  Periodic calibration of pipetting devices and careful maintenance of instruments  Using control samples to check for bias  Training lab workers  Establishing performance std for each test
  • 18. 18 Examination/analytical Laboratory Analysis Examination Phase Examples: established algorithm followed correct timing of test reported results when control results pass or within the range proper dilution and pipetting of sample or reagents  appropriate storage of reagent
  • 19. Post analytical phase  This is the process of verifying quality once the sample has been analyzed  Verification of the calculations of final report  Review of test results for possible errors  Writing reports that are easy to read and interpret  Procedures for informing the clinicians about the tests that requires immediate attention  Verification of correct interpretation of lab test by the lab personals and physicians.
  • 20. Variables that affect the quality of results  The educational background and training of the laboratory personnel (incompetency)  The condition of the specimens  The controls used in the test runs  Reagents  Equipment  The interpretation of the results  The transcription of results  The reporting of results
  • 21. Errors in clinical laboratory  True value - this is an ideal concept which cannot be achieved.  Accepted true value - the value approximating the true value, the difference between the two values is negligible.  Error - the discrepancy between the result of a measurement and the true (or accepted true value).
  • 22. Sources of error  Input data required - such as standards used, calibration values, and values of physical constants.  Inherent characteristics of the quantity being measured - e.g. CFT and HAI titre.  Instruments used - accuracy, repeatability.  Observer fallibility - reading errors, blunders, equipment selection, analysis and computation errors.  Environment - any external influences affecting the measurement.  Theory assumed - validity of mathematical methods and approximations.
  • 23. Error • Error is the discrepancy between the result obtained in the testing process and its ‘True Value’ / ‘Accepted True Value’ • Pre-Analytical Errors=40% • Analytical Errors=20% • Post-Analytical Errors=20%
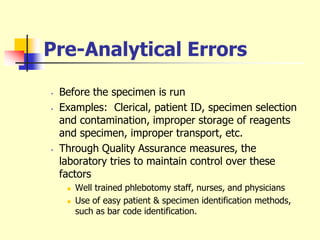
  • 24. Pre-Analytical Errors • Before the specimen is run • Examples: Clerical, patient ID, specimen selection and contamination, improper storage of reagents and specimen, improper transport, etc. • Through Quality Assurance measures, the laboratory tries to maintain control over these factors  Well trained phlebotomy staff, nurses, and physicians  Use of easy patient & specimen identification methods, such as bar code identification.
  • 25. Analytical error • Testing errors • Random or indeterminate  Hard or impossible to trace  Examples: Electricity surge, One-time events, etc • Systematic or determinant  Identifiable cause  Examples: Specimen carryover, contaminated reagents, instrument component malfunction, dirty electrodes, etc. • Through Quality Control measures, such as always running controls, the laboratory limits these errors.
  • 26. Post-Analytical Errors • After testing • Examples: Clerical, result reported on wrong patient, instrument to host computer errors, etc.  transcription error in reporting  report illegible  report sent to the wrong location  report not sent  QA measures such as comprehensive and easily read Report sheets for manual tests must be implemented when problems are identified.
  • 27. Random Error  An error which varies in an unpredictable manner, in magnitude and sign, when a large number of measurements of the same quantity are made under effectively identical conditions.  Random errors create a characteristic spread of results for any test method and cannot be accounted for by applying corrections. Random errors are difficult to eliminate but repetition reduces the influences of random errors.  Examples of random errors include errors in pipetting and changes in incubation period. Random errors can be minimized by training, supervision and adherence to standard operating procedures.
  • 28. Continues…..  This is where results differ from the correct results by varying amounts. The common causes includes;  Incorrect and variable pipetting  Inadequate mixing of the sample with the reagents  Incubation at inconsistence temp or of in correct length of time  Dirty test tubes, pipettes or other glass wares used in the test  Fluctuating colorimeter reading due to unreliable main voltage supply  Incomplete removal interfering substances in serum e.g RBCs or proteins  Use of dirty or finger marked cuvettes or reading samples containing air bubbles.
  • 29. Random Errors x x x x x True x x x x Value x x x x x x x x x
  • 30. Systematic Error  An error which, in the course of a number of measurements of the same value of a given quantity, remains constant when measurements are made under the same conditions, or varies according to a definite law when conditions change.  Systematic errors create a characteristic bias in the test results and can be accounted for by applying a correction.  Systematic errors may be induced by factors such as variations in incubation temperature, blockage of plate washer, change in the reagent batch or modifications in testing method.
  • 31. Systematic Errors x x x x x x x x True x Value
  • 32. Qualitative QC vs. Quantitative QC • Quantitative tests • Measured quantity/concentration of analyte in the control • Data must be graphed and evaluated by numerical statistics  Examples: WBC count, Glucose, quantitative HCG • Qualitative tests and Semi-Quantitative • Qualitative=Pos/Neg or Present/Absent • Semi-Quantitative=Small, Medium, Large • Generally not statistically analyzed  Examples: Clinitest, Acetest, qualitative HCG
  • 33. QC Data Analysis: Measures of Central tendency • Measures of Central tendency ( how numerical values can be expressed as a central value ) • Mean - Average value • Median - Middle observation • Mode - Most frequent observation
  • 34. QC Data Analysis: Variance and Standard Deviation • An important tool in the statistical analysis is determining: • Variance = • Standard Deviation (SD) - a measure of the scatter around the arithmetic average (mean) in a Gaussian distribution. • SD= • or Square Root of variance
  • 35. How to Manually Calculate Variance and Standard Deviation: 1. Subtract the mean from each score. 2. Square each Result 3. Sum all of the squares 4. Divide the sum of the squares by the number of data points (N) 5. The result is the VARIANCE 6. Take the square root of the variance. 7. The result is the SD.
  • 36. Quality Control • 95% confidence limit (± 2 SD) - 95% of all the results in a Gaussian distribution
  • 37. How many points fall within 1SD? • Another way of reviewing data • Dispersal / or how the individual data points are distributed about the central value
  • 38. Levey-Jennings QC Graph (no points)
  • 39. Levey-Jennings QC Chart for 1 month
  • 40. Statistical concepts  Shift – when there are 6 consecutive data results on the same side of the mean
  • 41. Statistical concepts  Trend – when there is a consistent increase OR decrease in the data points over a period of 6 days. (A line connecting the dots will cross the mean.)
  • 42. Shewhart Control Charts A Shewhart Control Chart depend on the use of IQC specimens and is developed in the following manner:-  Put up the IQC specimen for at least 20 or more assay runs and record down the O.D./cut-off value or antibody titre (whichever is applicable).  Calculate the mean and standard deviations (s.d.)  Make a plot with the assay run on the x-axis, and O.D./cut-off or antibody titre on the y axis.  Draw the following lines across the y-axis: mean, -3, -2, -2, 1, 2, and 3 s.d.  Plot the O.D./cut-off obtained for the IQC specimen for subsequent assay runs  Major events such as changes in the batch no. of the kit and instruments used should be recorded on the chart.
  • 43. Westgard rules  The formulation of Westgard rules were based on statistical methods. Westgard rules are commonly used to analyse data in Shewhart control charts.  Westgard rules are used to define specific performance limits for a particular assay and can be use to detect both random and systematic errors.  There are six commonly used Westgard rules of which three are warning rules and the other three mandatory rules.  The violation of warning rules should trigger a review of test procedures, reagent performance and equipment calibration.  The violation of mandatory rules should result in the rejection of the results obtained with patients’ serum samples in that assay.
  • 44. 0 10 20 30 40 50 60 70 80 90 100 1 2 3 4 5 6 7 8 9 10 11 12 13 14 15 16 Shewhart Chart +3 sd -3 sd +2 sd -2 sd -1 sd +1 sd VZV IgG ELISA: Target Value = 49 U/ml Antibody Units Target value Assay Run
  • 45. 13s Westgard Rule  13s  A single control measurement exceeds three standard deviations from the target mean  : It is violated when the IQC value exceeds the mean by 3SD. The assay run is regarded as out of control  Action - Reject
  • 46. 12s Westgard Rule  12s  It is violated if the IQC value exceeds the mean by 2SD. It is an event likely to occur normally in less than 5% of cases  Action – must consider other rule violations (trend, shift, etc)  This is a warning
  • 47. 22s Westgard Rule  22s  It detects systematic errors and is violated when two consecutive IQC values exceed the mean on the same side of the mean by 2SD.  Action – Reject
  • 48. R4s Westgard Rule  R4s  One control measurement in a group exceeds the mean plus 2S and another exceeds the mean minus 2S.  Action – Reject
  • 49. 41s Westgard Rule  41s  It is violated if four consecutive IQC values exceed the same limit (mean  1SD) and this may indicate the need to perform instrument maintenance or reagent calibration  Action – Reject
  • 50. Continues.  Mandatory 10x  This rule is violated when the last 10 consecutive IQC values are on the same side of the mean or target value.
  • 51. 0 10 20 30 40 50 60 70 80 90 100 1 2 3 4 5 6 7 8 9 10 11 12 13 14 15 16 Westgard Rules: 10X +3 sd -3 sd +2 sd -2 sd -1 sd +1 sd VZV IgG ELISA: Target Value = 49 U/ml Antibody Units Target value Assay Run
  • 52. If QC FAILS? One Possible Plan of Action: (your lab may advise another) 1. Look at vial of control. If using the last drops—reconstitute or open new vial. 2. If plenty of QC left in vial, mix well, repour, rerun. Most issues resolve by now. However… 3. If the QC fails again, check the volumes and expiration dates of the reagents. Change out if necessary. 4. Calibrate the instrument, run cleaning sequence, or perform maintenance as needed. 5. Rerun control. 6. If controls fail repeatedly after multiple efforts, call technical support. Use discretion keeping in mind that controls, calibrators, and reagents are expensive.
  • 53. Other QC Checks • Delta checks • Compares a current test result on a patient to last run patient test, flagging results outside expected physiological variation. • Many False positives, but DO NOT ignore-- investigate • MCHC=Hgb / Hct * 100 (expect 32-36) • Rule of 3=Hemoglobin x3 = hematocrit • Compare patient BUN / creatinine (10/1 – 20/1)
  • 54. Internal Quality Control Program for Serological Testing An internal quality control program depend on the use of internal quality control (IQC) specimens, Shewhart Control Charts, and the use of statistical methods for interpretation. Internal Quality Control Specimens IQC specimens comprises either (1) in-house patient sera (single or pooled clinical samples), or (2) international serum standards with values within each clinically significant ranges.
  • 55. Follow-up action in the event of a violation There are three options as to the action to be taken in the event of a violation of a Westgard rule:  Accept the test run in its entirety - this usually applies when only a warning rule is violated.  Reject the whole test run - this applies only when a mandatory rule is violated.  Enlarge the greyzone and thus re-test range for that particular assay run - this option can be considered in the event of a violation of either a warning or mandatory rule.

Editor's Notes

  • #19: Analytical errors rates has decreased significantly as a result of standardization, automation and technological advancement thus improving the analytical reliability of Laboratory tests. Possible causes of analytical errors includes: incorrect measuring of the sample or reagents; usually these are dilution or pipetting errors; using reagents that have been improperly stored, or after their expiration date.