SlideShare a Scribd company logo
How to use Quantitative Analytics to
Identify and Effectively Manage Risk
Why Use Data to Manage Risk
• SEC page on Distribution in Guise
• FINRA guidance aimed at Broker Dealers
• Your Oversight Program should do more than just accept
FICCA’s / Questionnaires
Use the data available to you to rate your distributors efficiency
in their controls.
Research Findings
• An oversight program can take flight on existing relationships and smartly
align itself on newly on-boarded counterparties using quantitative
weighting of demographic attributes to estimate a risk tier or profile for a
firm that has not worked through a periodic evaluation
• The annual or semi-annual review should leverage quantitative analytics
of measured KPIs tied to specific control objectives to observe and
quantify capability of control in a normalized fashion
• Once established this approach will provide the platform from which
predictive analytics will provide intelligence and efficiency in the execution
of the oversight program
Analytical Approach
Findings show two applicable types of quantitative analysis are
in use and can be leveraged to provide insight to your
counterparty
• The first will help estimate the risk that a given counterparty will likely
provide and set broadly the amount of time spent in the first year on that
entity
• The second will help an oversight program measure the effectiveness of
the counterparty’s control objectives and therefore further qualify their
risk in their profile risk ranking
Quantitative Methods Employed
Two Primary Quantitative Methods Employed
• Profile Risk Ranking
– Various key metrics and demographic elements weighted to estimate a
distribution partner’s risk
• Individual Control Objective Analytics
– Individual KPIs driven from actual operational interaction with the
intermediary
Discussion Approach
Most standard Oversight Programs consist of core requirements
that can be found in five pillars:
1. Counterparty Deal Management
2. Product Setup/Maintenance
3. Transparency Data Management
4. Compliance
5. Fee / Services Management
Counterparty Deal Management
 Management of counterparty relationships in one single portal
 Join and summarize data from all of your operational silos with
demographic and contract level data provided by your
counterparties
 Information captured here will all role up to the counterparty risk
ranking
Counterparty Deal Management
Relevant Control Objectives
• Third Party Oversight
• Document Retention & Recordkeeping
• Shareholder Communications
• Business Continuity / DR
Potential Quantitative Elements
• AUM
• # of Accounts
• Age of Relationship
• Age of Last Legal Review
• % growth of relationship over period
• % growth of counterparty over period
Product Setup / Maintenance
 Fund parameter comparison rules (Load, 12b1, Fee, etc…)
 Compare TA, Sub-TA and MFPII Data
 Identify, resolve or retain discrepancies with comments
Product Setup / Maintenance
Relevant Control Objectives
• Security Master Setup & Maintenance
• Transaction Processing
Potential Quantitative Elements
• Parameter Comparison Annotations
Transparency Data Management
 Centralized and Secure infrastructure for storing Transparency Data
 Ability to perform advanced analytics:
 Inflow and Outflow Analysis
 Market Timing Monitoring
 Prospectus Compliance Analysis
 Blue Sky Analysis
 Sales By Social Code
 Initial vs. Subsequent
Transparency Data Management
Relevant Control Objectives
• Transaction Processing
• Blue Sky Reporting
• Cash & Share Reconciliation
• Lost & Missing Shareholders
Potential Quantitative Elements
• Blue Sky Sales by State
• Reconciliation of Account Balances
• Account Monitoring
• Inflows / Outflows
• Measure # of Trade Breaks
• # of Trade Violations associated with
rule setup
Compliance
 Demographic and policy level metrics that show your counterparty
has the controls and processes in place to meet standards defined
by the ICI.
 Fund Companies should review these controls and policies on a
scheduled basis by conducting reviews that satisfy the board’s
request.
Compliance
Relevant Control Objectives
• Risk Government
• Code of Ethics
• Information Security Program
• Anti-Money Laundering and the
Prevention of Terrorist Financing
Potential Quantitative Elements
• Flags / Indicator showing certain
policies exist:
– AML
– KYC
• Scores / ratings from previous annual
reviews
Fee and Service Management
 Analyze the rates you are paying distributors vs. the actual
services they are offering
 Calculation and validation of invoicing
 Settlement of Fee Invoicing
 Leveraging transparency data for invoice reconciliation
 Use fees from your TA services to baseline what you should pay
the Sub-TA platforms
Fee and Services Management
Relevant Control Objectives
• Sub account Billing & Invoice
Processing
• Fee Calculations
Potential Quantitative Elements
• Invoiced vs. Calculated Fee Discrepancies
• Comparison of rates across distribution
partners
• Validation of Fee Amounts
– Position Based
– Asset Based
• Payment Funding Allocations
• Tolerance Checks
– Change in accounts month over month
– % fee variance vs. change in AUM
Profile Risk Ranking
Quantitative metrics from all pillars
+
Qualitative demographic attributes weighted by
importance
Example Application
Profile Attribute Values Weighting Firm 1 Score Firm 2 Score
Previous Review Score 1-100 30% 50 15 82 23
Sifi Designation Y/N 3% N 3 Y 3
Sub Accounts Y/N 15% Y 15 Y 15
AUM Tier 0-15% $4B 15 $4B 15
Trading Volume Tier 0-5% 220/Day 5 230/Day 5
International Accts Y/N 5% N 0 Y 5
Provides FICCA Y/N 12% Y 0 N 12
Servicing Firm Y/N 8% N 0 Y 8
Contract Issues Y/N 10% Y 0 N 10
53 = Tier 2 96 = Tier 4
Individual Control Objective Analytics
• Association of specific control objectives in the oversight
framework with KPIs from the operational tools that support
the process
• Normalization using key metrics like AUM, number of
accounts or number of RIAs is key for use in the overall
program analytics
Examples
Fees Paid vs. Finances Independent Calculation
• A competent Fee Management process should produce a KPI that
illustrates the difference between the amount invoiced and the amount
the fund company believes should have been paid
• This variance is a KPI that can be applied to the invoicing control objective
in the FICCA framework to provide an “as observed” quantitative
assessment of the performance of the counterparty’s controls
22c2 Market Timing Events Observed
• A key KPI that is a result of the 22c2 process is the number of accounts
where market timing was identified. This metric can be tied to the control
objectives for trade monitoring and market timing
Normalization
The raw KPI results from the underlying oversight processes
should be normalized for using quantitative demographic
counterparty metrics. This ensures quantitative findings are kept
in perspective.
• In our first example, the total amount of fees paid should be used to
normalize the variance of the paid/calculated percentage
• Similarly, in example two, the KPI of number of accounts where market
timing was observed in a specific time period should be normalized by
dividing by the total number of sub accounts registered for the time
period on the sub account platform
Predictive Analytics – the Next Step
• Once your mature quantitative program has taken root,
Predictive Analytics should be leveraged to illustrate where
actual risk is found
• Observed measurement tied to the quantitative oversight
process will provide the quality data needed for Predictive
Intelligence
Contributing Research
• Direct insight from our panelists’ experience with mature,
large scale oversight programs
• Observations from several major oversight programs that are
not Delta Data clients or panelists’ funds

More Related Content

PPT
SLF SESSION | Liquidity Risk Management and the SEC’s Proposed Rules Impact a...
PPTX
Dynamic Changes Occurring: OMB's Uniform Grant Guidance
PDF
Global x Assessor
PPTX
Project Samples | Analytics
PDF
SAP HANA for Capital Markets Risk Management
PDF
FRTB Outlook - Chappuis Halder & Co
PPTX
BCBS 261 - Collateral and Margin Management for Uncleared Derivatives
PDF
SAP insider GDPR compendium Hernan Huwyler
SLF SESSION | Liquidity Risk Management and the SEC’s Proposed Rules Impact a...
Dynamic Changes Occurring: OMB's Uniform Grant Guidance
Global x Assessor
Project Samples | Analytics
SAP HANA for Capital Markets Risk Management
FRTB Outlook - Chappuis Halder & Co
BCBS 261 - Collateral and Margin Management for Uncleared Derivatives
SAP insider GDPR compendium Hernan Huwyler

Viewers also liked (20)

PPTX
Zapatillas
PDF
Filtros ilovepdf-compressed
PPTX
Historia del computador
PPT
Busqueda safari
PDF
enerWE Communication Conference 2016 - Strategisk kommunikasjon for et bedre ...
PPTX
Historia del computador
PDF
Activiti goes enterprise: Die Evolution der BPM Suite aus Sicht des Alfresco ...
PPTX
Markedsføring 1, Difffusjons- og adopsjonsprosessen
PDF
Kari traa - troll fighters
PPTX
Pokayoke
PPTX
SLF SESSION | New Drivers of the Retirement Market
PPTX
SLF SESSION | Preparing for 2020 the Outlook for Fund Service Providers
PPTX
SLF SESSION | The Impact of the DOL Fiduciary Rule
PPTX
SLF SESSION | Proxy Advisory Firms – Understanding the Impact
PDF
Seis sigma kaizen
PPTX
Louis S. Harvey, President & CEO, Dalbar, Inc.
PPTX
Economic Implications: Market Forecasts
PPTX
SLF SESSION | Next Generation Sales Enablement
PPTX
παρτυ 2
PPTX
μαντινάδες 1
Zapatillas
Filtros ilovepdf-compressed
Historia del computador
Busqueda safari
enerWE Communication Conference 2016 - Strategisk kommunikasjon for et bedre ...
Historia del computador
Activiti goes enterprise: Die Evolution der BPM Suite aus Sicht des Alfresco ...
Markedsføring 1, Difffusjons- og adopsjonsprosessen
Kari traa - troll fighters
Pokayoke
SLF SESSION | New Drivers of the Retirement Market
SLF SESSION | Preparing for 2020 the Outlook for Fund Service Providers
SLF SESSION | The Impact of the DOL Fiduciary Rule
SLF SESSION | Proxy Advisory Firms – Understanding the Impact
Seis sigma kaizen
Louis S. Harvey, President & CEO, Dalbar, Inc.
Economic Implications: Market Forecasts
SLF SESSION | Next Generation Sales Enablement
παρτυ 2
μαντινάδες 1
Ad

Similar to SLF SESSION | How to Identify Risk in Your Distribution Channel Using Quantitative Analytics (20)

PPTX
CRISIL ACAMS Las Vegas 2016 Alan Paris
PPTX
Fraud Detection Presentation Forum
PDF
Data analytics in finance broucher
PDF
WU Compliance Conference 2015 - Denver - Andrew Simpson - FINAL.PDF
PDF
CaseWare Monitor - New in 5.4 Release
PDF
Fraud detection Presentation
PDF
Fraud Detection presentation
PDF
IBM Banking: Automated Systems help meet new Compliance Requirements
PPTX
Data driven approach to KYC
PPTX
Fraud Analytics - Discussion
PDF
Finance Bi Nividh
PDF
Finance NI Nividh
PDF
Using Advanced Data Analytics and Technology to Combat Financial Crime
PDF
Webinar: Strategies to Enhance your Screening and Transaction Monitoring Proc...
PPTX
FRaCT Webinar Deck
PDF
Risk Offering Summary
PDF
Big Risks Requires Big Data Thinking
PPTX
Capital Cube- Contextual Treasury fueled by Composable NextGen Tech
PDF
Forex Services - Valufin
PDF
Finance Benchmarks Prophecy or Pretense Webinar Recap - Auxis Webinar
CRISIL ACAMS Las Vegas 2016 Alan Paris
Fraud Detection Presentation Forum
Data analytics in finance broucher
WU Compliance Conference 2015 - Denver - Andrew Simpson - FINAL.PDF
CaseWare Monitor - New in 5.4 Release
Fraud detection Presentation
Fraud Detection presentation
IBM Banking: Automated Systems help meet new Compliance Requirements
Data driven approach to KYC
Fraud Analytics - Discussion
Finance Bi Nividh
Finance NI Nividh
Using Advanced Data Analytics and Technology to Combat Financial Crime
Webinar: Strategies to Enhance your Screening and Transaction Monitoring Proc...
FRaCT Webinar Deck
Risk Offering Summary
Big Risks Requires Big Data Thinking
Capital Cube- Contextual Treasury fueled by Composable NextGen Tech
Forex Services - Valufin
Finance Benchmarks Prophecy or Pretense Webinar Recap - Auxis Webinar
Ad

More from NICSA (20)

PPTX
Understanding ROI: The Real Impact of Data Quality
PPTX
The Reality Behind Buzzwords Series: Blockchain
PPTX
Industry Leaders Outlook: Product & Marketing Roundtable
PPTX
Understanding Regulation Best Interest
PPTX
Trends in the Advisor Market
PPTX
New Challenges on the TA Compliance Landscape
PPTX
Navigating Turbulent Changes to the Sanctions Landscape
PPTX
Engaging and Empowering A Diverse Workforce
PPTX
Retirement 2020: Maximize Participation,Boost Efficiency & Accelerate Outcomes
PPTX
Building Deeper Advisory Relationships with Data
PPTX
FinReg Outlook: Clouds on the Horizon
PPTX
Preparing for the Next-Gen Client Base
PPTX
Tax & Reporting Update: Avoiding Fund Reporting Traps
PPTX
Next Generation Proxy Voting
PPTX
Best Practices in Building a Global Compliance Program
PPTX
AI Trends with Traction
PPTX
Rule 30e-3: Best Practices for Notice, Access & E-Delivery
PPTX
Rethinking Product Development
PPTX
The Bottom Line: Exploring the Benefits of Wellness in the Workplace
PPTX
Data Analytics 301: Converting Analysis into Business Strategy
Understanding ROI: The Real Impact of Data Quality
The Reality Behind Buzzwords Series: Blockchain
Industry Leaders Outlook: Product & Marketing Roundtable
Understanding Regulation Best Interest
Trends in the Advisor Market
New Challenges on the TA Compliance Landscape
Navigating Turbulent Changes to the Sanctions Landscape
Engaging and Empowering A Diverse Workforce
Retirement 2020: Maximize Participation,Boost Efficiency & Accelerate Outcomes
Building Deeper Advisory Relationships with Data
FinReg Outlook: Clouds on the Horizon
Preparing for the Next-Gen Client Base
Tax & Reporting Update: Avoiding Fund Reporting Traps
Next Generation Proxy Voting
Best Practices in Building a Global Compliance Program
AI Trends with Traction
Rule 30e-3: Best Practices for Notice, Access & E-Delivery
Rethinking Product Development
The Bottom Line: Exploring the Benefits of Wellness in the Workplace
Data Analytics 301: Converting Analysis into Business Strategy

Recently uploaded (20)

PPT
KPMG FA Benefits Report_FINAL_Jan 27_2010.ppt
PDF
USS pension Report and Accounts 2025.pdf
PDF
THE EFFECT OF FOREIGN AID ON ECONOMIC GROWTH IN ETHIOPIA
PDF
How to join illuminati agent in Uganda Kampala call 0782561496/0756664682
PDF
Financial discipline for educational purpose
PPTX
Introduction to Customs (June 2025) v1.pptx
PPTX
2. RBI.pptx202029291023i38039013i92292992
PPTX
Module5_Session1 (mlzrkfbbbbbbbbbbbz1).pptx
PPT
Fundamentals of Financial Management Chapter 3
PDF
3CMT J.AFABLE Flexible-Learning ENTREPRENEURIAL MANAGEMENT.pdf
PDF
The Right Social Media Strategy Can Transform Your Business
PDF
5a An Age-Based, Three-Dimensional Distribution Model Incorporating Sequence ...
PPT
Chap 1PP.ppt introductory micro economics
PDF
6a Transition Through Old Age in a Dynamic Retirement Distribution Model JFP ...
PPTX
Basic Concepts of Economics.pvhjkl;vbjkl;ptx
PDF
Fintech Regulatory Sandbox: Lessons Learned and Future Prospects
PDF
Pitch Deck.pdf .pdf all about finance in
PDF
HCWM AND HAI FOR BHCM STUDENTS(1).Pdf and ptts
DOCX
BUSINESS PERFORMANCE SITUATION AND PERFORMANCE EVALUATION OF FELIX HOTEL IN H...
PDF
Unkipdf.pdf of work in the economy we are
KPMG FA Benefits Report_FINAL_Jan 27_2010.ppt
USS pension Report and Accounts 2025.pdf
THE EFFECT OF FOREIGN AID ON ECONOMIC GROWTH IN ETHIOPIA
How to join illuminati agent in Uganda Kampala call 0782561496/0756664682
Financial discipline for educational purpose
Introduction to Customs (June 2025) v1.pptx
2. RBI.pptx202029291023i38039013i92292992
Module5_Session1 (mlzrkfbbbbbbbbbbbz1).pptx
Fundamentals of Financial Management Chapter 3
3CMT J.AFABLE Flexible-Learning ENTREPRENEURIAL MANAGEMENT.pdf
The Right Social Media Strategy Can Transform Your Business
5a An Age-Based, Three-Dimensional Distribution Model Incorporating Sequence ...
Chap 1PP.ppt introductory micro economics
6a Transition Through Old Age in a Dynamic Retirement Distribution Model JFP ...
Basic Concepts of Economics.pvhjkl;vbjkl;ptx
Fintech Regulatory Sandbox: Lessons Learned and Future Prospects
Pitch Deck.pdf .pdf all about finance in
HCWM AND HAI FOR BHCM STUDENTS(1).Pdf and ptts
BUSINESS PERFORMANCE SITUATION AND PERFORMANCE EVALUATION OF FELIX HOTEL IN H...
Unkipdf.pdf of work in the economy we are

SLF SESSION | How to Identify Risk in Your Distribution Channel Using Quantitative Analytics

  • 1. How to use Quantitative Analytics to Identify and Effectively Manage Risk
  • 2. Why Use Data to Manage Risk • SEC page on Distribution in Guise • FINRA guidance aimed at Broker Dealers • Your Oversight Program should do more than just accept FICCA’s / Questionnaires Use the data available to you to rate your distributors efficiency in their controls.
  • 3. Research Findings • An oversight program can take flight on existing relationships and smartly align itself on newly on-boarded counterparties using quantitative weighting of demographic attributes to estimate a risk tier or profile for a firm that has not worked through a periodic evaluation • The annual or semi-annual review should leverage quantitative analytics of measured KPIs tied to specific control objectives to observe and quantify capability of control in a normalized fashion • Once established this approach will provide the platform from which predictive analytics will provide intelligence and efficiency in the execution of the oversight program
  • 4. Analytical Approach Findings show two applicable types of quantitative analysis are in use and can be leveraged to provide insight to your counterparty • The first will help estimate the risk that a given counterparty will likely provide and set broadly the amount of time spent in the first year on that entity • The second will help an oversight program measure the effectiveness of the counterparty’s control objectives and therefore further qualify their risk in their profile risk ranking
  • 5. Quantitative Methods Employed Two Primary Quantitative Methods Employed • Profile Risk Ranking – Various key metrics and demographic elements weighted to estimate a distribution partner’s risk • Individual Control Objective Analytics – Individual KPIs driven from actual operational interaction with the intermediary
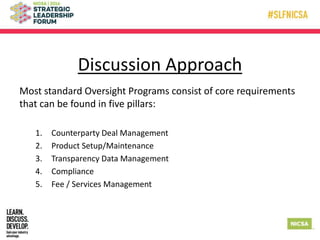
  • 6. Discussion Approach Most standard Oversight Programs consist of core requirements that can be found in five pillars: 1. Counterparty Deal Management 2. Product Setup/Maintenance 3. Transparency Data Management 4. Compliance 5. Fee / Services Management
  • 7. Counterparty Deal Management  Management of counterparty relationships in one single portal  Join and summarize data from all of your operational silos with demographic and contract level data provided by your counterparties  Information captured here will all role up to the counterparty risk ranking
  • 8. Counterparty Deal Management Relevant Control Objectives • Third Party Oversight • Document Retention & Recordkeeping • Shareholder Communications • Business Continuity / DR Potential Quantitative Elements • AUM • # of Accounts • Age of Relationship • Age of Last Legal Review • % growth of relationship over period • % growth of counterparty over period
  • 9. Product Setup / Maintenance  Fund parameter comparison rules (Load, 12b1, Fee, etc…)  Compare TA, Sub-TA and MFPII Data  Identify, resolve or retain discrepancies with comments
  • 10. Product Setup / Maintenance Relevant Control Objectives • Security Master Setup & Maintenance • Transaction Processing Potential Quantitative Elements • Parameter Comparison Annotations
  • 11. Transparency Data Management  Centralized and Secure infrastructure for storing Transparency Data  Ability to perform advanced analytics:  Inflow and Outflow Analysis  Market Timing Monitoring  Prospectus Compliance Analysis  Blue Sky Analysis  Sales By Social Code  Initial vs. Subsequent
  • 12. Transparency Data Management Relevant Control Objectives • Transaction Processing • Blue Sky Reporting • Cash & Share Reconciliation • Lost & Missing Shareholders Potential Quantitative Elements • Blue Sky Sales by State • Reconciliation of Account Balances • Account Monitoring • Inflows / Outflows • Measure # of Trade Breaks • # of Trade Violations associated with rule setup
  • 13. Compliance  Demographic and policy level metrics that show your counterparty has the controls and processes in place to meet standards defined by the ICI.  Fund Companies should review these controls and policies on a scheduled basis by conducting reviews that satisfy the board’s request.
  • 14. Compliance Relevant Control Objectives • Risk Government • Code of Ethics • Information Security Program • Anti-Money Laundering and the Prevention of Terrorist Financing Potential Quantitative Elements • Flags / Indicator showing certain policies exist: – AML – KYC • Scores / ratings from previous annual reviews
  • 15. Fee and Service Management  Analyze the rates you are paying distributors vs. the actual services they are offering  Calculation and validation of invoicing  Settlement of Fee Invoicing  Leveraging transparency data for invoice reconciliation  Use fees from your TA services to baseline what you should pay the Sub-TA platforms
  • 16. Fee and Services Management Relevant Control Objectives • Sub account Billing & Invoice Processing • Fee Calculations Potential Quantitative Elements • Invoiced vs. Calculated Fee Discrepancies • Comparison of rates across distribution partners • Validation of Fee Amounts – Position Based – Asset Based • Payment Funding Allocations • Tolerance Checks – Change in accounts month over month – % fee variance vs. change in AUM
  • 17. Profile Risk Ranking Quantitative metrics from all pillars + Qualitative demographic attributes weighted by importance
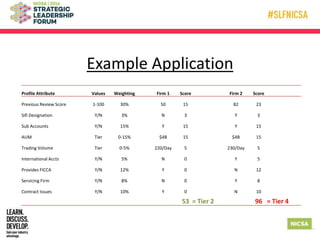
  • 18. Example Application Profile Attribute Values Weighting Firm 1 Score Firm 2 Score Previous Review Score 1-100 30% 50 15 82 23 Sifi Designation Y/N 3% N 3 Y 3 Sub Accounts Y/N 15% Y 15 Y 15 AUM Tier 0-15% $4B 15 $4B 15 Trading Volume Tier 0-5% 220/Day 5 230/Day 5 International Accts Y/N 5% N 0 Y 5 Provides FICCA Y/N 12% Y 0 N 12 Servicing Firm Y/N 8% N 0 Y 8 Contract Issues Y/N 10% Y 0 N 10 53 = Tier 2 96 = Tier 4
  • 19. Individual Control Objective Analytics • Association of specific control objectives in the oversight framework with KPIs from the operational tools that support the process • Normalization using key metrics like AUM, number of accounts or number of RIAs is key for use in the overall program analytics
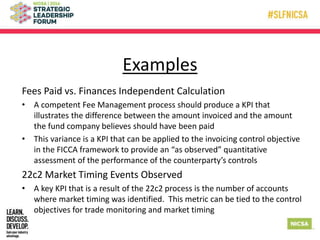
  • 20. Examples Fees Paid vs. Finances Independent Calculation • A competent Fee Management process should produce a KPI that illustrates the difference between the amount invoiced and the amount the fund company believes should have been paid • This variance is a KPI that can be applied to the invoicing control objective in the FICCA framework to provide an “as observed” quantitative assessment of the performance of the counterparty’s controls 22c2 Market Timing Events Observed • A key KPI that is a result of the 22c2 process is the number of accounts where market timing was identified. This metric can be tied to the control objectives for trade monitoring and market timing
  • 21. Normalization The raw KPI results from the underlying oversight processes should be normalized for using quantitative demographic counterparty metrics. This ensures quantitative findings are kept in perspective. • In our first example, the total amount of fees paid should be used to normalize the variance of the paid/calculated percentage • Similarly, in example two, the KPI of number of accounts where market timing was observed in a specific time period should be normalized by dividing by the total number of sub accounts registered for the time period on the sub account platform
  • 22. Predictive Analytics – the Next Step • Once your mature quantitative program has taken root, Predictive Analytics should be leveraged to illustrate where actual risk is found • Observed measurement tied to the quantitative oversight process will provide the quality data needed for Predictive Intelligence
  • 23. Contributing Research • Direct insight from our panelists’ experience with mature, large scale oversight programs • Observations from several major oversight programs that are not Delta Data clients or panelists’ funds