Monthly Business Evaluation PowerPoint Presentation Slides
0 likes452 views

The document appears to be a template for a monthly business evaluation presentation. It includes an agenda, sections on business overview, financial performance, client and project updates, competitor's analysis, future roadmap, and CSR/miscellaneous activities. There are placeholders for highlights, financial summaries, revenue splits by geography and product, key developments, P&L and balance sheet KPIs, cash flow statements, funding updates, top customers/vendors/debtors/creditors, client and project updates, and competitor analysis. The presentation is meant to assess current performance, focus on goals and accountability, and identify barriers.


Monthly Business Evaluation PowerPoint Presentation Slides
- 2. 2 Agenda 01 To assess the current performance status 02 To focus on critical issues, goals and objectives 03 To reinforce the accountability and action plans of each team or individual 04 To identify and remove barriers
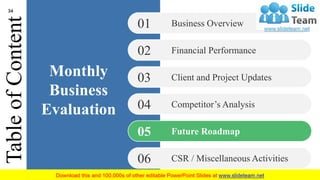
- 3. Monthly Business Evaluation TableofContent Business Overview01 Financial Performance02 Client and Project Updates03 Competitor’s Analysis04 Future Roadmap05 CSR / Miscellaneous Activities06 3
- 4. Monthly Business Evaluation TableofContent Business Overview01 Financial Performance02 Client and Project Updates03 Competitor’s Analysis04 Future Roadmap05 CSR / Miscellaneous Activities06 4
- 5. Highlights Q1 FY18 Highlight 1 This slide is 100% editable. Adapt it to your needs and capture your audience's attention. Q4 FY18 Highlight 4 This slide is 100% editable. Adapt it to your needs and capture your audience's attention. Q2 FY18 Highlight 2 This slide is 100% editable. Adapt it to your needs and capture your audience's attention. Q3 FY18 Highlight 3 This slide is 100% editable. Adapt it to your needs and capture your audience's attention. 5
- 6. Financial Summary $80 MM Ebitda This slide is 100% editable. Adapt it to your needs and capture your audience's attention. 50% Q-o-Q Revenue Growth This slide is 100% editable. Adapt it to your needs and capture your audience's attention. $20 MM Net Profit This slide is 100% editable. Adapt it to your needs and capture your audience's attention. 20% Net Profit Margin This slide is 100% editable. Adapt it to your needs and capture your audience's attention. $100 MM Net Revenue This slide is 100% editable. Adapt it to your needs and capture your audience's attention. 6
- 7. Revenue Split - By Geography 20% 20% 20% 20% 20% North America This slide is 100% editable. Adapt it to your needs and capture your audience's attention. South America This slide is 100% editable. Adapt it to your needs and capture your audience's attention. Africa This slide is 100% editable. Adapt it to your needs and capture your audience's attention. Australia This slide is 100% editable. Adapt it to your needs and capture your audience's attention. Asia This slide is 100% editable. Adapt it to your needs and capture your audience's attention. 7
- 8. Revenue Split - By Country 01 USA This slide is 100% editable. Adapt it to your needs and capture your audience's attention. 02 Brazil This slide is 100% editable. Adapt it to your needs and capture your audience's attention. 03 Africa This slide is 100% editable. Adapt it to your needs and capture your audience's attention. 04 Australia This slide is 100% editable. Adapt it to your needs and capture your audience's attention. 05 Russia This slide is 100% editable. Adapt it to your needs and capture your audience's attention. 8
- 9. Product Line Q1 FY18 Q2 FY18 Q3 FY18 Q4 FY18 Product 1 34 897 234 67 Product 2 65 64 234 245 Product 3 32 234 76 64 Product 4 56 64 23 23 Revenue Split - By Product/Segment9 All Figures in USD MM
- 10. Revenue Split - By Product/Segment 4.3 2.5 3.5 4.5 2.4 4.4 1.8 2.8 2 2 5.6 4 2.4 3.2 3 5.1 0 1 2 3 4 5 6 Product 1 Product 2 Product 3 Product 4 Q1 FY18 Q2 FY18 Q3 FY18 Q4 FY18 All Figures in USD MM 10
- 11. Launched a new product01 Achieved 100 MM in a single quarter02 Received “top exporter of the year 2018” award03 KeyDevelopments/ MilestonesAchieved 11
- 12. Monthly Business Evaluation TableofContent Business Overview01 Financial Performance02 Client and Project Updates03 Competitor’s Analysis04 Future Roadmap05 CSR / Miscellaneous Activities06 12
- 13. P&L - KPIs Revenue 50 60 65 72 Q1 FY18 Q2 FY18 Q3 FY18 Q4 FY18 Operating Profit 50 60 65 72 Q1 FY18 Q2 FY18 Q3 FY18 Q4 FY18 COGS 50 60 65 72 Q1 FY18 Q2 FY18 Q3 FY18 Q4 FY18 Net Profit 50 60 65 72 Q1 FY18 Q2 FY18 Q3 FY18 Q4 FY18 13 All Figures in USD MM
- 14. P&L - KPIs (Tabular Form) Q1 FY18 Q2 FY18 Q3 FY18 Q4 FY18 Net Sales 1,703.1 2,022.0 3,184.5 3,476.6 Other Income 4.0 9.9 11.8 31.8 Total Income 1,707.2 2,031.9 3,196.3 3,508.4 Expenses Total Material Consumed 1,282.5 1,374.7 2,028.2 2,200.4 Employee Benefit Expense 92.1 128.4 155.6 226.5 Other Expenses 71.2 167.3 265.6 299.7 EBITDA 261.3 361.6 746.9 781.8 % EBITDA 15.3% 17.8% 23.4% 22.3% Depreciation Expense 28.4 45.8 60.0 69.3 Financing Cost 66.9 128.8 198.1 273.9 Profit Before Tax 166.0 186.9 488.8 438.5 Taxes 4.0 -0.8 138.8 100.8 Profit After Tax 162.0 187.7 350.0 337.7 % PAT 9.5% 9.2% 11.0% 9.6% All Figures in USD MM 14
- 15. Balance Sheet - KPIs Current Assets 50 60 65 72 Q1 FY18 Q2 FY18 Q3 FY18 Q4 FY18 Total Assets 50 60 65 72 Q1 FY18 Q2 FY18 Q3 FY18 Q4 FY18 Current Liabilities 50 60 65 72 Q1 FY18 Q2 FY18 Q3 FY18 Q4 FY18 Total Liabilities 50 60 65 72 Q1 FY18 Q2 FY18 Q3 FY18 Q4 FY18 All Figures in USD MM 15
- 16. Balance Sheet - KPIs (Tabular Form) Q1 FY18 Q2 FY18 Q3 FY18 Q4 FY18 Shareholders‘ Equity 529.8 1,067.8 1,294.6 1,632.4 Non–current Liabilities 535.0 548.2 513.5 989.0 Short–term Borrowings 439.8 622.7 720.6 1,603.8 Trade Payables 352.9 508.9 760.4 433.7 Other Current Liabilities 5.9 147.3 289.5 372.6 Short Term Provisions 21.4 6.2 15.0 28.0 Current Liabilities 820.1 1,285.0 1,785.5 2,438.1 Total Liabilities 1,760.4 2,678.1 3,316.3 4,730.4 All Figures in USD MM 16
- 17. Total Fixed Assets 803.2 1,034.6 1,159.5 1,751.3 Non–Current Investments 26.6 26.6 104.5 26.6 Long Term Loans and Advances - 8.0 73.4 204.8 Other Non–Current Assets - 13.8 - - Current Investments - - - 77.9 Inventories 341.3 731.3 771.3 1,215.8 Trade Receivables 477.6 605.1 996.1 1,061.3 Cash and Bank Balances 33.0 89.5 132.2 258.8 Short–term Loans & Advances 75.8 169.1 76.9 131.6 Other Current Assets 2.9 0.0 2.3 2.4 Current Assets 930.5 1,595.1 1,978.8 2,747.8 Total Assets 1,760.4 2,678.1 3,316.3 4,730.4 All Figures in USD MM 17
- 18. Cash Flow Statement - KPIs Operations 50 60 65 72 Q1 FY18 Q2 FY18 Q3 FY18 Q4 FY18 Investing Activities 50 60 65 72 Q1 FY18 Q2 FY18 Q3 FY18 Q4 FY18 Financial Activities 50 60 65 72 Q1 FY18 Q2 FY18 Q3 FY18 Q4 FY18 Net Increase In Cash 50 60 65 72 Q1 FY18 Q2 FY18 Q3 FY18 Q4 FY18 All Figures in USD MM 18
- 19. Cash Flow Statement - KPIs (Tabular Form) FY12 FY13 FY14 FY15 Cash flow from Operations 3,184 3,476 4,621 6,168 Cash flow from Investing Activities 723 781 834 1,210 Cash flow from Financing Activities 326 337 223 459 Change in Cash & Cash Equivalents 1,017 1,303 1,490 1,836 All Figures in USD MM 19
- 20. Key Financial Ratios 10 (Price-to-Earnings) P/E Ratio Q2 FY18 10 (Price-to-Earnings) P/E Ratio Q1 FY18 10 Debt to Equity Ratio 10 Current Ratio 10 Return on Assets Q2 FY18 10 Return on Assets Q1 FY18 10 Return on Equity 10 Return on Investment 20
- 21. Funding Updates - Debt Bank Final Limits FY18 $ XX MM apprised by Bank name FBWCL NFBWCL TOTAL % % % Bank 1 85 40.5% 171 32.6% 256 34.8% Bank 2 41 19.5% 34 6.5% 75 10.2% Bank 3 15 7.1% 60 11.4% 75 10.2% Bank 4 0 0.0% 30 5.7% 30 4.1% Bank 5 12 5.7% 33 6.3% 45 6.1% Bank 6 3 1.4% 14 2.7% 17 2.3% Bank 7 12 5.7% 60 11.4% 72 9.8% Bank 8 8 3.8% 35 6.7% 43 5.9% Bank 9 4 1.9% 53 10.1% 57 7.8% Bank 10 15 7.1% 15 2.9% 30 4.1% Bank 11 15 7.1% 20 3.8% 35 4.8% Total 210 100% 525 100% 735 100% FBWCL – Fund based working capital Limit; NFBWCL – Non-Fund based working capital limit All Figures in USD MM 21
- 22. 22 Funding Updates - Equity Shareholder Name Shareholding Pattern Total Shares Percentage (%) Name 1 85 40.5% Name 2 41 19.5% Name 3 15 7.1% Name 4 0 0.0% Name 5 12 5.7% Name 6 3 1.4% Name 7 12 5.7% Name 8 8 3.8% Name 9 4 1.9% Name 10 15 7.1% Name 11 15 7.1% Total 210 100% ▪ This slide is 100% editable. Adapt it to your needs and capture your audience's attention. ▪ This slide is 100% editable. Adapt it to your needs and capture your audience's attention. All Figures in USD MM
- 23. Monthly Business Evaluation TableofContent Business Overview01 Financial Performance02 Client and Project Updates03 Competitor’s Analysis04 Future Roadmap05 CSR / Miscellaneous Activities06 23
- 24. Top Customers & Vendors S. No. Customers Amount 1 Name 1 45,203 2 Name 2 45,203 3 Name 3 45,203 4 Name 4 45,203 5 Name 5 45,203 S. No. Vendors Amount 1 Name 1 45,203 2 Name 2 45,203 3 Name 3 45,203 4 Name 4 45,203 5 Name 5 45,203 All Figures in USD MM 24
- 25. Top Debtors & Creditors S. No. Debtors Amount 1 Name 1 45,203 2 Name 2 45,203 3 Name 3 45,203 4 Name 4 45,203 5 Name 5 45,203 S. No. Creditors Amount 1 Name 1 45,203 2 Name 2 45,203 3 Name 3 45,203 4 Name 4 45,203 5 Name 5 45,203 All Figures in USD MM 25
- 26. Client Updates26 Major Clients Acquired 10 New Clients Acquired Client 4 Client 5Client 1 Client 2 Client 3
- 27. Project Updates Major Projects Bagged S. No. Project Name Amount 1 Name 1 2 Name 2 3 Name 3 4 Name 4 5 Name 5 Major Orders In Hand S. No. Client Name Amount 1 Name 1 2 Name 2 3 Name 3 4 Name 4 5 Name 5 Major Projects Lost S. No. Project Name Amount 1 Name 1 2 Name 2 3 Name 3 4 Name 4 5 Name 5 Pipeline Orders S. No. Client Name Amount 1 Name 1 2 Name 2 3 Name 3 4 Name 4 5 Name 5 All Figures in USD MM 27
- 28. Monthly Business Evaluation TableofContent Business Overview01 Financial Performance02 Client and Project Updates03 Competitor’s Analysis04 Future Roadmap05 CSR / Miscellaneous Activities06 28
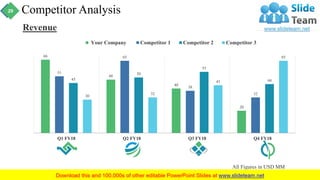
- 29. Competitor Analysis 66 48 40 20 51 65 38 32 45 50 55 44 30 32 43 65 Q1 FY18 Q2 FY18 Q3 FY18 Q4 FY18 Your Company Competitor 1 Competitor 2 Competitor 3 Revenue All Figures in USD MM 29
- 30. Competitor Analysis All Figures in % 70% 15% 10% 5% This slide is 100% editable. Adapt it to your needs and capture your audience's attention. Competitor 1 This slide is 100% editable. Adapt it to your needs and capture your audience's attention. Competitor 2 This slide is 100% editable. Adapt it to your needs and capture your audience's attention. Your Company This slide is 100% editable. Adapt it to your needs and capture your audience's attention. Competitor 3 30
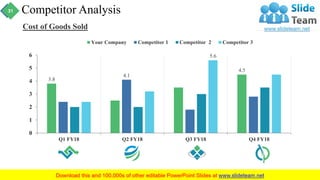
- 31. Competitor Analysis All Figures in USD MM 3.8 4.5 4.1 5.6 0 1 2 3 4 5 6 Q1 FY18 Q2 FY18 Q3 FY18 Q4 FY18 Your Company Competitor 1 Competitor 2 Competitor 3 Cost of Goods Sold 31
- 32. Competitor Analysis All Figures in % Net Profit Margin 3.8% 2.5% 3.5% 4.5% 2.4% 4.1% 1.8% 2.8% 2% 2% 3% 3.5% 2.4% 3.2% 5.6% 4.5% 0 1 2 3 4 5 6 Q1 FY18 Q2 FY18 Q3 FY18 Q4 FY18 Your Company Competitor 1 Competitor 2 Competitor 3 32
- 33. Benchmarking Competitive Intelligence LowHighPrice Low HighQuality Text Here Text Here Text Here Text Here High Quality, Low Price Product 1 High Quality, High Price Product 2 High Quality, Low Price Product 3 High Quality, Low Price Product 4 33
- 34. Monthly Business Evaluation TableofContent Business Overview01 Financial Performance02 Client and Project Updates03 Competitor’s Analysis04 Future Roadmap05 CSR / Miscellaneous Activities06 34
- 35. 30-60-90 Day Plan 1. Watch product and customer videos 2. Review the opening/introductory pitch and related call scripts 3. Review poor follow-up emails and good email tips 4. Review and practice current sales pitch. 30 Days 1. Master the sales pitch with different persons and industries 2. Master giving an overview demo 3. Learn additional details about solutions 60 Days 1. Learn the add-on details about business and products to gain expertise and confidence 90 Days 35
- 36. Light Bulb With Time Planning Ideas This slide is 100% editable. Adapt it to your needs and capture your audience's attention. This slide is 100% editable. Adapt it to your needs and capture your audience's attention. This slide is 100% editable. Adapt it to your needs and capture your audience's attention. This slide is 100% editable. Adapt it to your needs and capture your audience's attention. This slide is 100% editable. Adapt it to your needs and capture your audience's attention. This slide is 100% editable. Adapt it to your needs and capture your audience's attention. 01 02 03 04 05 06 Text Here 36
- 37. Product Roadmap (Layout-1) 01 This slide is 100% editable. Adapt it to your needs and capture your audience's attention. 02 This slide is 100% editable. Adapt it to your needs and capture your audience's attention. 03 This slide is 100% editable. Adapt it to your needs and capture your audience's attention. 04 This slide is 100% editable. Adapt it to your needs and capture your audience's attention. 05 This slide is 100% editable. Adapt it to your needs and capture your audience's attention. 06 This slide is 100% editable. Adapt it to your needs and capture your audience's attention. 37
- 38. Product Roadmap (Layout-2) 0% 10% 20% 30% 40% 50% 60% 70% 80% 90% 100% Jan Feb Mar Apr May Jun Jul Aug Your Text Here Your Text Here Your Text Here Text Here Text Here Text Here Text Here Text Here Text Here Text HereText Here Text Here Text Here Text Here Text Here Text Here Text Here Text Here Text Here This slide is 100% editable. Adapt it to your needs and capture your audience's attention. 38
- 39. Product Roadmap (Layout-3) This slide is 100% editable. Adapt it to your needs and capture your audience's attention. Sep Aug July Jun May Apr Mar Feb Jan Your Text Here Your Text Here Your Text Here Your Text Here Your Text Here Your Text Here Your Text Here Your Text Here Your Text HereYour Text Here Your Text Here Your Text Here Your Text Here Your Text Here Your Text Here Your Text Here 39
- 40. Phases Of Implementation This slide is 100% editable. Adapt it to your needs and capture your audience's attention. Phase5 This slide is 100% editable. Adapt it to your needs and capture your audience's attention.Phase3 This slide is 100% editable. Adapt it to your needs and capture your audience's attention. Phase1 This slide is 100% editable. Adapt it to your needs and capture your audience's attention. Phase2 This slide is 100% editable. Adapt it to your needs and capture your audience's attention. Phase4 40
- 41. Major Roadblocks Or Obstacles This slide is 100% editable. Adapt it to your needs and capture your audience’s attention. This slide is 100% editable. Adapt it to your needs and capture your audience’s attention. This slide is 100% editable. Adapt it to your needs and capture your audience’s attention. This slide is 100% editable. Adapt it to your needs and capture your audience’s attention. Text HereText Here Text HereText Here Text Here Text Here 41
- 42. Major Roadblocks Or Obstacles This slide is 100% editable. Adapt it to your needs and capture your audience's attention. This slide is 100% editable. Adapt it to your needs and capture your audience's attention. This slide is 100% editable. Adapt it to your needs and capture your audience's attention. This slide is 100% editable. Adapt it to your needs and capture your audience's attention. This slide is 100% editable. Adapt it to your needs and capture your audience's attention. 03 040201 42
- 43. Swot Analysis This slide is 100% editable. Adapt it to your needs and capture your audience's attention. Strengths This slide is 100% editable. Adapt it to your needs and capture your audience's attention. Weaknesses This slide is 100% editable. Adapt it to your needs and capture your audience's attention. Threats This slide is 100% editable. Adapt it to your needs and capture your audience's attention. Opportunities S T W O 43
- 44. Monthly Business Evaluation TableofContent Business Overview01 Financial Performance02 Client and Project Updates03 Competitor’s Analysis04 Future Roadmap05 CSR / Miscellaneous Activities06 44
- 45. Corporate Social Responsibility ▪ This slide is 100% editable. Adapt it to your needs and capture your audience's attention. ▪ This slide is 100% editable. Adapt it to your needs and capture your audience's attention. ▪ This slide is 100% editable. Adapt it to your needs and capture your audience's attention. 45
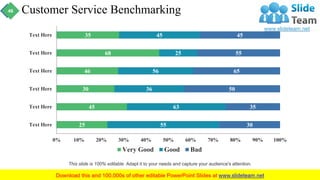
- 46. Customer Service Benchmarking 25 45 30 46 68 35 55 63 36 56 25 45 30 35 50 65 55 45 0% 10% 20% 30% 40% 50% 60% 70% 80% 90% 100% Text Here Text Here Text Here Text Here Text Here Text Here Very Good Good Bad This slide is 100% editable. Adapt it to your needs and capture your audience's attention. 46
- 47. Customer Service Benchmarking Very Poor Poor Okay Good Excellent 20% 40% 60% 80% 100% Phase 8 Phase 7 Phase 6 Phase 5 Phase 4 Phase 3 Phase 2 Phase 1 Text Here Text Here Text Here Text Here Text Here Text Here Text Here Text Here 47
- 48. Organization Chart48 CEO This slide is 100% editable. Adapt it to your needs and capture your audience's attention. Peter Lee Sofia William Director This slide is 100% editable. Adapt it to your needs and capture your audience's attention. Chris Tucker Developer This slide is 100% editable. Adapt it to your needs and capture your audience's attention. Marry Graves Designer This slide is 100% editable. Adapt it to your needs and capture your audience's attention. John Graves Editor This slide is 100% editable. Adapt it to your needs and capture your audience's attention.
- 49. Goals And Success Metrics Text Here Text Here Text Here Text Here Your Text Here Text Here Text Here Text Here Text Here This slide is 100% editable. Adapt it to your needs and capture your audience's attention. 49
- 50. Health Scorecard 10 20 30 40 50 60 70 80 90 1000 50 Overall Score Qualitative Aspects Quantitative Aspects 50
- 51. ▪ This slide is 100% editable. Adapt it to your needs and capture your audience's attention. ▪ This slide is 100% editable. Adapt it to your needs and capture your audience's attention. ▪ This slide is 100% editable. Adapt it to your needs and capture your audience's attention. ▪ This slide is 100% editable. Adapt it to your needs and capture your audience's attention. Coffee Break 51
- 53. Clustered Bar ▪ Product 01 ▪ Product 02 ▪ Product 03 0 10 20 30 40 50 60 70 80 90 100 Q1 Q2 Q3 Q4 Unit Count This graph/chart is linked to excel, and changes automatically based on data. Just left click on it and select “Edit Data”. 53
- 54. Stacked Line Chart This graph/chart is linked to excel, and changes automatically based on data. Just left click on it and select “Edit Data”. 0 10 20 30 40 50 60 70 80 FY 01 FY 02 FY 03 FY 04 FY 05 FY 06 FY 07 FY 08 Inpercentage 70% 25% ▪ Product 01 ▪ Product 02 54
- 55. 0 5 10 15 20 25 30 35 03-05-2017 05-05-2017 08-05-2017 12-04-2017 15-05-2017 17-05-2017 This slide is 100% editable. Adapt it to your needs and capture your audience's attention. ▪ Product 01 Radar Chart This slide is 100% editable. Adapt it to your needs and capture your audience's attention. ▪ Product 02 This graph/chart is linked to excel, and changes automatically based on data. Just left click on it and select “Edit Data”. 55
- 56. This graph/chart is linked to excel, and changes automatically based on data. Just left click on it and select “Edit Data”. 0% 10% 20% 30% 40% 50% 60% 70% 80% 90% 100% DecNovOctSepAugJulJunMayAprMarFebJan 100% This slide is 100% editable. Adapt it to your needs and capture your audience's attention. ▪ Product 01 This slide is 100% editable. Adapt it to your needs and capture your audience's attention. ▪ Product 02 Area Chart 56
- 57. Combo Chart This graph/chart is linked to excel, and changes automatically based on data. Just left click on it and select “Edit Data”. 0 1 2 3 4 5 6 7 8 9 10 0 10 20 30 40 50 60 70 80 90 100 FY 01 FY 02 FY 03 FY 04 FY 05 FY 06 FY 07 FY 08 GrowthRate(%) MarketSize(RMB100Million) In Years ▪ Product 01 ▪ Product 02 ▪ Product 03 57
- 59. 59 Vision This slide is 100% editable. Adapt it to your needs and capture your audience's attention. Mission This slide is 100% editable. Adapt it to your needs and capture your audience's attention. Value This slide is 100% editable. Adapt it to your needs and capture your audience's attention. Our Mission
- 60. 60 About Our Company Values Client This slide is 100% editable. Adapt it to your needs and capture your audience's attention. This slide is 100% editable. Adapt it to your needs and capture your audience's attention. Preferred By ManyTarget Audiences This slide is 100% editable. Adapt it to your needs and capture your audience's attention.
- 61. Name Here Designation This slide is 100% editable. Adapt it to your needs and capture your audience's attention. Name Here Designation This slide is 100% editable. Adapt it to your needs and capture your audience's attention. Name Here Designation This slide is 100% editable. Adapt it to your needs and capture your audience's attention. Name Here Designation This slide is 100% editable. Adapt it to your needs and capture your audience's attention. Our Team61
- 62. Dashboard 50% 0 100 50 Low Medium High This slide is 100% editable. Adapt it to your needs and capture your audience's attention. Medium 25% 0 100 50 Low Medium High This slide is 100% editable. Adapt it to your needs and capture your audience's attention. Low 75% 0 100 50 Low Medium High This slide is 100% editable. Adapt it to your needs and capture your audience's attention. High 62
- 63. Post It 01 This slide is 100% editable. Adapt it to your needs and capture your audience's attention. 02 This slide is 100% editable. Adapt it to your needs and capture your audience's attention. 03 This slide is 100% editable. Adapt it to your needs and capture your audience's attention. 04 This slide is 100% editable. Adapt it to your needs and capture your audience's attention. 63
- 64. Puzzle This slide is 100% editable. Adapt it to your needs and capture your audience's attention. This slide is 100% editable. Adapt it to your needs and capture your audience's attention. This slide is 100% editable. Adapt it to your needs and capture your audience's attention. 02 0301 64
- 65. Target 01 0203 04 This slide is 100% editable. Adapt it to your needs and capture your audience's attention. This slide is 100% editable. Adapt it to your needs and capture your audience's attention. This slide is 100% editable. Adapt it to your needs and capture your audience's attention. This slide is 100% editable. Adapt it to your needs and capture your audience's attention. 65
- 66. Circular This slide is 100% editable. Adapt it to your needs and capture your audience's attention. This slide is 100% editable. Adapt it to your needs and capture your audience's attention. This slide is 100% editable. Adapt it to your needs and capture your audience's attention. This slide is 100% editable. Adapt it to your needs and capture your audience's attention. This slide is 100% editable. Adapt it to your needs and capture your audience's attention. This slide is 100% editable. Adapt it to your needs and capture your audience's attention. 01 02 0304 05 06 66
- 67. Venn This slide is 100% editable. Adapt it to your needs and capture your audience's attention. This slide is 100% editable. Adapt it to your needs and capture your audience's attention. This slide is 100% editable. Adapt it to your needs and capture your audience's attention. This slide is 100% editable. Adapt it to your needs and capture your audience's attention. 02 03 01 04 67
- 68. Text Here Text Here Text Here Text Here Text Here Text Here Mind Map ▪ This slide is 100% editable. Adapt it to your needs and capture your audience's attention. ▪ This slide is 100% editable. Adapt it to your needs and capture your audience's attention. ▪ This slide is 100% editable. Adapt it to your needs and capture your audience's attention. 68
- 69. Lego 01 02 03 04 This slide is 100% editable. Adapt it to your needs and capture your audience's attention. This slide is 100% editable. Adapt it to your needs and capture your audience's attention. This slide is 100% editable. Adapt it to your needs and capture your audience's attention. This slide is 100% editable. Adapt it to your needs and capture your audience's attention. 69
- 70. Silhouettes 01 Text Here This slide is 100% editable. Adapt it to your needs and capture your audience's attention. 02 Text Here This slide is 100% editable. Adapt it to your needs and capture your audience's attention. 70
- 71. Text Here ▪ This slide is 100% editable. Adapt it to your needs and capture your audience's attention. ▪ This slide is 100% editable. Adapt it to your needs and capture your audience's attention. ▪ This slide is 100% editable. Adapt it to your needs and capture your audience's attention. Magnifying Glass 71
- 72. 72 Thank You Address: # street number, city, state Contact numbers: 0123456789 Email Address: emailaddress@123.com