SlideShare a Scribd company logo
ORIGIN & DESTINATION SURVEY IN SITAPURA AREA
1
Monika 2
.Amit Kumar Meena 3
Brajesh Kumar Meena 4
Akshay Kumar
Meena 5
Mahesh Kumar Prajapat
1
Asst. Professor,Poornima institute of Engineering & Technology, Jaipur
2,3,4,5
B.Tech Students, Poornima institute of Engineering & Technology,
Jaipur
Email-amitpiet20@poornima.org
ABSTRUCT:-
The sitapura area is industrial and
institutional area. So large amount of traffics
are coming in this area & generating a great
transportation problem so we are going to
reduce this problem by doing origin and
destination survey.
Origin & Destination (O&D) surveys
provide a detailed picture of the trip patterns
and travel choices of a city. These surveys
collect valuable data related to households
or individuals. This information allows
stakeholders to understand travel patterns
and characteristics; measure trends; provide
input to travel demand model development,
forecasting, and planning for area‐wide
transportation infrastructure needs and
services. monitor progress in implementing
transportation policies.
The focus of the Origin & Destination
(O&D) study is the sitapura area traffic. In
the Sitapura area, the Road side surveys are
conducted to determine the amount of traffic
that could potentially make use of a Sitapura
area.
Road side interview survey is the method of
carrying out a screen line or cordon survey.
Road side interview survey can done either
directly interview driver of vehicle at
selected survey point or by issuing prepared
post card containing question to all or
sample of the driver .the survey point are
selected along the junction of the cordon
line or screen line with the road. For dual
carriageway or road with very little traffic in
both the direction is dealt with
simultaneously. In other case the traffic in
two direction will be interview at different
time. If the survey cover most of the day it
may be sufficient to interview traffic in one
direction only and to assume that the
journey in the opposite direction are the
same as the direction. The data obtained
from the Road side interview survey is
collected quickly in short duration and field
organization is sample. Those hour in which
there maximum traffic flow, it is known as
“peak hour”.
Keyword:-
Origin-Destination study, road side
interview method, recording, accuracy
INTRODUCTION:-
Origin and destination study find out
the pattern of journey that people
makes. The origin and destination
study provides the information for
planning of a transportation facility
or system particularly the location,
design and programming of a new or
improved highway public
transportation and park facility. Its
survey is carried out for assessing
by passable traffic at towns and for
planning of new facility like
expressways. The origin and
destination does not depend on
number of passenger existing at
different location. This survey is
conducted on the basis on future
plan. If we want to some changes of
road design like provide a proper
slope, reduce number of accecident,
origin and destination is necessary to
collect information about origin and
destination. The main purpose of
origin and destination to improve
different type of defect on roadway
and highway. The origin and
destination is conducted within
definite time interval to see increase
the population rate with the help of
origin and destination. We can find
the origin point and destination point
of a particular passenger. We see
different type of accident on
roadway so it is necessary to reduce
the amount of accident by doing
origin and destination. origin and
destination play an important role to
reduce quantity of accident.
The specific uses of O&D survey
data are;-
 Origin and destination datas are
required for traffic engineer.
 It determine the travel demand of
existing roadway and what will be
demand of future.
 To knowing increasing the growth
rate of people we have to required
road parking and other terminal So
we have to required origin and
destination.
 Main objective of the origin and
destination to find the traffic flow in
present condition and what will be
traffic flow on coming next time to
provide better way
 To determine the amount of by
passable traffic
 To develop trip generation and trip
distribution in transport planning
process.
 To determine the extent the present
highway system is adequate and plan
for new facilities.
 To assess the adequacy of parking
facilities and plan for future.
 To determine the travel demand on
existing and future development.
 To locate new terminals, new bridge,
bypass, parking.
 To locate new public stoppage and
improvement in public
transportation.
Traffic studies
The two type of traffic studies
 Traffic volume count
 Origin and destination study
Traffic volume
The traffic volume is define as the
number of vehicles moving in a perticular
direction on a road, that pass a cross
section during specified unit of time. It is
expressed as vehicles per hour or vehicles
per day.
Use methods of volume counting
 Manual method
Manual method:
In this method one or more observior to
count and classify traffic flowing pass a
fixed point
LITERATURE REVIEW:-
The problem of origin and destination
demands are releted to Advanced
Transportation Management and
Information Systems research. An origin &
destination demand matrix is a vector denote
the average number of trips going from
origin to destination point.
There are several methods for formulating
estimators for an unique matrix. In
transportation and regional planning, the
most popular approach is the maximum
entropy model (Van Zuylen and Willumsen,
1980).
Another method is classical statistical
inference techniques. The two main
estimators are the maximum likelihood and
the generalized least-squares. The maximum
likelihood estimator maximizes the
likelihood of observing the experimental
data condition on the true trip matrix. For
this method, distributional assumptions need
to be made for the sample and traffic counts.
On the other hand, no distributional
assumptions need to be made for the
generalized least squares approach. The last
method is the Bayesian one, which uses a
priori probabilities on the trip demands. By
combining these probabilities with the
conditional probability on the traffic counts,
one can obtain the posterior probability of
the demand conditioned on the traffic count.
The arguments of this probability can then
be maximized by different methods.
One critical reference, Van der Zijpp (1997),
added partial origin/destination information
by using Automatic Vehicle Identification
(AVI) technology. An example of an AVI
technology is license plate recognition based
on image processing. They applied the
approach to a sing motor-way corridor with
no route choice alternative and proposed the
Bayesian updating scheme that used
multivariate normal and truncated
multivariate normal assumptions for the
subjective probability distributions.
Jayakrishnan et al. (1994) developed
DYNASMART (DYnamic Network
Assignment Simulation Model for Advanced
Road Telematics)
METHODOLOGY:-
Method of origin & destination survey
 Road-side interview method
 License plate method
 Return post card method
 Tag on-car method
 Home interview method
ROAD SIDE INTERVIEW METHOD:
In the road side interview method,
the observer is standing on road and stop
the vehicle and asking some question and
collect data which required for origin and
destation study. It consists the place and
time of origin and destination, route,
locations of stoppages, the purpose of the
trip, type of vehicle and number of
passengers in each vehicle. The traffic may
be filtered through a prescribed lane by
previous warnings sighs and with the help
of police so that each driver of the selected
sample of vehicles is interviewed. The
percentage also is noted from appropriate
traffic volume study taken
simultaneously.
The advantage of this method the
data is collected quickly in short duration
and the field organization is simple and the
team can be trained quickly. The main
drawback of this method is that the
vehicles are stopped for interview, and
there is delay to the vehicular movement.
Also resentment is likely from the road
user. Further, unless there is enough space,
undue congestion may result due to
stopped vehicles.
The data collected includes origin,
destination, and purpose of vehicle trips,
vehicle occupancy and classification of
vehicle type. This data will assist in the
distribution and assignment of future travel
demands generated in the study area. ROAD
SIDE INTERVIEW METHOD was
selected for the survey; the instrument was
developed with assistance from the town. A
copy of the survey form is presented below.
Survey Questionnaire:
Location:……… Date: …………..
STANDARD FORMAT
Origin-Destination Survey
Questions
Please take a moment to answer a few
questions about your trip. Your responses
will help determine the need for
improvements in this area.
Where did your trip begin?
How many people were in the vehicle,
including the driver?
❒ 1 ❒ 2 ❒ 3 ❒ 4 ❒ 5 or more
What type of vehicle were you in?
❒PassengerVehicle(car,
motorcycle,pick-up truck, minivan)
❒ Commercial vehicle
❒Other
Do you regularly use this route ?
❒ Yes ❒ No
SURVEY LOCATION:-
SURVEY DATA GRAPH (TABLE 1)
SURVEY GRAPH (TABLE 1)
VEHICLE
STUDENT
WORKER/OFFICER
OTHER
S.NO PURPOSEOF TRIP INDIA GATE GONER MOD COMPUCOM
COLLEGE MOD
AGI COLLEGE TOTAL
1 STUDY 900 746 702 312 1389
2 WORKER/OFFICER 410 406 352 390 950
3 OTHER
(HOSPITAL,ETC.)
90 204 116 78 214
4 TOTAL VEHICAL 1800 1356 1170 780 5106
SURVEY GRAPH (TABLE 1)
0
100
200
300
400
500
600
700
800
900
1000
INDIA GATE COMPUCOM MOD GONER MOD AGI COLLEGE
STUDENT
WORKER/OFFICER
OTHER
SURVEY DATA TABLE 2 ( 9:00 TO 10:00 AM)
SURVEY GRAPH 1 (TABLE 2)
Sales
STUDENT
WORKER/OFFICER
OTHER
S.NO PURPOSEOF TRIP INDIA GATE GONER MOD COMPUCOM
COLLEGE MOD
AGI COLLEGE TOTAL
1 STUDY 556 389 316 134 1395
2 WORKER/OFFICER 550 468 418 353 1796
3 OTHER (HOSPITAL,
ETC.)
298 200 178 122 798
4 TOTAL VEHICAL 1404 1057 912 609 3984
SURVEY GRAPH 2 (TABLE 2)
0
50
100
150
200
250
300
350
400
INDIA GATE COMPUCOM MOD GONER MOD AGI COLLEGE
STUDENT
WORKER/OFFICER
OTHER
SURVEY DATA TABLE 3 (2:00 TO 3:00 PM)
SURVEY GRAPH 1(TABLE 3)
Sales
STUDENT
WORKER/OFFICER
OTHER
S.NO PURPOSEOF TRIP INDIA GATE GONER MOD COMPUCOM
COLLEGE MOD
AGI COLLEGE TOTAL
1 STUDY 272 190 155 65 682
2 WORKER/OFFICER 378 322 287 200 1187
3 OTHER
(HOSPITAL,ETC.)
379 104 183 38 704
4 TOTAL VEHICAL 1029 616 625 303 2573
SURVEY GRAPH 2 (TABLE 3)
0
50
100
150
200
250
300
350
400
STUDENT
WORKER/OFFICER
OTHER
SURVEY DATA TABLE 4( 3:30 TO 4:30 PM)
SURVEY GRAPH 1 ( TABLE 4)
Sales
STUDENT
WORKER/OFFICER
OTHER
S.NO PURPOSEOF TRIP INDIA GATE GONER MOD COMPUCOM
COLLEGE MOD
AGI COLLEGE TOTAL
1 STUDY 933 781 734 335 2783
2 WORKER/OFFICER 848 426 370 431 2075
3 OTHER
(HOSPITAL,ETC.)
102 212 120 50 484
4 TOTAL VEHICAL 1883 1419 1224 816 5342
SURVEY GRAPH 2 (TABLE 4)
0
100
200
300
400
500
600
700
800
900
1000
STUDENT
WORKER/OFFICER
OTHER
SURVEY DATA TABLE 5 ( 4:30 TO 5:30 PM )
SURVEY GRAPH 1 (TABLE 5)
Sales
STUDENT
WORKER/OFFICER
OTHER
S.NO PURPOSEOF TRIP INDIA GATE GONER MOD COMPUCOM
COLLEGE MOD
AGI COLLEGE TOTAL
1 STUDY 517 353 295 116 1281
2 WORKER/OFFICER 510 435 376 328 1649
3 OTHER
(HOSPITAL,ETC.)
262 183 166 117 728
4 TOTAL VEHICAL 1289 971 837 561 3658
SURVEY GRAPH 2 ( TABLE 5)
0
100
200
300
400
500
600
STUDENT
WORKER/OFFICER
OTHER
CONCLUSION:-
 Maximum traffic in sitapura area
coming from india gate.
 Minimum traffic in sitapura coming
 from AGI college side.
 Maximum student coming through
compucom mod route.
 Maximum worker are coming
through india gate.
REFRENCES:-
 khanna.s.k,justo.c.e.g -
“Highway engineering”
 http//www.trb.in
 Khadiyali-“Traffic
Engineering”
 Subhash c saxena-Highway
& traffic engineering
 s.p.bindra-Highway
engineering
 www.slideshare.com
origin and destination survey research papeer

More Related Content

PPTX
TRAFFIC VOLUME STUDIES
PPTX
Traffic volume study
PDF
Spot speed studies and speed delay time survey
PPTX
Origin & destination survey
PDF
Spot speed study, transport planning
PPTX
PPTX
Traffic speed study
PPTX
Traffic volume study
TRAFFIC VOLUME STUDIES
Traffic volume study
Spot speed studies and speed delay time survey
Origin & destination survey
Spot speed study, transport planning
Traffic speed study
Traffic volume study

What's hot (20)

PPTX
Intermediate public transport (ipt)
PPTX
Traffic volume survey
PPTX
Traffic Volume Study
PPT
Trip generation
PPTX
Introduction of vissim software
PPTX
PPTX
Chapter 1 traffic characterstics
PPTX
Traffic volume count .pptx
PPTX
Origin – Destination survey
PDF
Traffic and Transportation problems
PPT
Accident Black Spot Identification | KJEI Campus to Chandni Chowk
PDF
Capacity & Level of Service: Highways & Signalized Intersections (Indo-HCM)
PPTX
traffic characteristics
PPT
UTS- Transportation Surveys by Manjurali
PPT
O & d survey
PPTX
Traffic studies volume study
PPTX
Advance road transportation system ppt
PPTX
Traffic congestion and Bottlenecks - Issues and Dimensions
PPTX
Traffic volume study
PPTX
Chapter 2 traffic studies
Intermediate public transport (ipt)
Traffic volume survey
Traffic Volume Study
Trip generation
Introduction of vissim software
Chapter 1 traffic characterstics
Traffic volume count .pptx
Origin – Destination survey
Traffic and Transportation problems
Accident Black Spot Identification | KJEI Campus to Chandni Chowk
Capacity & Level of Service: Highways & Signalized Intersections (Indo-HCM)
traffic characteristics
UTS- Transportation Surveys by Manjurali
O & d survey
Traffic studies volume study
Advance road transportation system ppt
Traffic congestion and Bottlenecks - Issues and Dimensions
Traffic volume study
Chapter 2 traffic studies
Ad

Viewers also liked (20)

PPTX
TRIP GENERATION Survey and ORIGIN / DESTINATION STUDY
PPTX
O and d study
PDF
Traffic & Transportation surveys
PPTX
ChoiceModels_INFORMS_Nov2016
DOCX
Avolon - Proposed Market-Entry Strategy
PDF
Social Media VOC Measurement for Airlines
PDF
AirAsia Assignment_Ruchi_Thapa
PDF
China aviation industry opportunity analysis
PDF
Cama Aviation Articles
PDF
Overbooking policy for an Airline
PPT
Delhi Gurgaon Expressway
DOCX
Overbooking policy revenue management1
PDF
Lec 10 Traffic Stream Models (Transportation Engineering Dr.Lina Shbeeb)
PDF
ORIGIN DESTINATION RO-RO AND CONTAINER TRAFFIC ANALYSIS
PPT
C3010 bab 5
PPTX
Delhi Gurgaon Expressway PPP
PPTX
Traffic Flow Fundamentals
PDF
M9 final report 07.07.12
PPTX
Water distribution planning in urban area
PPT
Decision Matrix
TRIP GENERATION Survey and ORIGIN / DESTINATION STUDY
O and d study
Traffic & Transportation surveys
ChoiceModels_INFORMS_Nov2016
Avolon - Proposed Market-Entry Strategy
Social Media VOC Measurement for Airlines
AirAsia Assignment_Ruchi_Thapa
China aviation industry opportunity analysis
Cama Aviation Articles
Overbooking policy for an Airline
Delhi Gurgaon Expressway
Overbooking policy revenue management1
Lec 10 Traffic Stream Models (Transportation Engineering Dr.Lina Shbeeb)
ORIGIN DESTINATION RO-RO AND CONTAINER TRAFFIC ANALYSIS
C3010 bab 5
Delhi Gurgaon Expressway PPP
Traffic Flow Fundamentals
M9 final report 07.07.12
Water distribution planning in urban area
Decision Matrix
Ad

Similar to origin and destination survey research papeer (20)

PPTX
traffic engineering Origin-Destination-Study.pptx
PPTX
Traffic surveys seminar
PPTX
Unit 3 i ppt
PPTX
Unit 3 i ppt
PPTX
Origin and destination survey
PPTX
Traffic studies ORIGIN AND DESTINATION STUDIES
PPTX
Traffic Engineering And Drainage
PPTX
Presentation on Traffic Volume Study for the course CE 454
PPTX
He final ppt
PPT
Traffic volume study
PPTX
3. Data-Collection-and-Analysis-in-Transport-Planning.pptx
PPTX
ATE - U-I.pptx
PPTX
Traffic Volume Studies
PDF
IRJET- Traffic Management Studies in Avadi
PPTX
Traffic studies for planning bypasses around towns
PDF
UTSP_1 Urban Transportation Engineering PDF Chapter-2
PPTX
Traffic studies and importance
PPTX
road widening
PPTX
Traffic studies (transportation engineering)
PDF
Identification of vehicular growth and its management on nh 202 in ranga redd...
traffic engineering Origin-Destination-Study.pptx
Traffic surveys seminar
Unit 3 i ppt
Unit 3 i ppt
Origin and destination survey
Traffic studies ORIGIN AND DESTINATION STUDIES
Traffic Engineering And Drainage
Presentation on Traffic Volume Study for the course CE 454
He final ppt
Traffic volume study
3. Data-Collection-and-Analysis-in-Transport-Planning.pptx
ATE - U-I.pptx
Traffic Volume Studies
IRJET- Traffic Management Studies in Avadi
Traffic studies for planning bypasses around towns
UTSP_1 Urban Transportation Engineering PDF Chapter-2
Traffic studies and importance
road widening
Traffic studies (transportation engineering)
Identification of vehicular growth and its management on nh 202 in ranga redd...

More from Admeff Construction (9)

PPTX
kirti project
DOCX
गान्धी (MAHATMA GANDHI )
DOCX
Mahatma Gandhi
DOCX
MAHATMA GANDHI
DOCX
MAHATNA GANDHI
PPTX
concrete design with fly ash
PDF
IES PAPER 2013 (CIVIL ENGG.) CONVENTIONAL
PDF
CDS PAPER 2011 (MATH)
kirti project
गान्धी (MAHATMA GANDHI )
Mahatma Gandhi
MAHATMA GANDHI
MAHATNA GANDHI
concrete design with fly ash
IES PAPER 2013 (CIVIL ENGG.) CONVENTIONAL
CDS PAPER 2011 (MATH)

Recently uploaded (20)

PPT
Mechanical Engineering MATERIALS Selection
PDF
PPT on Performance Review to get promotions
PPTX
Sustainable Sites - Green Building Construction
PPTX
Engineering Ethics, Safety and Environment [Autosaved] (1).pptx
PPTX
MET 305 2019 SCHEME MODULE 2 COMPLETE.pptx
PDF
Mitigating Risks through Effective Management for Enhancing Organizational Pe...
PDF
Digital Logic Computer Design lecture notes
PPTX
UNIT 4 Total Quality Management .pptx
PDF
July 2025 - Top 10 Read Articles in International Journal of Software Enginee...
PDF
SM_6th-Sem__Cse_Internet-of-Things.pdf IOT
PPTX
IOT PPTs Week 10 Lecture Material.pptx of NPTEL Smart Cities contd
DOCX
573137875-Attendance-Management-System-original
PPTX
CARTOGRAPHY AND GEOINFORMATION VISUALIZATION chapter1 NPTE (2).pptx
PPTX
Recipes for Real Time Voice AI WebRTC, SLMs and Open Source Software.pptx
PPTX
Lesson 3_Tessellation.pptx finite Mathematics
PPTX
Construction Project Organization Group 2.pptx
PPTX
KTU 2019 -S7-MCN 401 MODULE 2-VINAY.pptx
PPTX
Lecture Notes Electrical Wiring System Components
PPTX
OOP with Java - Java Introduction (Basics)
PPTX
Welding lecture in detail for understanding
Mechanical Engineering MATERIALS Selection
PPT on Performance Review to get promotions
Sustainable Sites - Green Building Construction
Engineering Ethics, Safety and Environment [Autosaved] (1).pptx
MET 305 2019 SCHEME MODULE 2 COMPLETE.pptx
Mitigating Risks through Effective Management for Enhancing Organizational Pe...
Digital Logic Computer Design lecture notes
UNIT 4 Total Quality Management .pptx
July 2025 - Top 10 Read Articles in International Journal of Software Enginee...
SM_6th-Sem__Cse_Internet-of-Things.pdf IOT
IOT PPTs Week 10 Lecture Material.pptx of NPTEL Smart Cities contd
573137875-Attendance-Management-System-original
CARTOGRAPHY AND GEOINFORMATION VISUALIZATION chapter1 NPTE (2).pptx
Recipes for Real Time Voice AI WebRTC, SLMs and Open Source Software.pptx
Lesson 3_Tessellation.pptx finite Mathematics
Construction Project Organization Group 2.pptx
KTU 2019 -S7-MCN 401 MODULE 2-VINAY.pptx
Lecture Notes Electrical Wiring System Components
OOP with Java - Java Introduction (Basics)
Welding lecture in detail for understanding

origin and destination survey research papeer

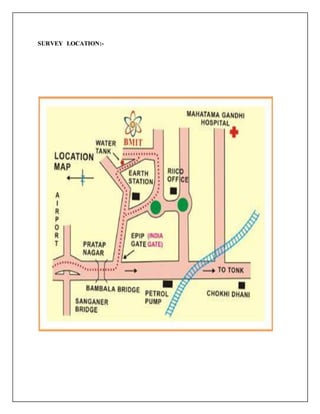
  • 1. ORIGIN & DESTINATION SURVEY IN SITAPURA AREA 1 Monika 2 .Amit Kumar Meena 3 Brajesh Kumar Meena 4 Akshay Kumar Meena 5 Mahesh Kumar Prajapat 1 Asst. Professor,Poornima institute of Engineering & Technology, Jaipur 2,3,4,5 B.Tech Students, Poornima institute of Engineering & Technology, Jaipur Email-amitpiet20@poornima.org ABSTRUCT:- The sitapura area is industrial and institutional area. So large amount of traffics are coming in this area & generating a great transportation problem so we are going to reduce this problem by doing origin and destination survey. Origin & Destination (O&D) surveys provide a detailed picture of the trip patterns and travel choices of a city. These surveys collect valuable data related to households or individuals. This information allows stakeholders to understand travel patterns and characteristics; measure trends; provide input to travel demand model development, forecasting, and planning for area‐wide transportation infrastructure needs and services. monitor progress in implementing transportation policies. The focus of the Origin & Destination (O&D) study is the sitapura area traffic. In the Sitapura area, the Road side surveys are conducted to determine the amount of traffic that could potentially make use of a Sitapura area. Road side interview survey is the method of carrying out a screen line or cordon survey. Road side interview survey can done either directly interview driver of vehicle at selected survey point or by issuing prepared post card containing question to all or sample of the driver .the survey point are selected along the junction of the cordon line or screen line with the road. For dual carriageway or road with very little traffic in both the direction is dealt with simultaneously. In other case the traffic in two direction will be interview at different time. If the survey cover most of the day it may be sufficient to interview traffic in one
  • 2. direction only and to assume that the journey in the opposite direction are the same as the direction. The data obtained from the Road side interview survey is collected quickly in short duration and field organization is sample. Those hour in which there maximum traffic flow, it is known as “peak hour”. Keyword:- Origin-Destination study, road side interview method, recording, accuracy INTRODUCTION:- Origin and destination study find out the pattern of journey that people makes. The origin and destination study provides the information for planning of a transportation facility or system particularly the location, design and programming of a new or improved highway public transportation and park facility. Its survey is carried out for assessing by passable traffic at towns and for planning of new facility like expressways. The origin and destination does not depend on number of passenger existing at different location. This survey is conducted on the basis on future plan. If we want to some changes of road design like provide a proper slope, reduce number of accecident, origin and destination is necessary to collect information about origin and destination. The main purpose of origin and destination to improve different type of defect on roadway and highway. The origin and destination is conducted within definite time interval to see increase the population rate with the help of origin and destination. We can find the origin point and destination point of a particular passenger. We see different type of accident on roadway so it is necessary to reduce the amount of accident by doing origin and destination. origin and destination play an important role to reduce quantity of accident. The specific uses of O&D survey data are;-  Origin and destination datas are required for traffic engineer.  It determine the travel demand of existing roadway and what will be demand of future.  To knowing increasing the growth rate of people we have to required road parking and other terminal So we have to required origin and destination.  Main objective of the origin and destination to find the traffic flow in present condition and what will be traffic flow on coming next time to provide better way  To determine the amount of by passable traffic  To develop trip generation and trip distribution in transport planning process.  To determine the extent the present highway system is adequate and plan for new facilities.  To assess the adequacy of parking facilities and plan for future.  To determine the travel demand on existing and future development.  To locate new terminals, new bridge, bypass, parking.
  • 3.  To locate new public stoppage and improvement in public transportation. Traffic studies The two type of traffic studies  Traffic volume count  Origin and destination study Traffic volume The traffic volume is define as the number of vehicles moving in a perticular direction on a road, that pass a cross section during specified unit of time. It is expressed as vehicles per hour or vehicles per day. Use methods of volume counting  Manual method Manual method: In this method one or more observior to count and classify traffic flowing pass a fixed point LITERATURE REVIEW:- The problem of origin and destination demands are releted to Advanced Transportation Management and Information Systems research. An origin & destination demand matrix is a vector denote the average number of trips going from origin to destination point. There are several methods for formulating estimators for an unique matrix. In transportation and regional planning, the most popular approach is the maximum entropy model (Van Zuylen and Willumsen, 1980). Another method is classical statistical inference techniques. The two main estimators are the maximum likelihood and the generalized least-squares. The maximum likelihood estimator maximizes the likelihood of observing the experimental data condition on the true trip matrix. For this method, distributional assumptions need to be made for the sample and traffic counts. On the other hand, no distributional assumptions need to be made for the generalized least squares approach. The last method is the Bayesian one, which uses a priori probabilities on the trip demands. By combining these probabilities with the conditional probability on the traffic counts, one can obtain the posterior probability of the demand conditioned on the traffic count. The arguments of this probability can then be maximized by different methods. One critical reference, Van der Zijpp (1997), added partial origin/destination information by using Automatic Vehicle Identification (AVI) technology. An example of an AVI technology is license plate recognition based on image processing. They applied the approach to a sing motor-way corridor with no route choice alternative and proposed the Bayesian updating scheme that used multivariate normal and truncated multivariate normal assumptions for the subjective probability distributions. Jayakrishnan et al. (1994) developed DYNASMART (DYnamic Network Assignment Simulation Model for Advanced Road Telematics)
  • 4. METHODOLOGY:- Method of origin & destination survey  Road-side interview method  License plate method  Return post card method  Tag on-car method  Home interview method ROAD SIDE INTERVIEW METHOD: In the road side interview method, the observer is standing on road and stop the vehicle and asking some question and collect data which required for origin and destation study. It consists the place and time of origin and destination, route, locations of stoppages, the purpose of the trip, type of vehicle and number of passengers in each vehicle. The traffic may be filtered through a prescribed lane by previous warnings sighs and with the help of police so that each driver of the selected sample of vehicles is interviewed. The percentage also is noted from appropriate traffic volume study taken simultaneously. The advantage of this method the data is collected quickly in short duration and the field organization is simple and the team can be trained quickly. The main drawback of this method is that the vehicles are stopped for interview, and there is delay to the vehicular movement. Also resentment is likely from the road user. Further, unless there is enough space, undue congestion may result due to stopped vehicles. The data collected includes origin, destination, and purpose of vehicle trips, vehicle occupancy and classification of vehicle type. This data will assist in the distribution and assignment of future travel demands generated in the study area. ROAD SIDE INTERVIEW METHOD was selected for the survey; the instrument was developed with assistance from the town. A copy of the survey form is presented below. Survey Questionnaire: Location:……… Date: ………….. STANDARD FORMAT Origin-Destination Survey Questions Please take a moment to answer a few questions about your trip. Your responses will help determine the need for improvements in this area. Where did your trip begin? How many people were in the vehicle, including the driver? ❒ 1 ❒ 2 ❒ 3 ❒ 4 ❒ 5 or more What type of vehicle were you in? ❒PassengerVehicle(car, motorcycle,pick-up truck, minivan) ❒ Commercial vehicle ❒Other Do you regularly use this route ? ❒ Yes ❒ No
  • 6. SURVEY DATA GRAPH (TABLE 1) SURVEY GRAPH (TABLE 1) VEHICLE STUDENT WORKER/OFFICER OTHER S.NO PURPOSEOF TRIP INDIA GATE GONER MOD COMPUCOM COLLEGE MOD AGI COLLEGE TOTAL 1 STUDY 900 746 702 312 1389 2 WORKER/OFFICER 410 406 352 390 950 3 OTHER (HOSPITAL,ETC.) 90 204 116 78 214 4 TOTAL VEHICAL 1800 1356 1170 780 5106
  • 7. SURVEY GRAPH (TABLE 1) 0 100 200 300 400 500 600 700 800 900 1000 INDIA GATE COMPUCOM MOD GONER MOD AGI COLLEGE STUDENT WORKER/OFFICER OTHER
  • 8. SURVEY DATA TABLE 2 ( 9:00 TO 10:00 AM) SURVEY GRAPH 1 (TABLE 2) Sales STUDENT WORKER/OFFICER OTHER S.NO PURPOSEOF TRIP INDIA GATE GONER MOD COMPUCOM COLLEGE MOD AGI COLLEGE TOTAL 1 STUDY 556 389 316 134 1395 2 WORKER/OFFICER 550 468 418 353 1796 3 OTHER (HOSPITAL, ETC.) 298 200 178 122 798 4 TOTAL VEHICAL 1404 1057 912 609 3984
  • 9. SURVEY GRAPH 2 (TABLE 2) 0 50 100 150 200 250 300 350 400 INDIA GATE COMPUCOM MOD GONER MOD AGI COLLEGE STUDENT WORKER/OFFICER OTHER
  • 10. SURVEY DATA TABLE 3 (2:00 TO 3:00 PM) SURVEY GRAPH 1(TABLE 3) Sales STUDENT WORKER/OFFICER OTHER S.NO PURPOSEOF TRIP INDIA GATE GONER MOD COMPUCOM COLLEGE MOD AGI COLLEGE TOTAL 1 STUDY 272 190 155 65 682 2 WORKER/OFFICER 378 322 287 200 1187 3 OTHER (HOSPITAL,ETC.) 379 104 183 38 704 4 TOTAL VEHICAL 1029 616 625 303 2573
  • 11. SURVEY GRAPH 2 (TABLE 3) 0 50 100 150 200 250 300 350 400 STUDENT WORKER/OFFICER OTHER
  • 12. SURVEY DATA TABLE 4( 3:30 TO 4:30 PM) SURVEY GRAPH 1 ( TABLE 4) Sales STUDENT WORKER/OFFICER OTHER S.NO PURPOSEOF TRIP INDIA GATE GONER MOD COMPUCOM COLLEGE MOD AGI COLLEGE TOTAL 1 STUDY 933 781 734 335 2783 2 WORKER/OFFICER 848 426 370 431 2075 3 OTHER (HOSPITAL,ETC.) 102 212 120 50 484 4 TOTAL VEHICAL 1883 1419 1224 816 5342
  • 13. SURVEY GRAPH 2 (TABLE 4) 0 100 200 300 400 500 600 700 800 900 1000 STUDENT WORKER/OFFICER OTHER
  • 14. SURVEY DATA TABLE 5 ( 4:30 TO 5:30 PM ) SURVEY GRAPH 1 (TABLE 5) Sales STUDENT WORKER/OFFICER OTHER S.NO PURPOSEOF TRIP INDIA GATE GONER MOD COMPUCOM COLLEGE MOD AGI COLLEGE TOTAL 1 STUDY 517 353 295 116 1281 2 WORKER/OFFICER 510 435 376 328 1649 3 OTHER (HOSPITAL,ETC.) 262 183 166 117 728 4 TOTAL VEHICAL 1289 971 837 561 3658
  • 15. SURVEY GRAPH 2 ( TABLE 5) 0 100 200 300 400 500 600 STUDENT WORKER/OFFICER OTHER
  • 16. CONCLUSION:-  Maximum traffic in sitapura area coming from india gate.  Minimum traffic in sitapura coming  from AGI college side.  Maximum student coming through compucom mod route.  Maximum worker are coming through india gate. REFRENCES:-  khanna.s.k,justo.c.e.g - “Highway engineering”  http//www.trb.in  Khadiyali-“Traffic Engineering”  Subhash c saxena-Highway & traffic engineering  s.p.bindra-Highway engineering  www.slideshare.com