SlideShare a Scribd company logo
OpManager 7 Major Features OpManager is network monitoring software  that has the following significant features:  Auto discovery of network devices  Automatic device mappings for servers, routers, printers switches and firewalls Real-time network fault monitoring through poling, SNMP, WMI, Telnet / SSH; email and SMS alerts Reporting  Network device configuration and tools like an Mib Browser and the Switch Port Mapper
Automatic Network Discovery Process  – When logging into OpManager a network discovery occurs collecting data to build a map of the network.
Home tab  – The home tab shows a high level dashboard view of the network with overall availability, alarms and a list of types of equipment that can be monitored.
Business Views  – I’ve created a business view that includes my wireless router and Internet gateway router.  The dashboard shows 100% uptime based on about 10 minute of operations.
Mapping and Reporting : This displays map of 192.168.1.0 – 192.168.1.99 on my home network and a report of uptime on a desktop computer on the network.
Auto Discovery  - data collected through auto discovery is used to produce maps from different perspectives.  This illustrates a data center view.
Maps, monitoring and alerts  - This shows a mapping of a web server with detailed information about the health of the particular services, and overall server operating system performance metrics like CPU utilization, memory and memory and disk utilization.  It provides much more information than simply the server is up or the server is down.
Fault Monitoring –  The rack view map shows an intuitive green, yellow, orange, red code to indicate systems are up, attention is required, reporting trouble or a critical failure has occurred.  From here a network operator or engineer can drill into the system to see what the particular issue relates to.  This saves valuable time and allows for proactive support and fast recovery.
Alerts  -  This behavior can be configured based on conditions related to polling or SNMP traps.  It may be good to add the “service is down” condition to this and perhaps the “event log rules generate alarm” item.
Alerts  – In this case the Play Sound alert configured in the last slide is applied to the Apache II server based on  an SNMP trap or if the device misses 3 polls.
Reporting  – Reports are available for servers, routers, switches, domain controllers, all devices and inventory as is indicated by the tabs below.  This is an example of the Server Health Report.  Time frames can be selected from 12 hours to last month and custom time frames can be specified.  Certainly the decision of how long to keep the data will impact the flexibility of how much historical reporting can be done.
Tools  -  OpManger includes several additional tools.  This shows the Mib Browser that is included.  The Mib displayed here is the linkDown Mib which signifies that the sending protocol entity sees a link failure.
OpManager is a powerful tool  -  This shows the configuration for discovery, device configuration, monitoring, alerts and tools like the Mib browser, port mapper, scheduler, etc.  OpManger is GUI based and is very intuitive as all of these diagrams help to demonstrate.

More Related Content

PPTX
OpManager Technical Overview
PPT
Proof of Concept Guide for ManageEngine OpManager
PPT
Monitor and manage everything Cisco using OpManager
PPTX
New OpManager v12
PPT
Top 5 server performance problems and how to resolve them using OpManager
PPT
Microsoft Infrastructure Monitoring using OpManager
PPT
OpManager Review
PPTX
Best Network Performance Monitoring Tool
OpManager Technical Overview
Proof of Concept Guide for ManageEngine OpManager
Monitor and manage everything Cisco using OpManager
New OpManager v12
Top 5 server performance problems and how to resolve them using OpManager
Microsoft Infrastructure Monitoring using OpManager
OpManager Review
Best Network Performance Monitoring Tool

What's hot (20)

PPTX
5 reasons why you need a network monitoring tool
PPTX
Network Monitoring Basics
PPTX
OpManager training - Device discovery and classification.
PPTX
Free NetFlow Analyzer training - Getting the initial settings right
PPTX
Network Maps & Reporting [Free OpManager Training - Part 5]
PPTX
OpManager - Technical overview
PPTX
5 reasons to use OpManager Plus
PPTX
Gulf Chemicals & Metallurgy manages 1700 interfaces with OpManager
PPTX
Network fault management and IT automation training
PPTX
Opmanager technical overview
PPTX
Dashboards, widgets, business views & 3D-data centre
PPTX
[Free OpManager training] Part 4- Network fault-management & IT automation
PPTX
Why Configuration Management Matters
PPTX
Topic on DCIM - ManageEngine | OpManager
PPTX
Network and server performance monitoring training
PPTX
5 ways you can benefit from OpManager Plus
PDF
Monitoring active-directory
PPTX
Simplifying IT operations manament with OpManager
PPTX
Free OpManager training_ Part 2-server monitoring
PPTX
IT Solutions Provider in Kosovo uses Bandwidth monitoring, NetFlow Analyzer
5 reasons why you need a network monitoring tool
Network Monitoring Basics
OpManager training - Device discovery and classification.
Free NetFlow Analyzer training - Getting the initial settings right
Network Maps & Reporting [Free OpManager Training - Part 5]
OpManager - Technical overview
5 reasons to use OpManager Plus
Gulf Chemicals & Metallurgy manages 1700 interfaces with OpManager
Network fault management and IT automation training
Opmanager technical overview
Dashboards, widgets, business views & 3D-data centre
[Free OpManager training] Part 4- Network fault-management & IT automation
Why Configuration Management Matters
Topic on DCIM - ManageEngine | OpManager
Network and server performance monitoring training
5 ways you can benefit from OpManager Plus
Monitoring active-directory
Simplifying IT operations manament with OpManager
Free OpManager training_ Part 2-server monitoring
IT Solutions Provider in Kosovo uses Bandwidth monitoring, NetFlow Analyzer
Ad

Similar to OpManager Major Features (20)

PPT
Op Manager Review
PPT
Op Manager Review
PPT
Week 7 Cheryl Brown
PPT
Week 7 Cheryl Brown
PPT
Week 7 Cheryl Brown
PPT
Week 7 Assignment
PPT
Week 9 Assignment Op Manager
PPT
Cis516 Week 7
PDF
OpManager-Overview-30-9-14.pdf
PPT
Vincent Haynes(Cis516 Assignment Week 9)
PPT
Role of OpManager in event and fault management
PPT
Irizarry M Cis516 Week7
PPTX
ManageEngine OpUtils Technical Overview
PPTX
Opmanagertechnicaloverview 160128123947
PPTX
Overview OpManager
PPT
O P Manager
 
PPT
Presentation Cis516
 
PPTX
Opmanager Workshop - Middle East
PPT
Quick Look At Op Manager
 
PPTX
OpUtils Free training
Op Manager Review
Op Manager Review
Week 7 Cheryl Brown
Week 7 Cheryl Brown
Week 7 Cheryl Brown
Week 7 Assignment
Week 9 Assignment Op Manager
Cis516 Week 7
OpManager-Overview-30-9-14.pdf
Vincent Haynes(Cis516 Assignment Week 9)
Role of OpManager in event and fault management
Irizarry M Cis516 Week7
ManageEngine OpUtils Technical Overview
Opmanagertechnicaloverview 160128123947
Overview OpManager
O P Manager
 
Presentation Cis516
 
Opmanager Workshop - Middle East
Quick Look At Op Manager
 
OpUtils Free training
Ad

Recently uploaded (20)

PPTX
Belch_12e_PPT_Ch18_Accessible_university.pptx
PDF
How to Get Funding for Your Trucking Business
PDF
Chapter 5_Foreign Exchange Market in .pdf
PPTX
CkgxkgxydkydyldylydlydyldlyddolydyoyyU2.pptx
PPTX
Business Ethics - An introduction and its overview.pptx
PPTX
Lecture (1)-Introduction.pptx business communication
PDF
20250805_A. Stotz All Weather Strategy - Performance review July 2025.pdf
PDF
Elevate Cleaning Efficiency Using Tallfly Hair Remover Roller Factory Expertise
PDF
SIMNET Inc – 2023’s Most Trusted IT Services & Solution Provider
PDF
Power and position in leadershipDOC-20250808-WA0011..pdf
PPTX
Amazon (Business Studies) management studies
PPTX
AI-assistance in Knowledge Collection and Curation supporting Safe and Sustai...
PPTX
ICG2025_ICG 6th steering committee 30-8-24.pptx
PDF
Nidhal Samdaie CV - International Business Consultant
PPTX
HR Introduction Slide (1).pptx on hr intro
DOCX
Euro SEO Services 1st 3 General Updates.docx
PDF
Deliverable file - Regulatory guideline analysis.pdf
PDF
A Brief Introduction About Julia Allison
PDF
IFRS Notes in your pocket for study all the time
PPTX
New Microsoft PowerPoint Presentation - Copy.pptx
Belch_12e_PPT_Ch18_Accessible_university.pptx
How to Get Funding for Your Trucking Business
Chapter 5_Foreign Exchange Market in .pdf
CkgxkgxydkydyldylydlydyldlyddolydyoyyU2.pptx
Business Ethics - An introduction and its overview.pptx
Lecture (1)-Introduction.pptx business communication
20250805_A. Stotz All Weather Strategy - Performance review July 2025.pdf
Elevate Cleaning Efficiency Using Tallfly Hair Remover Roller Factory Expertise
SIMNET Inc – 2023’s Most Trusted IT Services & Solution Provider
Power and position in leadershipDOC-20250808-WA0011..pdf
Amazon (Business Studies) management studies
AI-assistance in Knowledge Collection and Curation supporting Safe and Sustai...
ICG2025_ICG 6th steering committee 30-8-24.pptx
Nidhal Samdaie CV - International Business Consultant
HR Introduction Slide (1).pptx on hr intro
Euro SEO Services 1st 3 General Updates.docx
Deliverable file - Regulatory guideline analysis.pdf
A Brief Introduction About Julia Allison
IFRS Notes in your pocket for study all the time
New Microsoft PowerPoint Presentation - Copy.pptx

OpManager Major Features

  • 1. OpManager 7 Major Features OpManager is network monitoring software that has the following significant features: Auto discovery of network devices Automatic device mappings for servers, routers, printers switches and firewalls Real-time network fault monitoring through poling, SNMP, WMI, Telnet / SSH; email and SMS alerts Reporting Network device configuration and tools like an Mib Browser and the Switch Port Mapper
  • 2. Automatic Network Discovery Process – When logging into OpManager a network discovery occurs collecting data to build a map of the network.
  • 3. Home tab – The home tab shows a high level dashboard view of the network with overall availability, alarms and a list of types of equipment that can be monitored.
  • 4. Business Views – I’ve created a business view that includes my wireless router and Internet gateway router. The dashboard shows 100% uptime based on about 10 minute of operations.
  • 5. Mapping and Reporting : This displays map of 192.168.1.0 – 192.168.1.99 on my home network and a report of uptime on a desktop computer on the network.
  • 6. Auto Discovery - data collected through auto discovery is used to produce maps from different perspectives. This illustrates a data center view.
  • 7. Maps, monitoring and alerts - This shows a mapping of a web server with detailed information about the health of the particular services, and overall server operating system performance metrics like CPU utilization, memory and memory and disk utilization. It provides much more information than simply the server is up or the server is down.
  • 8. Fault Monitoring – The rack view map shows an intuitive green, yellow, orange, red code to indicate systems are up, attention is required, reporting trouble or a critical failure has occurred. From here a network operator or engineer can drill into the system to see what the particular issue relates to. This saves valuable time and allows for proactive support and fast recovery.
  • 9. Alerts - This behavior can be configured based on conditions related to polling or SNMP traps. It may be good to add the “service is down” condition to this and perhaps the “event log rules generate alarm” item.
  • 10. Alerts – In this case the Play Sound alert configured in the last slide is applied to the Apache II server based on an SNMP trap or if the device misses 3 polls.
  • 11. Reporting – Reports are available for servers, routers, switches, domain controllers, all devices and inventory as is indicated by the tabs below. This is an example of the Server Health Report. Time frames can be selected from 12 hours to last month and custom time frames can be specified. Certainly the decision of how long to keep the data will impact the flexibility of how much historical reporting can be done.
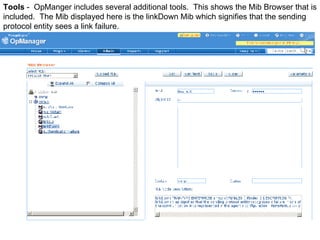
  • 12. Tools - OpManger includes several additional tools. This shows the Mib Browser that is included. The Mib displayed here is the linkDown Mib which signifies that the sending protocol entity sees a link failure.
  • 13. OpManager is a powerful tool - This shows the configuration for discovery, device configuration, monitoring, alerts and tools like the Mib browser, port mapper, scheduler, etc. OpManger is GUI based and is very intuitive as all of these diagrams help to demonstrate.